Munich Personal RePEc Archive
Shipwrecks on the Great Lakes and the
Lake Carriers Association
Decker, Christopher and Corcoran, William and Flynn,
David
University of Nebraska at Omaha, University of North Dakota
30 October 2008
Online at
https://mpra.ub.uni-muenchen.de/11378/
Shipwrecks on the Great Lakes and the Lake Carriers Association
by
Christopher S. Decker, William Corcoran Department of Economics College of Business Administration
University of Nebraska at Omaha Omaha, NE 68164
and
David T. Flynn Department of Economics College of Bus. & Pub. Administration
University of North Dakota Grand Forks, ND 58202
Abstract
In this paper we investigate the relationship between accidental shipping losses on the Great Lakes between 1900 and 1939 and the role the Lake Carriers Association played in preventing or limiting such losses. Moreover, we address the relative benefits of private effort, through the Lake Carriers Association, and public sector effort to reduce shipwrecks and capital losses through weather information transmission from the National Weather Service. Overall, our results confirm existing research that weather information supplied through National Weather Services stations generally resulted in smaller accidental shipping losses. However, we also find that increases in Lake Carriers Association membership also reduces such losses, and to a greater degree. This result is consistent across different measures and types of shipping losses.
I. Introduction
This paper addresses the role the Lake Carriers Association (LCA) may have
played in reducing accidental shipping losses on the Great Lakes between 1900 and 1939.
In doing so, this study sheds light on the potential social benefits that industry trade
associations may generate, as well as offering a comparison of private sector successes in
achieving desirable outcomes, through such associations, with public sector successes.
While these institutions have existed in some form or another for centuries,
industry trade associations became increasingly widespread in the early part of the
twentieth century (Laurent, 1992). Membership usually required the payment of dues
and regular meetings were established, largely for the purposes of information exchange
and market coordination activities. Much of the existing scholarship on trade
associations has highlighted the market coordination efforts of these organizations.
Roberts (1926), for instance, articulated that the major benefit of any trade association is
to create an environment whereby members profit by the affiliation, perhaps through
coordinated supply constraints and fixing agreements. Indeed, in a study of
price-fixing cases in the United States, Hay and Kelley (1974) reported that 7 out of 8 cases
involving 15 firms, trade associations were involved. Frass and Greer (1977) found that
trade associations were involved in some 36 percent of all price fixing cases and Posner
(1970) found in his study of all anti-trust cases in the United States, 44 percent involved
trade associations. As for Great Lakes shipping, the Lake Carriers Association, the
largest such association in that region of the United States, was the most important
(Laurent, 2002).1 As a result, it is generally accepted that trade associations can and do result in higher prices and supply restrictions that generate welfare losses in the markets
in which they operate.
However, several authors have indicated that the activities of trade associations go
beyond price and production coordination and that these other activities may be welfare
enhancing. Bradley (1965) describes nine different activities engaged in by trade
associations. Among the most salient include standardization of products and services
and establishing criteria for product quality, sponsoring research designed to improve
product or service quality, and educational efforts such as the sponsoring of workshops,
short courses, and clinics, for such things as employee training and safety. Schaede
(2000,176) documents successful efforts by a Japanese trade association representing
door shutter manufacturers, to introduce safety and minimum quality standards that
became adopted industry-wide. Evidence is mixed however, as to the efficacy of trade
association efforts to bring about socially desirable outcomes. King and Lenox (2000)
investigated the Chemical Manufacturers Association’s (CMA) Responsible Care
program and found little evidence that firms that participated in Responsible Care
improved their environmental performance more than nonmembers, suggesting that
sanctions levied by the CMA on its participating members for failing to achieve program
goals were not efficacious enough.
The King and Lenox (2000) study hints that a combination of public and private
efforts to impact firm behavior may be necessary. This, however, prompts the question:
1
Which element, public or private, offers the greatest opportunity for success? The
literature of public versus private enterprise is substantial. Yet there is still much debate
over the relative merits of each. In an investigation of nineteenth century arctic
explorations, Karpoff (2001) found evidence that while publicly funded expeditions were
better funded, they tended to meet with less success and greater disaster than
privately-funded exploration efforts. In an investigation of Great Lakes shipping in the 1870s and
1880s, Craft (1998), found publicly-funded construction and management of weather
stations, and, one can infer, the weather information collected and disseminated by these
stations, on the Great Lakes substantially reduced shipping losses, thus generating
socially welfare enhancing results. While Craft (1998) did not consider private-sector
efforts to reduce losses, the results clearly indicate that government investments in
promoting economic growth can be quite effective.
Herein lies the critical element to this study. A theme running through much of
the previous discussion is information dissemination. It is quite clear that publicly funded
and managed weather stations provide information on weather patterns, etc., valuable to
shippers. Yet, as alluded to above, trade associations also provide an efficient means of
information sharing that would be quite valuable to shippers as well. The association, in
effect, can be thought of as a means of making valuable information more readily
available, and easily implemented. Indeed, each shipper’s experiences could be unique
as would the solutions to the problems they encounter. Thus knowledge would be
distributed among different firms within the association. Examples of this knowledge
might be solutions involving new techniques, the use of new products, and information of
handling certain cargos, etc.).Much of this would be unknown if not shared. That is, there
are large externalities (spillovers) from the sharing of such information.
Indeed, the type of detailed information flow facilitated by a trade association is
likely to improve the long-term efficiency of day to day operations, including safety
promotion, which is unlikely to be supplied by government. In fact, as we detail below,
the Lake Carriers Association periodically published several information booklets
specifically addressing guidelines to promote on-board safety operation to prevent loss of
like and cargo. Many of these guidelines are far too detailed to have been instituted
(legislated) through standard governmental regulation, and unlikely to be communicated
via weather station information.
In what follows, we reconsider Craft’s (1998) model to address the role the Lake
Carriers Association played in reducing accidental shipping losses on the Great Lakes
between 1900 and 1939. Overall, our results confirm existing research that weather
information supplied through National Weather Services stations (a public-sector effort)
generally resulted in smaller accidental shipping losses. However, we also find that
increases in Lake Carriers Association membership reduce losses as well, and to a greater
degree. This result is consistent across different measures and types of shipping losses.
This paper is organized as follows. In section II we briefly review the link
between trade associations and self-regulatory safety efforts with specific attention paid
to such efforts by the Lake Carriers Association. In section III we present our basic model
and data. In section IV we discuss some salient econometric issues and in section V we
present our basic results. Section VI concludes.
While much attention is given to trade associations and their impact on prices,
production and a few other market-oriented attributes such as product standardization and
quality control, little attention has been addressed that specifically links trade associations
with safety promotion, whether it be worker or consumer-related. Clearly there is
liability attached to negligence toward both consumers and workers, not to mention the
loss of productive inputs and capital in the event of accidents, and therefore it would
seem natural that industry trade associations would devote energy to limiting such losses.
Aldrich (1997) documents several actions undertaken by trade associations to
limit work-place accidents. The National Association of Manufacturers created the
“Committee on Accident Prevention” in 1910. The National Metal Trades Association
created an office of accident prevention, publishing its Accident Prevention Bulletin
annually since 1914. Moreover, the Portland Cement Association and the National
Electric Light Association both formed bureaus and committees to address work-place
safety and accident prevention in the early twentieth century as well.2
Evidence suggests that the Lake Carriers Association was also quite concerned
with limiting shipping accidents on the Great Lakes. This may not be too surprising
given the composition of vessel types during the latter part of the nineteenth and early
twentieth century. In an extensive study of Great Lakes shipping, Williamson (1977)
describes the development of the Great Lakes as a shipping hub from 1870 to 1911 in
substantial detail. His work describes the significant changes in Great Lakes shipping
over the 40 years of his study including products shipped, origination of shipping, and the
2
changes in the type of ship. This last item mentioned bears directly on our analysis. The
five years from 1885 to 1890 witnessed a 50% increase in the steam ship size due, at least
in part, to the construction of all-steel vessels (Williamson, 183). The additional weight
and other stability characteristics of such vessels tend to make them less prone to
accidents caused by extreme weather conditions relative to their wind-powered
counterparts. Yet, despite the advantages of steel steam ships, wind-powered sailing
vessels remained in use. This was due to the fact that many were towed by steam ships
for all or part of the trip, extending their useful life as commodity carriers (Williamson,
183). Hence, heightened safety concerns remained.3
Indeed, the Lake Carriers Association’s concern with accident prevention at the
turn of the twentieth century was is evident from a number of examples. In conjunction
with the Fleet Engineers Association, the Lake Carriers Association periodically
published and distributed booklets to members outlining recommendations for accident
prevention on board ship. These recommendations could be quite detailed, involving
appropriate lighting on board ship, the location of ladders and handlebars, face guards on
machinery, location of fire extinguishers, and signage on board ship.4 While many of the recommendations appear to be aimed specifically at limiting crew injuries, and the
number are specifically designed to ensure fewer losses to cargo and vessels. For
3
Indeed, safety and accident prevention continue to be of interest even today. For instance, Fowler and Sogard (2000) recently attempted to quantify the risks in shipping. While their analysis does not include any variables for information sharing between shipping companies, clearly quantifying the dangers of navigating these waters continue to be an area of interest.
4
instance, there are several recommendations for the safe handling of steam valves,
boilers, and pipelines to limit the start and spread of shipboard fires.
The detail as to safety recommendations is noteworthy. There are
recommendation as to the location of likes, color of paint, the use and location of cables
instead of link chains as well. To give a specific example, to prevent injury or loss of
life, when crews are painting over the side of a ship on a staging that an additional
attendant remain above the staging on deck at all times and that all stagings should use
manila rope of at least 2.5 inches. This type of detail is likely only to be understood by
experienced shippers and is only likely to be effectively implemented through within
industry information mechanisms. It is highly unlikely that such suggestions (or
regulations) would be articulated through governmental authority. Clearly, then, the
Lake Carriers Association was actively involved in efforts to limit shipboard accidents in
a highly detailed way. Given this background, in what follows, we test whether or not,
and to what degree, these efforts were successful.
III. Model and Data
To address the hypotheses discussed above, we developed a model similar to that
of Craft (1998) in terms of the type of variables used and general model estimation. The
general model statement is:
LOSS=f (LCA / TONS,STATIONS, CYC,STEAM & DIESEL, PROD). (1)
In the analysis to follow, LOSS is measured three different ways. Using data collected
from various issues of the US Department of Commerce’s Statistical Abstract of the
damaged, 2) the adjusted dollar value of vessel losses, and 3) the
inflation-adjusted dollar value of lost cargo between 1897 and 1939.5
STATIONS measures the number National Weather Service Weather Bureau
stations operating in Michigan, Minnesota and Wisconsin, in a given year. This data was
compiled from the Index of Original Surface Weather Records for stations in these three
states as published by the National Climatic Data Center, US Department of Commerce.
As in Craft (1998), these stations, constructed and operated by the federal government,
proxied for public weather information services. We expect this variable to be negatively
related to shipping losses as more weather-related information should result in
navigational and other accident-avoidance activities by shippers on the Great Lakes.
To capture the impact of extreme adverse weather events, we collected data
published in Angel and Isard (1998) on the number of major cyclones, CYC, that were
recorded between 1900 and 1939.6 One would expect larger losses in those years registering higher major cyclone activity.
Using data published in Barnet (1992), STEAM&DIESEL is the proportion of
total ships sailing on the Great Lakes that are not powered by sail but rather by either
steam or diesel engines in a given year. Following Craft’s (1998) results, ships powered
by steam or diesel are more likely to be larger, more stable, embody superior navigation
5
Issues of these statistical abstracts from 1878 to the current publication can be found at the following web page: http://www.census.gov/compendia/statab/past_years.html. The dollar value of shipping losses were deflated using the US GNP implicit Price deflator in Gordon (2000, A1).
6
technology, and have hulls made of steel, characteristics that would likely result in fewer
wrecks and losses.7
Finally, again following Craft’s (1998) specification, PROD measures the total
tonnage of grains, coal and iron shipped on the Great Lakes in a given year. Again taken
from Barnet (1992), this variable proxies for commercial shipping activity on the Great
Lakes. A higher degree of shipping activity, larger payloads and more vessels in use,
might put more vessels at risk, thus one would expect higher losses associated with
higher shipping volumes.8
To this basic model we add Lake Carriers Association membership data published
by Laurent (1992, 2002). The variable LCA/TONS measures the total registered vessel
tonnage of association members (LCA) to total gross vessel tonnage (TONS) on the
northern Great Lakes.9 To be consistent with our shipping losses data, we took from these sources data for the period 1897 to 1939. 10 If, as suggested above, LCA membership does have benefits in terms of communication and information
7
While contrary to Craft’s (1998) findings, one might hypothesize that a greater proportion of such ships might result in greater losses in that 1) these ships are larger and therefore constitute a greater capital loss in the event of a wreck and 2) they tend to carry larger cargos, likely of higher aggregate value than sail ships.
8
Craft (1998) actually included two “market activity” variables: total vessel tonnage on the Great Lakes – as a proxy for industry capacity, and a “commerce” variable constructed based on various product shipments data. These two variables were correlated at 74 percent in his dataset, suggesting a possible collinear relationship (and perhaps one of the reasons for the general finding that these variables were not significant determinants of shipping losses). In our dataset, we too find a relatively high degree of correlation between total vessel tonnage on the Great Lakes, TONS, and tons of product shipped, PROD, of about 60 percent. Therefore, we chose to drop total Great Lakes tonnage as an independent regressor from our model since the inclusion of it did generate an upward bias in regression coefficient standard errors.
9
We chose to look at registered tonnage rather than, say, number of association members, because the tonnage data likely better reflects relative importance and industry influence. .
10
dissemination, one would expect fewer accidents and smaller losses overall with
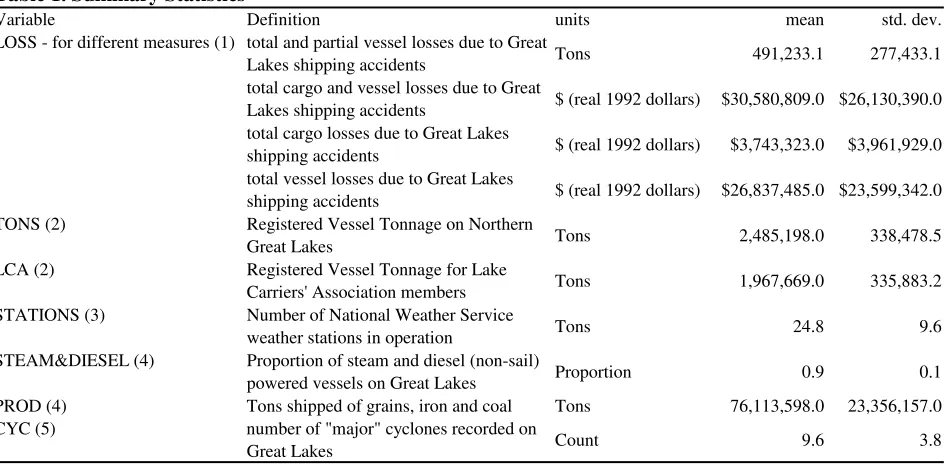
membership increases.11 Summary statistics of the variables are presented in Table 1. IV. Econometric Specification
In our first specification, we model physical vessel tonnage lost as a proportion of
total vessel tonnage. When implementing our empirical model, we could have used
standard OLS, modeling the natural log of LOSS/TONS as a function of the variables
discussed above. However, doing so does not take into account that the accident rate is
essentially bounded between zero and one. Hence, the unbiasedness and consistency of
the resulting estimators cannot be assured.12 We therefore adopt a modeling procedure which explicitly takes this characteristic into account. Specifically, we assume
LOSS/TONS is a conditional probability that follows a logistical distribution. Using the
independent variables discussed above, we estimate the following equation:
t t
0 1 t 1 t 1 2 t
t t
3 t 4 t
5 t t
LOSS / TONS
ln ln(LCA / TONS ) ln(STATIONS )
1 LOSS / TONS
ln(CYC ) ln(STEAM & DIESEL ) ln(PROD ) − − ⎛ ⎞ = + + ⎜ − ⎟ ⎝ ⎠ + + + +
β β β
β β
β ε
(2)
where we use the log-form of our continuous dependent variables so that the resulting
coefficients can, with some modification, be conveniently interpreted as elasticities. This
is of importance to this study given the quantitative nature of the hypotheses discussed
11
To be sure, a more precise test of the association’s impact would be to test losses by members only and compare those with losses of non-members. Unfortunately, no such accident or loss data appears to exist. Hence, we are left testing the impact membership has on aggregate shipping losses. That said, it is nonetheless a valuable test of an association’s impact. Not only might we expect that increases in membership reduces losses among members, thus reducing aggregate losses, it is also reasonable to presume that increased membership may result in information spillover into nonmembers. Hence, reductions in losses by non-members may occur as well. Again, while there is currently no way to determine whether or not non-members benefit in this way given available data, clearly an overall reduction in losses is possible.
12
above testing the relative benefit of public versus private effort to limit accidental
shipping losses.
Since the error term in (2) is heteroscedastic, we first estimate our model via OLS
to obtain consistent estimates of the model parameters. The fitted equation is then used
to construct weights that correct the heteroscedasticity problem.13 Equation (2) is then re-estimated via weighted least squares.
In our second and third specifications, we model the inflation-adjusted dollar
value of vessel losses and the inflation-adjusted dollar value of lost cargo via OLS:
t 0 1 t 1 t 1 2 t
3 t 4 t
5 t t
ln(LOSS ) ln(LCA / TONS ) ln(STATIONS )
ln(CYC ) ln(STEAM & DIESEL ) ln(PROD )
− −
= + +
+ +
+ +
β β β
β β
β ε
(3)
Again, the double-log specification is useful in that the resulting coefficients can be
interpreted as elasticities and their relative magnitudes assessed.14
Before continuing, a couple of points need to be made, first note that we lagged
LCA/TONS. If membership in the LCA is advantageous as it facilitates information flow
between members on means of limiting losses, one might hypothesize that increased
membership may be prompted by increased vessel and cargo losses by non-members.
That is, the causal link between losses and LCA membership may run counter to what it
13
For the Logistic model, the error term εt is heteroscedastic with a variance equal to
1 ( )
(1 )
t
t t t
Var n
ε =
Λ − Λ where Λt is the LOSS/TONS and nt is the number of “trials” in period t. Hence, the weights used to estimate (2) are wt = ntΛt(1− Λt). Since Λtis not known, we adopt the following two step procedure where we first estimate (2) via OLS and then calculate the fitted values of the injury rate: Λt , which are used to construct wt and then used to re-estimate (2). The number of “trials”, nt, is total vessel tonnage, i.e the total tonnage “at risk” of being lost in period t.
14
hypothesized. To limit this concern, we lagged LCA membership by one year in
equations (2) and (3).15
Second, there is a potential endogenous relationship between LCA membership
and the number of weather stations. One might reason that the LCA has an incentive to
apply political pressure to increase weather station construction on the Great Lakes. To
address this issue, we conducted a pair-wise Granger Causality test between LCA
t-1/TONSt-1 and STATIONSt. Presumably, if increased LCA membership prompts
subsequent weather station construction, then LCAt-1/TONSt-1 should Granger-cause
STATIONSt. The results of this test are reported in Table 2. In each instance, we fail to
reject the null indicating there is no statistical evidence to support a link between these
two variables.16
Third, given the time-series nature of our data, if the LOSS data are
non-stationary (i.e. they contain a stochastic trend), these data may follow a random walk,
may therefore not be predictable based on any econometric specification, and might
require estimating our model in first differences. Moreover, concerns over spurious
regression results arise. Table 3 presents estimation results for a standard Augmented
Dickey-Fuller (ADF) test conducted on our dependent variables from equations (1) and
(2).17 The results suggest that we can reject the presence of a unit root in these series.
15
Moreover, statistical tests, not reported here but available from the authors upon request, suggested a Granger-causal direction favoring the direction hypothesized above, i.e. that LCA membership impacts losses, and not the reverse. Since this statistical test involves lagged values of LCA membership, we retained that structure here.
16
We only included two lags in our Granger causality models due to the relatively small size of our dataset. That said, we did try alternative lag lengths ranging from 1 lag to 5 lags. In each instance, no statistical causality could be detected.
17
The ADF formulation estimated here was − −
=
Δ = α + βt + ρ − t 1+
∑
n Δ t i+ εti 1
y trend ( 1)y y , where yt
Therefore, the three LOSS series do not follow a random walk process. We thus proceed
with our estimation in levels.
V. Results
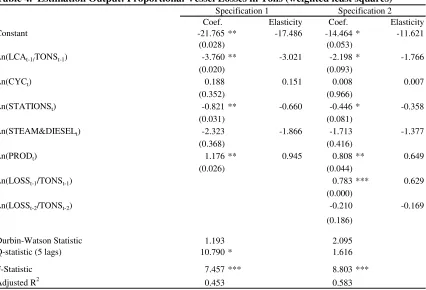
The results from our logit model are presented in Table 4. The first set of results,
labeled specification 1, indicate that the model explains about 45 percent of the total
variation in the proportion physical vessel losses and the F-statistic of 7.46 indicates that
the model has statistical validity. Neither the proportion of non-sail power vessels nor
the frequency of major cyclones on the Great Lakes seems to impact tonnage losses.
However, the coefficient on the PROD variable is statistically significant at the 5 percent
level as is the STATIONS variable, consistent with Craft (1998). The coefficient on the
LCA/TONS variable is statistically significant as well. However, the Durbin-Watson and
Q-statistic indicate the presence of serial correlation, suggesting the standard errors on
the coefficients might be biased downwards.18
To correct for this, in the second set of results, labeled specification 2, we include
two lags of the natural log of the LOSS/TONS variable. The resulting reported
Q-statistic, as well as visual inspection of the resulting residual correlogram, indicates no
serial correlation.19
Again, with this correction for serial correlation, we find that the PROD and
STATIONS variables continue to be statistically significant. Increases in PROD and
time, as one might expect given innovation in shipping and weather station construction, we have not included a separate time trend variable. Note that we also checked for stationarity of our primary variable of interest, LCA/TONS. It too proved not to contain a unit root, further limiting the concern over spurious results.
18
The Q-statistic reported here is calculated using five lags of the estimated residuals’ correlations. We also calculated Q-statistics using between 2 and 10 lags. In each case, the Q-statistics were consistent with those reported here.
19
STATIONS tend to reduce proportional vessel losses, as hypothesized. Moreover,
increased membership in the Lake Carriers Association also proved to be effective at
reducing proportional vessel losses.
In terms of magnitude of effect, after some modification to the estimated
coefficients, we find that, while increasing both association membership and the number
of government constructed and run weather stations does reduce proportional vessel
losses, increases in association membership appears to have a greater impact. For
instance, using results reported in column 2 of Table 4, a one percent increase in
LCA/TONS reduces proportional vessel losses by 1.77 percent. By way of comparison, a
one percent increase in STATIONS results in a 0.45 percent reduction in proportional
vessel losses.20
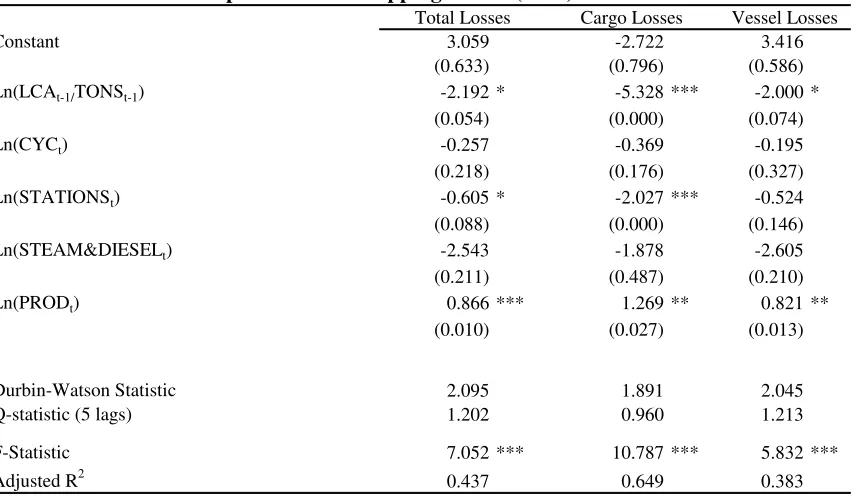
Table 5 reports estimation results for the dollar value of total loss (vessel plus
cargo), cargo loss, and vessel loss equations. Inspection of the adjusted R2 indicates that between 38 and 55 percent of the total variation in losses is explained by these models
and the F-statistics indicate that each equation is statistically meaningful. Moreover, the
Durbin-Watson and Q-statistics indicate no serial correlation as well.
While the proportion of non-sail power vessels and the frequency of major
cyclones on the great lakes still appear to have no impact on vessel and/or cargo losses,
consistent with both Craft (1998) and results presented in Table 4, PROD, STATIONS,
and LCA/TONS are consistently statistically significant determinants of total, cargo, and
vessel losses. In each instance, increased shipping of iron, grains, and coal increase
20
While it may appear that the estimated coefficient is the elasticity itself, strictly speaking, this is not true.
For the logistic model:ln ln
1 β
⎛ ⎞ = ⎜ − ⎟ ⎝ ⎠
x
z
x , the resulting elasticity is β(1−x). We follow convention and
losses, while increases in the number of government run weather stations, and an increase
in Lake Carriers Association membership, reduce losses.
Moreover, the estimated elasticity on LCA/TONS consistently shows that Lake
Carriers Association membership levels have a significantly larger impact on reducing
shipping losses than does the number of National Weather Service stations. For total
losses, a one percent increase in LCA/TONS reduces losses by 2.19 percent, where as a
one percent increase in STATIONS reduces accidents by 0.61 percent. For cargo losses, a
one percent increase in LCA/TONS reduces such losses by 4.68 percent. By contrast, a
one percent increase in STATIONS reduces cargo losses by 1.54 percent. For vessel
losses only, a one percent increase in LCA/STATIONS reduces such losses by 2.00
percent, while the number of weather stations appears not to impact the dollar value of
vessel losses. In general both increased weather stations and increased membership
reduce losses, though increases in association membership appear to generate greater
loss-saving benefits.
VI. Conclusion
In this paper we have investigated the relationship between accidental shipping
losses on the Great Lakes between 1900 and 1939 and the role the Lake Carriers
Association played in preventing or limiting such losses. Moreover, we address the
relative benefits of private effort to promote safety information, through the Lake
Carriers Association, and public sector effort to reduce shipwrecks and capital losses
through weather information transmission from the National Weather Service. Overall,
our results confirm Craft’s (1998) findings that weather information supplied through
National Weather Services stations generally resulted in smaller accidental shipping
also reduces such losses, and to a greater degree. This result is consistent across different
measures and types of shipping losses as well. It seems reasonable, then, to conclude that
as the association’s reach increases, there is increased informal information flows that
ultimately benefit shipping activities in the form of reduced accidental losses of capital
and cargo. To be sure, from our results we cannot conclude that increased Lake Carrier’s
Association membership could serve as a substitute for weather station construction and
maintenance by the National Weather Service. Clearly, public-sector funding that
facilitates the dissemination of weather information is effective at reducing accidental
losses. However, information flows through private efforts also to reduce losses, and
References
Aldrich, Mark. 1997. Safety First. Baltimore: The Johns Hopkins University Press.
Angel, James R., and Isard, Scott A. 1998. “The Frequency and Intensity of Great Lake Cyclones,” Journal of Climate, 11: 61-71.
Barnett, Le Roy. 1992. Shipping Literature of the Great Lakes: A Catalog of Company Publications, 1852-1990. East Lancing: Michigan University Press.
Bradley, Joseph F. 1965. The Role of Trade Associations and Professional Business Societies in America. University Park: The Pennsylvania State University Press.
Craft, Erik D. 1998. “The Value of Weather Information Services for Nineteenth-Century Great Lakes Shipping.” American Economic Review, 88(5): 1059-1076.
Fowler, Timothy G. and Sorgard, Erik. 2000. “Modeling Ship Transportation Risk.” Risk Analyst, 20(2) 225-244.
Frass, Arthur G., and Greer, Douglas F. 1977. “Market Structure and Price Collusion: An Empirical Analysis.” Journal of Industrial Economics, 21:21-44.
Gordon. Robert J. 2000. Macroeconomics, 8th ed. Reading: Addison-Wesley Longman, Inc.
Greene, William H. 1993. Econometric Analysis, 2nd ed. Englewood Cliffs: Prentice-Hall, Inc.
Hay, George A., and Kelley, Daniel. 1974. “An Empirical Survey of Price-Fixing Conspiracies.” Journal of Law and Economics, 17:13-38.
Karpoff, Jonathan M. 2001. “Public versus Private Initiative in Arctic Exploration: The Effects of Incentives and Organizational Structure.” Journal of Political Economy, 109(1): 38-78.
King, Andrew A., and Kenox, Michael J. 2000. “Industry Self-Regulation Without Sanctions: The Chemical Industry’s Responsible Care Program.” Academy of Management Journal, 43(4): 689-716.
Kmenta, Jan. 1986. Elements of Econometrics, 2nd ed. New York: Macmillan.
Laurent, Jerome K. 1992. “Trade Associations and Competition in Great Lakes Shipping: The Pre-World War I Years.” International Journal of Maritime History, 4(2): 117-153.
Newey, W. and West, K. 1987. “A Simple Positive Demi-Definite, Heteroscedasticity and Autocorrelation Consistent Covariance Matrix.” Econometrica, 55: 703-708.
Posner, Richard A. 1970. “A Statistical Study of Antitrust Enforcement.” Journal of Law and Economics, 13: 365-419.
Roberts, George. 1926. “The Present Legal Status of Trade Associations and Their Problems.” Proceedings of the Academy of Political Science in the City of New York, 11(4): 5-18.
Schaede, Ulrike. 2000. Cooperative Capitalism: Self-Regulation, Trade Associations, and the Antimonopoly Law in Japan. New York: Oxford University Press.
United States Bureau of the Census. 1975. Historical Statistics of the United States, Colonial Times to 1970, Bicentennial Edition, Part 1. Washington, D.C.
United States Bureau of the Census. Various years. Statistical Abstract of the United States. Washington, D.C.
Table 1. Summary Statistics
Variable Definition units mean std. dev.
LOSS - for different measures (1) total and partial vessel losses due to Great
Lakes shipping accidents Tons 491,233.1 277,433.1
total cargo and vessel losses due to Great
Lakes shipping accidents $ (real 1992 dollars) $30,580,809.0 $26,130,390.0 total cargo losses due to Great Lakes
shipping accidents $ (real 1992 dollars) $3,743,323.0 $3,961,929.0 total vessel losses due to Great Lakes
shipping accidents $ (real 1992 dollars) $26,837,485.0 $23,599,342.0 TONS (2) Registered Vessel Tonnage on Northern
Great Lakes Tons 2,485,198.0 338,478.5
LCA (2) Registered Vessel Tonnage for Lake
Carriers' Association members Tons 1,967,669.0 335,883.2 STATIONS (3) Number of National Weather Service
weather stations in operation Tons 24.8 9.6
STEAM&DIESEL (4) Proportion of steam and diesel (non-sail)
powered vessels on Great Lakes Proportion 0.9 0.1
PROD (4) Tons shipped of grains, iron and coal Tons 76,113,598.0 23,356,157.0 CYC (5) number of "major" cyclones recorded on
Great Lakes Count 9.6 3.8
1
Statistical Abstract of the United States, various years.
2
Laurent (1992, 2002)
4
Barnett (1992)
5
Angel and Isard (1998)
3
Index of Original Surface Weather Records: Michigan, Index of Original Surface Weather Records: Minnesota, Index of Original Surface Weather Records: Wisconsin, National Climatic Data Center, US Department of Commerce.
Table 2. Pairwise Granger Causality Tests
Note: two lags employed
Null Hypothesis: F-stat p-value
ln(STATIONSt) does not Granger Cause ln(LCAt-1/TONSt-1) 1.81 0.18
Table 3. Augmented Dickey Fuller Test Results
coeff t-statistic
Vessel tons lost/total tonnage -0.401 -3.237
Dickey Fuller critical values: 5% level -3.521
10% level -3.191
Trend -0.002 -2.142**
Value of cargo and vessel losses -1.003 -6.350
Dickey Fuller critical values: 5% level -3.521
10% level -3.191
Trend -947,906 -2.889***
Value of cargo losses -1.467 -6.385
Dickey Fuller critical values: 5% level -3.521
10% level -3.191
Trend -254,282 -4.289***
Value of vessel losses -0.966 -6.110
Dickey Fuller critical values: 5% level -3.521
10% level -3.191
Trend -754,228 -2.550**
Dickey Fuller critical values from Davidson and MacKinnon (1993, Table 20.2). * - Significant at the 10 percent level.
** - Significant at the 5 percent level.
LOSS variables: first differenced dependent variable with trend, lag length determined by Schwarz Information Criterion
Elasticity Elasticity
Constant -21.765 ** -17.486 -14.464 * -11.621
(0.028) (0.053)
Ln(LCAt-1/TONSt-1) -3.760 ** -3.021 -2.198 * -1.766
(0.020) (0.093)
Ln(CYCt) 0.188 0.151 0.008 0.007
(0.352) (0.966)
Ln(STATIONSt) -0.821 ** -0.660 -0.446 * -0.358
(0.031) (0.081)
Ln(STEAM&DIESELt) -2.323 -1.866 -1.713 -1.377
(0.368) (0.416)
Ln(PRODt) 1.176 ** 0.945 0.808 ** 0.649
(0.026) (0.044)
Ln(LOSSt-1/TONSt-1) 0.783 *** 0.629
(0.000)
Ln(LOSSt-2/TONSt-2) -0.210 -0.169
(0.186)
Durbin-Watson Statistic 1.193 2.095
Q-statistic (5 lags) 10.790 * 1.616
F-Statistic 7.457 *** 8.803 ***
Adjusted R2 0.453 0.583
Table 4. Estimation Output: Proportional Vessel Losses in Tons (weighted least squares)
p-values reported in parentheses. * - Significant at the 10 percent level. ** - Significant at the 5 percent level. *** - Significant at the 1 percent level.
Coef.
Specification 1
Coef.
[image:22.612.96.522.373.663.2]Constant 3.059 -2.722 3.416
(0.633) (0.796) (0.586)
Ln(LCAt-1/TONSt-1) -2.192 * -5.328 *** -2.000 *
(0.054) (0.000) (0.074)
Ln(CYCt) -0.257 -0.369 -0.195
(0.218) (0.176) (0.327)
Ln(STATIONSt) -0.605 * -2.027 *** -0.524
(0.088) (0.000) (0.146)
Ln(STEAM&DIESELt) -2.543 -1.878 -2.605
(0.211) (0.487) (0.210)
Ln(PRODt) 0.866 *** 1.269 ** 0.821 **
(0.010) (0.027) (0.013)
Durbin-Watson Statistic 2.095 1.891 2.045
Q-statistic (5 lags) 1.202 0.960 1.213
F-Statistic 7.052 *** 10.787 *** 5.832 ***
Adjusted R2 0.437 0.649 0.383
[image:23.612.96.522.66.315.2]Estimate using Newey-West Variance Covarience Matrix.
Table 5. Estimation Output: Value of Shipping Losses (OLS)
Total Losses Cargo Losses Vessel Losses