Ring current asymmetry from global
simulations using a high-resolution electric
field model
V. K. Jordanova
Space Science Center, University of New Hampshire, Durham, New Hampshire, USA
A. Boonsiriseth, R. M. Thorne, and Y. Dotan
Department of Atmospheric Sciences, University of California, Los Angeles, California, USA
Received 16 April 2003; revised 22 August 2003; accepted 7 October 2003; published 20 December 2003.
[1] We study ring current evolution during the 10 January 1997 geomagnetic storm, comparing results from two inner magnetospheric convection electric field models: (1) the Kp-dependent Volland-Stern (V-S) model and (2) the high spatial and temporal resolution assimilative mapping of ionospheric electrodynamics (AMIE) model, coupled with our global ring current model. We have added a penetration electric field (driven by partial ring current closure in the ionosphere) to the AMIE model which improves the agreement at lowL shells with Polar/EFI measurements, and we mapped the modified AMIE convection electric potentials (MACEP) to the equatorial plane. Both V-S and MACEP convection models predict a very asymmetric local time distribution of ring current energy density during the main and early recovery phase of the storm. However, the peak of the medium energy ions is located during the main phase near midnight when the MACEP model is used, while it is located near dusk using V-S. In both models the energy density peak is located near dusk during the early recovery, and the ring current becomes symmetric during the late recovery phase. Ring current injection is larger, penetrating to lower Lshells, and theDstindex is significantly better reproduced using MACEP rather than using V-S model. We compare model results with Polar data and find reasonably good agreement with both models at larger Lshells and near dawn. The enhanced storm time distributions at low L shells near dusk are better modeled with MACEP.
Electromagnetic ion cyclotron (EMIC) waves are predominantly excited near Dst minimum, have larger wave gain, and cause stronger ion precipitation using the MACEP model. In this case the calculated ion precipitation patterns exhibit features consistent with storm time Polar/IPS observations and show enhancements within the plasmaspheric bulge and along the duskside plasmapause. In the dusk to midnight sector atL > 5, however, there seems to be a need to include the effect of an additional scattering process during highly active conditions. INDEXTERMS:2778 Magnetospheric Physics: Ring current; 2760 Magnetospheric Physics: Plasma convection; 2716 Magnetospheric Physics: Energetic particles, precipitating; 2772 Magnetospheric Physics: Plasma waves and instabilities; 2788 Magnetospheric Physics: Storms and substorms;KEYWORDS:magnetic storms, convection, ring current, wave-particle interactions, modeling
Citation: Jordanova, V. K., A. Boonsiriseth, R. M. Thorne, and Y. Dotan, Ring current asymmetry from global simulations using a high-resolution electric field model,J. Geophys. Res.,108(A12), 1443, doi:10.1029/2003JA009993, 2003.
1. Introduction
[2] A major scientific goal of the national ‘‘space weather’’
program is to be able to predict strong geomagnetic disturbances since enhanced energetic particle fluxes and induced currents could damage satellites and endanger human life in space. A thorough understanding of the processes that operate in the inner magnetosphere is nec-essary to achieve this goal. New remote satellite
measure-ments enabling to ‘‘image’’ the energetic ion population and to study ring current morphology during storms demon-strate the complexity of this problem. Part of the NASA Explorer Program, the IMAGE Mission [Burch, 2000] provides global multi-spectral images of the Earth’s inner magnetosphere at time scales of few minutes and is able to capture the dynamics of geomagnetic storms. Energetic ions charge exchange with low-energy neutrals from the geo-corona and produce energetic neutral atoms (ENA) that are imaged by the low (LENA) [Moore et al., 2001], medium (MENA) [Pollock et al., 2001], and high (HENA) [Mitchell et al., 2001] imagers. These observations provide an JOURNAL OF GEOPHYSICAL RESEARCH, VOL. 108, NO. A12, 1443, doi:10.1029/2003JA009993, 2003
Copyright 2003 by the American Geophysical Union. 0148-0227/03/2003JA009993$09.00
opportunity to investigate global inner magnetospheric struc-tures and their relation to solar wind driving. An evolution from a compact, asymmetric ring current during the storm main phase to an expanded and more symmetric one during late recovery phase was thus observed [Pollock et al., 2001].
Mitchell et al.[2001] found that during a major storm the ion injection penetrated deeper into the magnetosphere (L
3 RE), while during a small storm the injection was restricted
to a region much further from Earth. Burch et al. [2001] reported simultaneous global observations of the plasma-sphere and the ring current which showed the peak of the ring current to be nearly centered at the plasmapause. The ring current images from HENA near minimum Dst indicated significant precipitation near dusk overlapping with the plasmapause. This was the first global simultaneous obser-vation of the spatial relationship between the ring current, the plasmapause, and the associated ion precipitation. Energetic neutral atom images were recently reported from the Swedish microsatellite Astrid-1 byC:son Brandt et al. [2002]. This satellite was launched in a polar, 1000 km orbit and carried an ENA imager to observe the ring current from a low-altitude vantage point at the equator. Images in the energy range 26 – 37 keV taken from below the ring current at MLT = 3 showed a narrow region of intense ENA emissions in the postmid-night local time sector. Several possible scenario that may explain the origin of this plasma and require further investi-gation were suggested.
[3] Global numerical modeling is a powerful tool for
understanding the complexity of a highly dynamical region such as the near-Earth space environment. Such modeling has demonstrated that the major mechanism controlling ring current evolution is the time-varying convection electric field [e.g.,Jordanova et al., 1998, 2001b]. Other processes contributing to ring current buildup are radial diffusion [e.g., Chen et al., 1994, 1997] and substorm-induced electric field [e.g., Fok et al., 1996; Wolf et al., 1997]; however, they affect mostly the high-energy particles and have smaller effect on ring current injection. The enhanced cross-tail convection electric field during the main phase of a storm transports newly injected particles from the mag-netotail earthward, accelerates them, and increases the preexisting ring current energy density. A simple analytical form of the inner magnetospheric convection model was obtained by Volland [1973] and Stern [1975], which was made time-dependent through the 3 hour averaged planetary
Kpindex byMaynard and Chen[1975]. Using this model, a reasonable agreement between model predicted total energy content of the ring current and subsequently calculatedDst
using the Dessler-Parker-Sckopke relation [Dessler and Parker, 1959;Sckopke, 1966] with the measuredDstindex was reported [Jordanova et al., 1998;Kozyra et al., 1998;
Liemohn et al., 1999]. Detailed comparison of modeled ring current distributions with measured spectra, however, showed pronounced differences at lower L shells [Kistler et al., 1999; Jordanova et al., 1999a]. Recent in situ observations from the electric field instrument on CRRES [Wygant et al., 1998;Rowland and Wygant, 1998] indicated the presence of strong electric fields at lowLduring storm time, which differ significantly from the Volland-Stern model. The Volland-Stern model gives a realistic descrip-tion of the overall potential drop across the magnetosphere, but does not take into account the rapid temporal and spatial
variations of the magnetospheric electric field during peri-ods of high geomagnetic activity.
[4] In this study, we develop our ring current model further
implementing a more complex electric field model based on the assimilative mapping of ionospheric electrodynamics (AMIE) [Richmond, 1992] with the addition of a penetration electric field. The ionospheric electric potential obtained with the AMIE procedure involves the synthesis of ground-based and satellite data. During the 10 January 1997 storm we investigate, the AMIE input included data from six SuperDARN radars, NOAA, DMSP, and Polar satellites, and 119 ground magnetometers [Lu et al., 1998;
Boonsiriseth et al., 2001]. This allowed the electric field to be specified with excellent spatial resolution on time scales (5 minute) sufficient to follow ring current storm time dynamics. We simulate ring current evolution during the 10 January storm and show the effect of the spatial and temporal variability of the convection electric field on ring current buildup and decay, morphology, and ion precipitation. This study is meant as a contribution to the development of predictive ‘‘space weather’’ models, a primary objective of the NASA’s SEC Division and is relevant to the analysis of the new data sets from the IMAGE Mission.
2. Modeling Ring Current Dynamics 2.1. Transport of Ring Current Particles
[5] The interaction of the January 1997 magnetic cloud
with Earth was a well-studied International Solar Terrestrial Physics (ISTP) event and the interplanetary conditions were described in detail byBurlaga et al.[1998] andFarrugia et al. [1998]. An interplanetary shock was detected by the instruments on Wind at1 UT, 10 January. It was driven by a magnetic cloud with a negative to positive IMFBzpolarity
variation inside the cloud and minimum at 7:30 UT, 10 January. The passage at Earth of this magnetic cloud induced a storm of moderate intensity with minimumDst=
83 nT at10 UT, 10 January, and maximumKp= 6. The main phase of the storm coincided with the first4 hours of cloud passage.
[6] We investigate the spatial and temporal development
of the ring current ion population during this storm employ-ing our global drift-loss model briefly summarized below. The dynamics of energetic charged particles of species
l under the conditions of time-varying magnetospheric electric field and a dipole model of the Earth’s magnetic field are studied by solving numerically the bounce-aver-aged kinetic equation for the phase space distribution functionQl[Jordanova et al., 1996a, 1997]:
@Ql @t þ
1
R2
o @ @Ro R
2 o dRo dt Ql þ @ @f df dt Ql
þ 1ffiffiffiffi
E p @ @E ffiffiffiffi E p dE dt Ql þ 1
hð Þmo mo @ @mo
hð Þmomo dmo
dt
Ql
¼ @Ql
@t
ce
þ @Ql
@t
cc
þ @Ql
@t
wp
* +
þ @Ql
@t
atm
ð1Þ
wave-particle interactions, and absorption of ring current wave-particles at low altitude in the atmosphere. The distributions of H+, He+, and O+ions are calculated as function of timet, kinetic energyEfrom 15 eV to 400 keV, equatorial pitch angleao
from 0 to 90, wheremo= cos(ao), radial distance in the
equatorial plane Rofrom 2REto 6.5RE, and all magnetic
local times (MLT) with geomagnetic longitude f = 0 at midnight.
[7] The magnetospheric plasma inflow on the nightside is
modeled using energetic flux measurements made by the LANL spacecraft at geosynchronous orbit. This assumes that ionospheric ions are injected into the equatorial mag-netosphere at larger distances. Direct ionospheric injection at lowL< 6.5 shells has minor contribution [e.g.,Chappell et al., 1987] and will be investigated in future studies. During the investigated period, the storm time plasma sheet fluxes were enhanced in comparison with the prestorm values, however, plasma sheet ion density remained below 1 cm3 [Thomsen et al., 1998; Jordanova et al., 1999b]. There was thus no evidence of superdense plasma sheet [Borovsky et al., 1997] during this storm.
[8] Our model has been employed in the past to
investi-gate various aspects of ring current dynamics during several geomagnetic storms [e.g., Jordanova et al., 1997, 2001a;
Kozyra et al., 1997, 1998; Liemohn et al., 1999, 2000;
Farrugia et al., 2003]. One of the most widely used inner magnetospheric electric field models, the semiempirical convection and corotation model of Volland-Stern [Volland, 1973; Stern, 1975; Maynard and Chen, 1975] was first implemented in our ring current model [Jordanova et al., 1996a]. However, the convection potential in this model is parameterized only by the 3-hour planetaryKp index. One point which emerged from the above studies was that although much insight and many successes were achieved using an analytical Volland-Stern type model, significant discrepancies between model results and observations
remained, since while capturing the gross temporal evolu-tion of the large-scale potential drop across the magneto-sphere, Volland-Stern model was not able to reproduce the highly variable and relatively small-scale features of the inner magnetospheric electric field during storm time [e.g.,
Rowland and Wygant, 1998;Boonsiriseth et al., 2001]. To obtain the way the plasma convection responds to rapid changes in the interplanetary magnetic field and solar wind, we develop our ring current model further implementing an electric potential model with increased spatial and temporal resolution based on the AMIE [Richmond, 1992] iono-spheric potentials.
[9] A detailed study of inner magnetospheric convection
[image:3.592.116.478.65.277.2]during the January 1997 storm was performed byBoonsiriseth et al.[2001]. As discussed in the introduction, the AMIE model uses input of data from a variety of sources. During this storm, the data coverage was very good at high latitudes (65to 90). At mid-latitudes, where the data coverage was limited, the potential patterns were mainly generated on the basis of a statistical model [Foster et al., 1986] or extrapo-lated from adjacent data. To improve the limitations of AMIE model, Boonsiriseth et al. [2001] have added an asymmetric ring current driven penetration electric field [Ridley and Liemohn, 2002]. This subauroral ionospheric electric field is caused by the partial ring current closure in the ionosphere during storm time and is often associated with subauroral polarization streams (SAPS) [Foster and Burke, 2002]. The modified AMIE convection electric potentials (MACEP) thus obtained agreed well with in situ measurements of thermal ion velocities from LANL satel-lites and data from the electric field instrument (EFI) on Polar. Figure 1 displays the convection potentials mapped to the equatorial plane during the prestorm, main, and recovery phase of the 10 January storm without (MACEP-) and with (MACEP) the addition of the penetration electric field to AMIE model. It is evident that the effect of this field is most Figure 1. Comparison of MACEP (AMIE convection electric potentials mapped to the equatorial plane
usingTsyganenko[1996] model) in the corotation frame (top) without and (bottom) with the addition of an asymmetric ring current driven penetration electric field. Potentials are shown at selected hours after 00 UT, 10 January 1997.
important during the main phase of the storm and it acts to intensify the duskside and nightside convection electric field, with slight modification of the dawnside convection (for a more detailed analysis of this effect, please review
Boonsiriseth et al.[2001]).
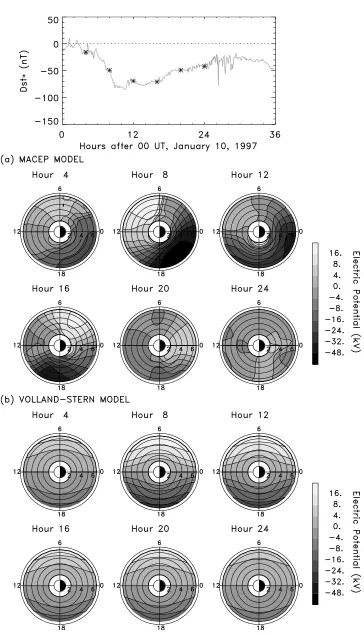
[10] Figure 2 shows the temporal and spatial evolution of
the modified AMIE potentials mapped to the equatorial plane (MACEP) using the Tsyganenko [1996] magnetic field model. The equatorial potentials of theKp-dependent Volland-Stern model with a shielding factorg= 2 and zero offset are plotted for comparison. The Dst index of the January 1997 storm is shown for reference. It is clear that the temporal evolution of the large-scale features is similar in both convection models which predict the largest electric potentials during the main phase of the storm (hour 8). Detailed comparison, however, indicates that MACEP model shows highly variable small-scale features not present in the Stern convection model. The analytical Volland-Stern model is day-night symmetric by definition, while MACEP patterns are quite irregular and skewed on the nightside. The Volland-Stern model implies an increase of the large-scale electric field at allLshells to1 – 2 mV/m, while the MACEP model predicts strong and localized electric field of3 mV/m at lowerL3 shells near dusk; the MACEP electric field decreased to1 mV/m atL= 5. As discussed above a strong penetrating electric field was mea-sured along the duskside outbound Polar pass by the EFI instrument during the storm main phase, in agreement with the MACEP model. Similar intensifications of the storm time electric field on the nightside, in the dusk-midnight quadrant, are predicted by self-consistent electric field calculations using Rice Convection Model [Harel et al., 1981; Wolf, 1983;Fok et al., 2001].
2.2. Loss of Ring Current Ions
[11] All important loss processes are included in our ring
current model. Charge exchange causes ring current ion neutralization due to collision with thermal exospheric hydrogen atoms and such losses are included in our model using the hydrogen geocoronal density of Rairden et al.
[1986]. Coulomb collisions between energetic ring current ions and thermal plasma cause energy transfer from ener-getic particles to the thermal particles and pitch-angle scattering. The resulting changes in the ring current ion distributions are calculated with the Fokker-Planck equa-tion. The plasmaspheric electron densities are obtained with the coupled time-dependent plasmasphere model of
Rasmussen et al. [1993]. The thermal (1 eV) ion composi-tion ratio is assumed to be 77% H+, 20% He+, and 3% O+. Ring current particles with small pitch angles mirror at low altitudes and encounter the dense atmosphere. The removal of particles mirroring below a certain altitude (200 km in our model) is included, introducing a loss term with a timescale of half of a bounce period. Loss of particles drifting through the dayside magnetopause is taken into account by allowing free ion outflow from the dayside boundaries.
[12] Another very complex loss mechanism is scattering
of ions into the atmospheric loss cone (i.e., pitch angle isotropization of the distribution function) due to resonant interactions with plasma waves. To include a self-consistent treatment of wave-particle interactions in our model, we calculate the excitation of electromagnetic ion cyclotron
(EMIC) waves in the equatorial plane as a function of magnetic local time and L shell with storm development. The convective growth rates S are obtained from the hot plasma dispersion relation [e.g., Gomberoff and Neira, 1983;Kozyra et al., 1984]:
S¼gw
Vg¼yðnl;Ek;l;AlÞ ð2Þ
which is coupled and solved simultaneously with the ring current and plasmasphere models as the storm evolves. Here gw is the temporal growth rate, Vg is the group
velocity, and y is a functional of the local hot and cold plasma parameters. The densitynl, parallel energyE,l, and
temperature anisotropy Al of the ring current H+, O+, and
He+ ion species in equation (2) are calculated by taking moments of the distribution functions Ql obtained from
equation (1). EMIC waves grow forgw> 0, otherwise wave
damping occurs; the superposition of the growth or damping rates due to each individual ring current ion species determines whether waves are excited in the multi-ion plasma. We integrate the convective growth rates S
along wave paths which are field-aligned and extend over ±5 magnetic latitude (±10 at the plasmapause) to obtain the wave gainG[Thorne and Horne, 1997; Kozyra et al., 1997]. Since information on the background noise level from which the waves grow is not available, we relate calculated wave gain with measured wave amplitudes on the basis of statistical studies [e.g., Braysy et al., 1998] using
BwðnTÞ ¼1010ðGGmaxÞ=Gmin ð3Þ
Wave-particle interactions are neglected if Bw < 0.1 nT,
while Bw = 10 nT is used for G Gmax when the wave
amplitudes saturate [Jordanova et al., 2001a].
[13] The effect of wave-particle interactions on ring current
ion distributions is treated in the model following quasi-linear theory as a diffusive process. A distinctive feature of our model is the use of diffusion coefficients which consider the presence of heavy ions in the plasma [Jordanova et al., 1996b]. In a multi-ion plasma, EMIC waves do not propagate in the frequency range between the ion gyrofrequency and the cutoff frequency for each ion component but form multiple stop bands. For most of the wave frequencies of interest, particles in a multicomponent plasma resonate at lower parallel energies for a given harmonic value. The scattering at lower energies (approximately tens of keV) enhances the ion precipitation losses from the ring current during geomag-netic storms. We calculate the diffusion coefficients using the wave amplitude model described above (equation (3)) with growth rates obtained from equation (2) and the effects on the distribution function using the Boltzmann equation (1); these equations are solved simultaneously and self-consistency of the model is thus achieved. The average ion flux in the loss cone is calculated for given energy ranges and global images of precipitating fluxes are obtained as the storm develops.
3. Ring Current Morphology
[14] In this study we simulate ring current evolution
Figure 2. Comparison of (a) MACEP and (b) Volland-Stern electric potentials (kV) in the corotation frame at selected hours after 00 UT, 10 January 1997, indicated with stars on theDst* plot. The potentials are plotted as a function of radial distance in the equatorial plane and MLT as used in our model.
electric field models, an analytical Volland-Stern, and a model deduced from the assimilative mapping of iono-spheric electrodynamics (AMIE) to which we have added a penetration electric field [Boonsiriseth et al., 2001]. We map the ionospheric potential to the equatorial plane using
Tsyganenko [1996] magnetic field and the obtained equa-torial convection electric potential (MACEP) is coupled with our ring current model. The corotation electric poten-tialUcor=C/Ro, whereC= 1.44102Re2Vm1is kept
the same in both approaches. Measurements of the energetic particle distributions during 9 – 11 January 1997 are provided by the instruments on Polar spacecraft which followed an orbit in the dawn-dusk meridian during this storm of moderate intensity. The spectra measured by the HYDRA
[Scudder et al., 1995], TIMAS [Shelley et al., 1995], and CAMMICE [Chen et al., 1998] instruments during the prestorm quiet day of 9 January [Jordanova et al., 1999b] are used as initial conditions in our model.
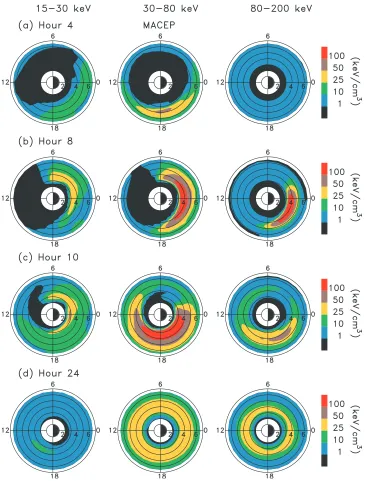
[15] Global images of the energy density calculations for
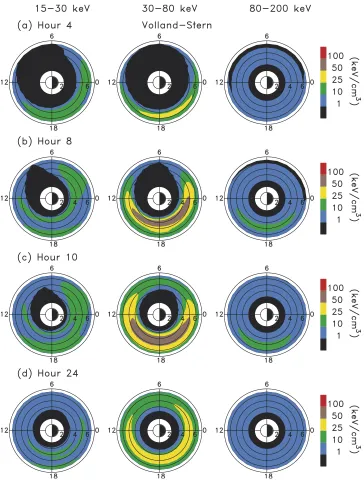
[image:6.592.114.479.61.542.2]the major ring current ion species H+ as function of radial distance in the equatorial plane and MLT are shown in Figures 3 and 4at several representative UT during the storm. Simulations for low (15 – 30 keV), medium (30 – 80 keV), and high (80 – 200 keV) energy ranges using MACEP model (Figure 3) are compared with simulations using Volland-Stern model (Figure 4). Similar morphology is observed with both models during the prestorm quiet conditions at 04 UT, 10 January (Figures 3a and 4a), Figure 3. Dial plots of proton ring current energy density in (keV/cm3) for several energy ranges as a
showing initial ring current injection at highLshells on the duskside. As the main phase of the storm proceeds, ions are transported earthward and energized. The low-energy pop-ulation drifts eastward, while the high-energy poppop-ulation surrounds the Earth westward; a very asymmetric ring current energy distributions develop and significant differ-ences between the two models occur. The MACEP electric field model penetrates earthward during the main phase of the storm and has larger magnitude than the Volland-Stern model. This results in larger ring current injection and stronger asymmetry when MACEP model is used. The freshly injected 30 – 80 keV ring current ions on open drift paths during the main phase penetrate toL3 and the ring current energy density intensifies from premidnight to postmidnight and reaches maximum of 170 keV/cm3 at
L= 3.75 at MLT = 1 (Figure 3b). Note that there is a factor
[image:7.592.115.479.61.542.2]of 10 variation in the H+ intensity with MLT. At the same time, the 30 – 80 keV ring current ions penetrate toL 3.5 in Volland-Stern model and their energy density intensifies from postnoon to premidnight and maximizes to 80 keV/cm3 at L 4.25 at MLT = 17 (Figure 4b). Therefore the peak is rotated 90 westward in Volland-Stern compared to MACEP, reflecting the rotation of the convection patterns. Larger energy gain is observed as well in the higher and lower (Figure 3b) ring current energy components in MACEP compared to Volland-Stern (Figure 4b) model. The deeper penetration of ring current ions and the location of the energy density peak near midnight predicted with MACEP are in better agreement with recent ENA observations during storm time from the IMAGE satellite [e.g.,Mitchell et al., 2001;C:son Brandt et al., 2002] than Volland-Stern predictions. This morphology, Figure 4. Same as Figure 3 using Volland-Stern model.
however, lasts only for few hours. Near minimum Dst
(Figures 3c and 4c) the ring current energy density peak is located in the premidnight quadrant in both models. At this time ring current ions penetrate toL2.5 in MACEP, while they remain atL3 in Volland-Stern near dusk. During the recovery phase of the storm the convection electric field decreases in both models and causes particles to move from open to closed drift paths and to become trapped. Particles that are not trapped escape trough the dayside boundary. The trapped population evolves into a symmetric ring current during the late recovery phase (Figures 3d and 4d).
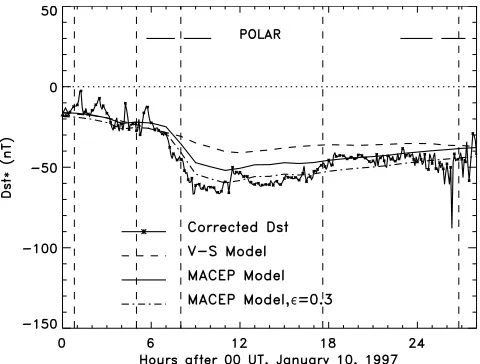
[16] The ring current contribution toDstindex calculated
from our model using the Dessler-Parker-Sckopke relation [Dessler and Parker, 1959; Sckopke, 1966] is compared with measured Dst in Figure 5. The 18-station measured
Dst* values (5 minute averages) for 10 – 11 January are shown by the starred line. In order to isolate the ring current contribution toDstvariations, we correct the measuredDst
values for disturbed and quiet magnetopause currents, as well as currents induced in the solid Earth [Jordanova et al., 1999b]. The five vertical guidelines mark important times related to the January magnetic cloud. From left to right: The arrival of the interplanetary shock at WIND, the cloud front boundary, the Bz minimum inside the cloud, the Bz
negative to positive polarity transition, and the rear bound-ary of the cloud. The calculatedDst* using MACEP (solid line) and Volland-Stern (dashed line) models illustrate the effect of the magnetospheric electric field on ring current formation and decay. The dashed-dotted line is obtained using MACEP and assuming 15% self energy of the ring current magnetic field [Carovillano and Siscoe, 1973]. As discussed above, the MACEP model injects particles deeper in the near-Earth region and causes larger energization, thus predicts40% largerjDstjvalues than Volland-Stern during the main phase. Minimum Dst* is predicted by MACEP about 3 hours after Bz minimum is observed inside the
cloud. Although our model does not resolve the small-scale
Dst* fluctuations, model predictions using MACEP follow the large-scale temporal variations of the observedDst* and reproduce the ring current growth rate during the main phase as well as the decay rate during the recovery phase remarkably well.
4. Comparisons With Polar Observations
[17] During the January 1997 storm Polar satellite, which
orbits in a highly inclined, elliptical trajectory with a period of 17.5 hours and an apogee at 9 RE over the northern
hemisphere and a perigee at 2 RE over the southern
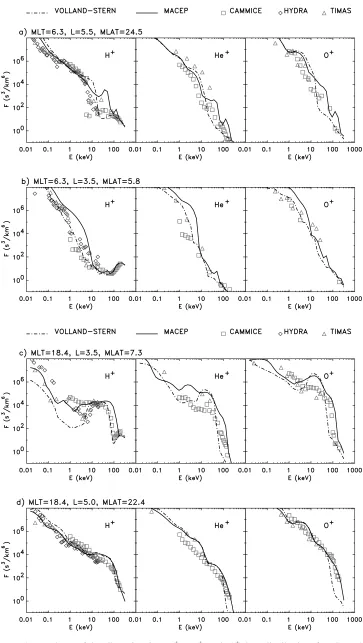
hemisphere, followed an orbit nearly along the dawn-dusk meridian. The time intervals when Polar was in the inner magnetosphere and are of interest to this study are shown with horizontal bars in Figure 5. We use data from the following Polar instruments: The hot plasma experiment HYDRA measuring the three-dimensional ion distribution from 15 eV to 20 keV, the ion mass spectrometer TIMAS covering the energy range from 25 eV to
25 keV, and the ion composition spectrometer CAMMICE from1 to200 keV. We compare distribution functions calculated with MACEP (solid line) or Volland-Stern (dash-dot line) models with HYDRA (diamonds), TIMAS (trian-gles) and CAMMICE (squares) observations during the main phase of the storm in Figure 6. Representative data of the H+, He+, and O+distribution functions from the near-equatorial inbound Polar pass at0600 UT (Figures 6a and 6b) and from the outbound pass at0930 UT (Figures 6c and 6d) when the instruments had good spatial resolution are shown. The data are obtained during time intervals of
12 s (two spin periods) when Polar was at a given L
shell and are averaged over the locally mirroring pitch angle range a = 75 ± 15. Modeled distributions are mapped along magnetic field lines to the position of the spacecraft conserving the first and second adiabatic invariants. Both models reproduce reasonably well the data on the dawnside (Figures 6a and 6b) and at largeL shells on the duskside (Figure 6d). Significant differences between the two models are seen at lower L shells near dusk (Figure 6c). The stronger convection electric field of MACEP model injects particles toL3.5 during the main phase of the storm and energizes them, which results in larger distributions than the ones obtained with Volland-Stern model. In particular, the increase of the low energy H+ distribution is significantly better reproduced when MACEP model is used.
[18] The imaging proton sensor (IPS) of the
comprehen-sive energetic particles and pitch angle distribution (CEP-PAD) experiment [Blake et al., 1995] on Polar obtained measurement of the ion pitch angle distributions during the January storm. Data from three consecutive southern hemi-sphere passes near perigee at local times near dawn (MLT6) and dusk (MLT18) are shown for20 keV (Figure 7) and 65 keV (Figure 8). The data shown are individual count rates obtained as a function of ion pitch angle on each satellite spin and binned here over a range
[image:8.592.51.291.67.249.2]L ± 0.25. During the southern perigee passes the IPS instrument was able to resolve the pitch angle distribution in the vicinity of the atmospheric loss cone, here identified with vertical guidelines. Precipitating ions in the upward looking loss cone have pitch angles betweena160and Figure 5. Calculated ring current contribution toDstindex
Figure 6. Comparison of locally mirroring H+, He+ and O+ ion distribution functions (s3/km6) calculated using Volland-Stern (dashed-dotted line) or MACEP (solid line) convection models with Polar data at variousLshells and magnetic latitudes.
180. The three passes shown occurred during the prestorm (day 9), main (day 10) and recovery (day 11) phase of the storm. There is no significant ion scattering during the prestorm pass; the loss cone is empty both at dawn and dusk (Figures 7 and 8, circles). During the main phase of the storm on 10 January ion pitch angle distributions at dusk become isotropic within the loss cone forL4 (Figures 7 and 8, right, plus symbols), indicating strong pitch angle scattering. During the recovery phase on 11 January par-tially filled loss cones are observed at dusk for L 4.5, indicating moderate diffusion (Figures 7 and 8, right, triangles). In contrast, the loss cones at dawn remain empty during the entire storm period (Figures 7 and 8, left).
[19] The inclusion of pitch angle dependence in our
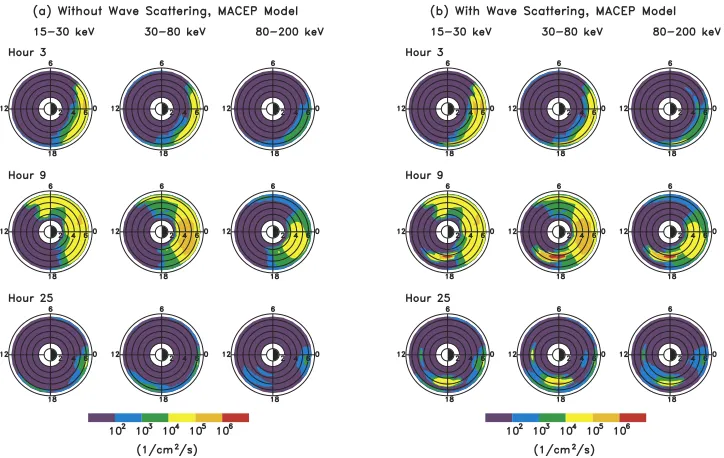
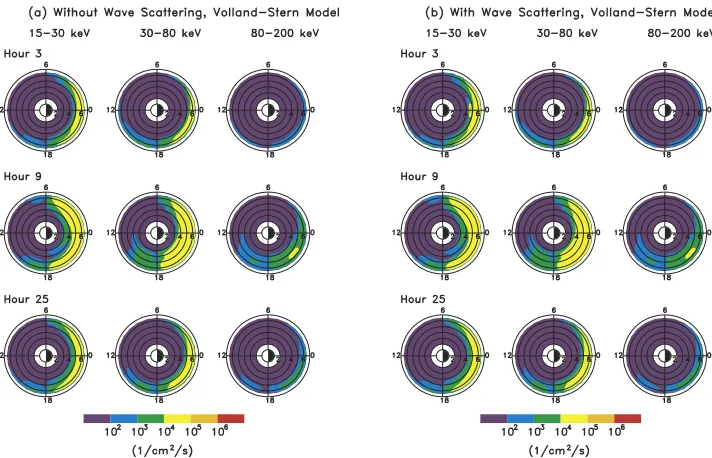
model allows to take into account the process of pitch angle scattering and to calculate global patterns of ion precipita-tion. To this end, we integrate the average flux in the loss cone over given energy range as described byJordanova et al.[1996a, 1997] and plot the total ion precipitating flux as a function ofL and MLT. Global images of proton precip-itation calculated with our model as the storm evolves using either MACEP or Volland-Stern convection model are shown in Figures 9 and 10, respectively. Note that the Polar orbit is approximately along the dawn-dusk axis on these plots. Ion precipitation when wave-particle interactions are not included (due mostly to convection in the assumed magnetospheric electric field [see Jordanova et al., 1996a,
[image:10.592.118.471.69.381.2]1997]) as well as ion precipitation when scattering by He+ band EMIC waves is included are shown, to isolate the effect of wave-particle interactions which drives the distri-bution function toward pitch angle isotropy. A small inten-sification due to plasma wave scattering is seen initially at hour 3 near midnight in both MACEP (Figure 9b, top) and Volland-Stern (Figure 10b, top) simulations. The precipita-tion intensifies as well atL= 6 near dusk in MACEP. EMIC waves are predominantly excited just inside the plasma-sphere and along the plasmapause near Dstminimum and have larger wave gain when MACEP model is used; there is no significant EMIC waves excitation predicted by Volland-Stern model during this period. The precipitating proton flux is thus significantly enhanced by EMIC waves scatter-ing and in good agreement with the strong diffusion seen in IPS data atL= 4 to 5 near dusk during the main phase of the storm (Figure 9b, middle) when the MACEP model is used. There is no significant pitch angle diffusion and no increase in the precipitating flux which remains3 orders of magnitude smaller when Volland-Stern model is used (Figure 10b, middle). During the late recovery phase (hour 25), weak diffusion near dusk due to plasma wave scattering is seen at L 5 only using MACEP model (Figure 9b, bottom). These results indicate that 1) the intense precipitation at 4 L 5 observed by the IPS instrument is well predicted by He+ band EMIC wave scattering using the MACEP convection model, and 2) an Figure 7. Pitch angle distributions of ions from the P1 (19.9 keV midpoint) energy channel of the IPS
Figure 8. Same as Figure 7 for data from the P5 (65.2 keV midpoint) energy channel of the Polar/IPS instrument.
Figure 9. Precipitating proton number flux (1/cm2/s) for low (15 – 30 keV), medium (30 – 80 keV), and high (80 – 200 keV) energy ranges as function of radial distance in the equatorial plane and magnetic local time using MACEP model (a) without and (b) with wave-particle interactions.
[image:11.592.116.478.482.711.2]additional mechanism like current sheet scattering or scat-tering by other plasma waves [e.g.,Jordanova et al., 2001b] has to be considered at larger Lshells. The intense precip-itation predicted by MACEP within regions of overlap between the ring current peak and the plasmapause near dusk is in good agreement with recent storm time IMAGE observations [Burch et al., 2001].
5. Conclusions
[20] We studied ring current dynamics during the
moder-ate geomagnetic storm of 10 January 1997, comparing ring current evolution from two models of inner magnetospheric convection: (a) the Kp-dependent Volland-Stern [Volland, 1973; Stern, 1975] model and (b) a model based on the AMIE ionospheric potentials with the addition of an asym-metric ring current driven penetration electric field at low magnetic latitudes [Boonsiriseth et al., 2001]. We mapped the improved AMIE ionospheric electric potentials to the equatorial plane using theTsyganenko[1996] magnetic field model, and coupled the resulting equatorial potentials (MACEP) with our ring current model. As boundary con-ditions for our kinetic drift-loss model we used energetic particle data from Los Alamos geosynchronous spacecraft. We compared model results with particle data from the HYDRA, TIMAS, CAMMICE, and IPS instruments on Polar.
[21] The major findings from this work are as follows.
[22] 1) While the temporal evolution of the large-scale
features was similar in both convection models, detailed comparison indicated that MACEP model shows highly variable small-scale features not present in the Volland-Stern convection model. The electric field model based on the AMIE ionospheric potentials that we have developed penetrated earthward in the dusk-midnight region during the main phase of the storm and had larger magnitude than the Volland-Stern model, in agreement with satellite electric field measurements. As a result, ring current ions penetrated
aboutL= 0.5 deeper near Earth and their energy density was about twice larger using MACEP, thus reproducing the rapidity of the main phase growth and its strength better. The jDst*j index was enhanced by 40% using MACEP and reproduced significantly better the observations.
[23] 2) Strong ring current asymmetry during storm main
phase and early recovery phase was obtained with both models. Ring current simulations using the MACEP electric field model demonstrated a variable location of the energy density peak during storm main phase on the nightside extending from premidnight to postmidnight, contrary to the classical picture of an energy density peak near dusk predicted by the simplified Volland-Stern model and in better agreement with recent ENA observations from IM-AGE. Ring current energy density was located near dusk in both models during the recovery phase and evolved into a symmetric distribution during late recovery.
[24] 3) Both Volland-Stern and MACEP models
repro-duced very well the features in HYDRA, TIMAS, and CAMMICE data for all three ions near dawn at 06 UT, 10 January. They also reproduced the main trends of ring current development at largeLshells near dusk. However, better agreement with Polar observations of locally mirror-ing ion distributions was achieved at low L shells on the duskside at 0930 UT on 10 January when the modified AMIE model was used, reproducing the storm time rise of low-energy protons due to increased convection.
[25] 4) In this paper we compared for the first time
[image:12.592.118.474.63.292.2]with recent global IMAGE observations of intense pre-cipitation during storm time where the ring current and plasmasphere overlap. Some additional scattering mecha-nisms are needed to generate the intense ion precipitation at larger L > 5 shells during high geomagnetic activity seen by Polar/IPS. These will be investigated in future extensions of this work.
[26] In conclusion, this numerical simulation study
demonstrated the effect of the storm time convection electric field on ring current particles energization, trap-ping, and loss. An inner magnetospheric electric field model with increased spatial and temporal specification during the main phase, MACEP, reproduced better the ring current evolution during the January 1997 storm. In particular, the ring current morphology, i.e., location of energy peak, Dst* values, and magnitude of trapped and precipitating fluxes showed better agreement with obser-vations when this higher-resolution model was used.
[27] Acknowledgments. We would like to thank the following indi-viduals and teams for providing data used in this study. The solar wind magnetic field and particle density data were provided by the MFI and SWE teams of the Wind satellite. Energetic particle data were provided by the TIMAS, CAMMICE, and HYDRA teams of the Polar satellite. The data from the MPA and SOPA instruments on LANL spacecraft were provided by M. Thomsen and R. Belian, and AMIE data were provided by Gang Lu. This work is supported in part by NASA under grants NAG 5-13512 and NAG 5-12006 (including its subcontract through UCLA Subaward Number 0965GCB890), and NSF under grants ATM-0101095 and ATM-0101195. [28] Arthur Richmond thanks Donald Mitchell and another reviewer for their assistance in evaluating this paper.
References
Blake, J. B., et al., CEPPAD: Comprehensive energetic particle and pitch angle distribution experiment on Polar,Space Sci. Rev.,71, 531, 1995. Boonsiriseth, A., R. M. Thorne, G. Lu, V. K. Jordanova, M. F. Thomsen,
D. M. Ober, and A. J. Ridley, A semiempirical equatorial mapping of AMIE convection electric potentials (MACEP) for the January 10, 1997, magnetic storm,J. Geophys. Res.,106, 12,903, 2001.
Borovsky, J. E., M. F. Thomsen, and D. J. McComas, The superdense plasma sheet: Plasmaspheric origin, solar-wind origin, or ionospheric origin?,J. Geophys. Res.,102, 22,089, 1997.
Braysy, T., K. Mursula, and G. Marklund, Ion cyclotron waves during a great magnetic storm observed by Freja double-probe electric field instrument,J. Geophys. Res.,103, 4145, 1998.
Burch, J. L., IMAGE mission overview,Space Sci. Rev.,91, 1 – 14, 2000. Burch, J. L., D. G. Mitchell, B. R. Sandel, P. C. Brandt, and M. Wuest, Global dynamics of the plasmasphere and ring current during magnetic storms,Geophys. Res. Lett.,28, 1159, 2001.
Burlaga, L. F., et al., A magnetic cloud containing prominence material: January 1997,J. Geophys. Res.,103, 277, 1998.
C:son Brandt, P., Y. Ebihara, S. Barabash, and E. C. Roelof, Energetic neutral atom images of a narrow flow channel from the plasma sheet: Astrid-1 observations,J. Geophys. Res.,107(A10), 1273, doi:10.1029/ 2001JA000230, 2002.
Carovillano, R. L., and G. L. Siscoe, Energy and momentum theorems in magnetospheric processes,Rev. Geophys.,11, 289, 1973.
Chappell, C. R., T. E. Moore, and J. H. Waite Jr., The ionosphere as a fully adequate source of plasma for the Earth’s magnetosphere,J. Geophys. Res.,92, 5896, 1987.
Chen, J., et al., Cusp energetic particle events: Implications for a major accel-eration region of the magnetosphere,J. Geophys. Res.,103, 69, 1998. Chen, M. W., L. R. Lyons, and M. Schulz, Simulations of phase space
distributions of storm time proton ring current,J. Geophys. Res.,99, 5745, 1994.
Chen, M. W., M. Schulz, and L. R. Lyons, Modeling of ring current for-mation and decay: A review, inMagnetic Storms,Geophys. Monogr. Ser., vol. 98, edited by B. T. Tsurutani et al., pp. 173 – 186, AGU, Washington, D. C., 1997.
Dessler, A. J., and E. N. Parker, Hydromagnetic theory of geomagnetic storms,J. Geophys. Res.,64, 2239, 1959.
Farrugia, C. J., et al., Geoeffectiveness of three Wind magnetic clouds: A comparative study,J. Geophys. Res.,103, 17,261, 1998.
Farrugia, C. J., et al., Large-scale geomagnetic effects of May 4, 1998,Adv. Space Res.,31(4), 1111, 2003.
Fok, M.-C., T. E. Moore, and M. E. Greenspan, Ring current development during storm main phase,J. Geophys. Res.,101, 15,311, 1996. Fok, M.-C., R. A. Wolf, R. W. Spiro, and T. E. Moore, Comprehensive
computational model of the Earth’s ring current,J. Geophys. Res.,106, 8417, 2001.
Foster, J. C., and W. J. Burke, SAPS: A new categorization for sub-auroral electric fields,Eos Trans. AGU,83(36), 393, 2002.
Foster, J. C., J. M. Holt, R. G. Musgrove, and D. S. Evans, Ionospheric convection associated with discrete levels of particle precipitation, Geo-phys. Res. Lett.,13, 656, 1986.
Gomberoff, L., and R. Neira, Convective growth rate of ion cyclotron waves in a H+-He+ and H+-He+-O+ plasma, J. Geophys. Res.,88, 2170, 1983.
Harel, M., R. A. Wolf, P. H. Reiff, R. W. Spiro, W. J. Burke, F. J. Rich, and M. Smiddy, Quantitative simulation of a magnetic substorm: 1. Model logic and overview,J. Geophys. Res.,86, 2217, 1981.
Jordanova, V. K., L. M. Kistler, J. U. Kozyra, G. V. Khazanov, and A. F. Nagy, Collisional losses of ring current ions,J. Geophys. Res.,101, 111, 1996a.
Jordanova, V. K., J. U. Kozyra, and A. F. Nagy, Effects of heavy ions on the quasi-linear diffusion coefficients from resonant interactions with electro-magnetic ion cyclotron waves,J. Geophys. Res.,101, 19,771, 1996b. Jordanova, V. K., J. U. Kozyra, A. F. Nagy, and G. V. Khazanov, Kinetic
model of the ring current-atmosphere interactions,J. Geophys. Res.,102, 14,279, 1997.
Jordanova, V. K., C. J. Farrugia, L. Janoo, J. M. Quinn, R. B. Torbert, K. W. Ogilvie, R. P. Lepping, J. T. Steinberg, D. J. McComas, and R. D. Belian, October 1995 magnetic cloud and accompanying storm activity: Ring current evolution,J. Geophys. Res.,103, 79, 1998.
Jordanova, V. K., C. J. Farrugia, J. M. Quinn, R. B. Torbert, J. E. Borovsky, R. B. Sheldon, and W. K. Peterson, Simulation of off-equatorial ring current ion spectra measured by Polar for a moderate storm at solar minimum,J. Geophys. Res.,104, 429, 1999a.
Jordanova, V. K., R. B. Torbert, R. M. Thorne, H. L. Collin, J. L. Roeder, and J. C. Foster, Ring current activity during the earlyBz< 0 phase of the January 1997 magnetic cloud,J. Geophys. Res.,104, 24,895, 1999b. Jordanova, V. K., C. J. Farrugia, R. M. Thorne, G. V. Khazanov, G. D.
Reeves, and M. F. Thomsen, Modeling ring current proton precipitation by electromagnetic ion cyclotron waves during the May 14 – 16, 1997, storm,J. Geophys. Res.,106, 7, 2001a.
Jordanova, V. K., R. M. Thorne, C. J. Farrugia, Y. Dotan, J. F. Fennell, M. F. Thomsen, G. D. Reeves, and D. J. McComas, Ring current dynamics during the 13 – 18 July 2000 storm period,Sol. Phys.,204, 361, 2001b. Kistler, L. M., et al., Testing electric field models using ring current ion energy spectra from the Equator-S ion composition (ESIC) instrument, Ann. Geophys.,17, 1611, 1999.
Kozyra, J. U., T. E. Cravens, A. F. Nagy, E. G. Fontheim, and R. S. B. Ong, Effects of energetic ions on electromagnetic ion cyclotron wave genera-tion in the plasmapause region,J. Geophys. Res.,89, 2217, 1984. Kozyra, J. U., V. K. Jordanova, R. B. Horne, and R. M. Thorne, Modeling
of the contribution of electromagnetic ion cyclotron (EMIC) waves to stormtime ring current erosion, inMagnetic Storms,Geophys. Monogr. Ser., vol. 98, edited by B. T. Tsurutani et al., pp. 187 – 202, AGU, Washington, D. C., 1997.
Kozyra, J. U., V. K. Jordanova, J. E. Borovsky, M. F. Thomsen, D. J. Knipp, D. S. Evans, D. J. McComas, and T. E. Cayton, Effects of a high-density plasma sheet on ring current development during the November 2 – 6, 1993 magnetic storm,J. Geophys. Res.,103, 26,285, 1998.
Liemohn, M. W., J. U. Kozyra, V. K. Jordanova, G. V. Khazanov, M. F. Thomsen, and T. E. Cayton, Analysis of early phase ring current recovery mechanisms during geomagnetic storms,Geophys. Res. Lett.,26, 2845, 1999.
Liemohn, M. W., J. U. Kozyra, P. G. Richards, G. V. Khazanov, M. J. Buonsanto, and V. K. Jordanova, Ring current heating of the thermal electrons at solar maximum,J. Geophys. Res.,105, 27,767, 2000. Lu, G., et al., Global energy deposition during the January 1997 magnetic
cloud event,J. Geophys. Res.,103, 11,685, 1998.
Maynard, N. C., and A. J. Chen, Isolated cold plasma regions: Observations and their relation to possible production mechanisms,J. Geophys. Res., 80, 1009, 1975.
Mitchell, D. G., K. C. Hsieh, C. C. Curtis, D. C. Hamilton, H. D. Voss, E. C. Roelof, and P. C. Brandt, Imaging two geomagnetic storms in energetic neutral atoms,Geophys. Res. Lett.,28, 1151, 2001.
Moore, T. E., et al., Low energy neutral atoms in the magnetosphere, Geophys. Res. Lett.,28, 1143, 2001.
Pollock, C. J., et al., First medium energy neutral atom (MENA) images of Earth’s magnetosphere during substorms and storm-time,Geophys. Res. Lett.,28, 1147, 2001.
Rairden, R. L., L. A. Frank, and J. D. Craven, Geocoronal imaging with Dynamics Explorer,J. Geophys. Res.,91, 13,613, 1986.
Rasmussen, C. E., S. M. Guiter, and S. G. Thomas, Two-dimensional model of the plasmasphere: Refilling time constants,Planet. Space Sci.,41, 35, 1993.
Richmond, A. D., Assimilative mapping of ionospheric electrodynamics, Adv. Space Res.,12, 669, 1992.
Ridley, A. J., and M. W. Liemohn, A model-derived storm time asymmetric ring current driven electric field description,J. Geophys. Res.,107(A8), 1151, doi:10.1029/2001JA000051, 2002.
Rowland, D. E., and J. R. Wygant, Dependence of the large-scale, inner magnetospheric electric field on geomagnetic activity,J. Geophys. Res., 103, 14,959, 1998.
Sckopke, N., A general relation between the energy of trapped particles and the disturbance field over the Earth,J. Geophys. Res.,71, 3125, 1966. Scudder, J., et al., HYDRA—A 3-dimensional electron and ion hot plasma
instrument for the POLAR spacecraft of the GGS mission,Space Sci. Rev.,71, 459, 1995.
Shelley, E. G., et al., The toroidal imaging mass-angle spectrograph (TIMAS) for the Polar mission,Space Sci. Rev.,71, 497, 1995. Stern, D. P., The motion of a proton in the equatorial magnetosphere,
J. Geophys. Res.,80, 595, 1975.
Thomsen, M. F., J. E. Borovsky, D. J. McComas, R. C. Elphic, and S. Maurice, The magnetospheric response to the CME passage of January 10 – 11, 1997, as seen at geosynchronous orbit,Geophys. Res. Lett.,25, 2545, 1998.
Thorne, R. M., and R. B. Horne, Modulation of electromagnetic ion cyclo-tron instability due to interaction with ring current O+during magnetic storms,J. Geophys. Res.,102, 14,155, 1997.
Tsyganenko, N. A., Modeling the global magnetic field of the large-scale Birkeland current systems,J. Geophys. Res.,101, 27,187, 1996. Volland, H., A semiempirical model of large-scale magnetospheric electric
fields,J. Geophys. Res.,78, 171, 1973.
Wolf, R. A., The quasi-static (slow-flow) region of the magnetosphere, in Solar-Terrestrial Physics, edited by R. L. Carovillano and J. M. Forbes, pp. 303 – 368, D. Reidel, Norwell, Mass., 1983.
Wolf, R. A., J. W. Freeman Jr., B. A. Hausman, R. W. Spiro, R. V. Hilmer, and R. L. Lambour, Modeling convection effects in magnetic storms, in Magnetic Storms,Geophys. Monogr. Ser., vol. 98, edited by B. T. Tsurutani et al., pp. 161 – 172, AGU, Washington, D. C., 1997. Wygant, J., D. Rowland, H. J. Singer, M. Temerin, F. Mozer, and M. K.
Hudson, Experimental evidence on the role of the large spatial scale electric field in creating the ring current,J. Geophys. Res,103, 29,527, 1998.
![Figure 1.Comparison of MACEP (AMIE convection electric potentials mapped to the equatorial planeusing Tsyganenko [1996] model) in the corotation frame (top) without and (bottom) with the addition ofan asymmetric ring current driven penetration electric fie](https://thumb-us.123doks.com/thumbv2/123dok_us/7993717.760153/3.592.116.478.65.277/comparison-potentials-equatorial-planeusing-tsyganenko-corotation-asymmetric-penetration.webp)