Removal of High Density Salt and Pepper Noise through
Hybrid of Negative Selection Algorithm and Median Filter
Lovepreet Kaur
Computer Science and Engineering Department Chandigarh University, Gharuan (Mohali)
Spardha
Computer Science and Engineering Department Chandigarh University, Gharuan (Mohali)
ABSTRACT
Noise in images has become one of the significant concerns in digital image processing. Many digital image based techniques produce inaccurate results when noise is presented in the digital images. So many researchers have proposed new and modified techniques so far to reduce or remove noise from images. Different kind of enhancement in the filters has been proposed so far. But most of filters put artefacts while doing their work. Many filters fail when noise density in the images is very high. Some filters results poor for edges. This paper has proposed a new improved NSA based switching median filter which has the capability to decrease the high density of the noise from images and also outperforms over others when input image is noise free. The proposed method has also ability to preserves the edges by using the gradient based smoothing. The proposed technique has been designed and implemented in MATLAB tool using image processing toolbox. Different kind of the digital images has been taken for experimental purpose. Comparative analysis has shown that the proposed algorithm is quite effective over the available techniques.
Keywords
Median filter, Salt and pepper noise, Negative Selection Algorithm
1.
INTROUCTION
The main reasons behind the occurrence of noise in images are during the transmission process and improper way of image acquisition. The other factors can include ecological conditions. . A lot of filtering methods are proposed to eliminate salt and pepper noise.
One of the most successful methods is median filter [1]. The median filter is a nonlinear signal processing technology based on statistics. The noisy value of the digital image or the sequence is replaced by the median value of the neighbourhood (mask). The pixels of the mask are ranked in the order of their gray levels, and the median value of the group is stored to replace the noisy value. This filter has generated best results for low noise density but it is not this much efficient when high density of noise is present.
In previous research work of removal of noise seed placement, the technique followed was to find median of the selected window. After that particular noisy pixel is replaced with the median value of selected window.But in this scenario
problem creates when the median value is also noisy. So a modified median filter is used [3], [4].The high density of noise is also ignored in the existing techniques, so a high density noise removal technique is required to enhance the results further.
To overcome the above drawback, Decision Based Algorithm (DBA) is proposed [5]. In this, image is de noised by using a
At high noise density the median value will be 0 or 255 which is noisy. In such case, the neighbouring pixel is considered for replacement. These repetitions of replacement with neighbouring pixel produce streaking effect [6]. In order to avoid this drawback, Sorted Switching Median Filter (SSMF) is proposed [7]. At high noise densities, if the selected window contains all 0’s or 255’s or both then, median value is difficult to obtain. This clearly means that the algorithm does not give better results at very high noise density that is at 80% to 90%. The proposed algorithm removes this drawback at high noise density and gives better Peak Signal-to-Noise Ratio (PSNR), Mean Square Error(MSE), Root Mean Square Error(RMSE), Mean Difference(MD),Bit Error Rate(BER) values than the existing algorithm.
The rest of the paper is structured as follows. A brief introduction of median filter is given in Section II. Section III illustrates about the proposed algorithm and different cases involved in proposed algorithm. In Section IV, the proposed algorithm is described with an example Section V represents the simulation results. End of all, conclusions are given in Section VI.
2.
MEDIAN FILTER
Salt and pepper noise is one typical kind of image noises, resulting from image sensors, channel transmissions and decoding processing and so on. It significantly reduces the image quality and its filtering performance has a direct impact on the subsequent image processing. A lot of filtering methods are proposed to eliminate salt and pepper noise.
One of the most successful methods is median filter [8]. The median filter is a nonlinear signal processing technology based on statistics. The noisy value of the digital image or the sequence is replaced by the median value of the neighbourhood (mask). The pixels of the mask are ranked in the order of their gray levels, and the median value of the group is stored to replace the noisy value. The median filtering [9] output is: As shown in equation 1
g(x, y) = med {f (x - i, y - j), i, j ε W}... (1)
where f (x, y),g(x, y) are the original image and the output image respectively, W is the two-dimensional mask: the mask size is n * n(where n is commonly odd) such as 3* 3, 5 * 5, and etc.; the mask shape may be linear, square, circular, cross, and etc. In median filtering, the neighbouring pixels are ranked according to brightness i.e. intensity and the median value becomes the new value for the central pixel. Median filters can work efficiently in rejecting certain types of noise like shot or impulse noise.
3.
PROPOSED ALGORITHM
21 another case, it will be a noisy pixel and goes for the further
processing.
Step 1: Select 2 dimensional window of size 3*3. Suppose that the pixel under processing is p.
Step 2: If p lies between values 0 and 255 then p is an uncorrupted pixel and it is left unchanged.
Step 3: If value of p is equal to 0 or 255 then p is a corrupted pixel then there is possibility of two cases Case i) and ii).
Case i): If all the elements are found as as 0’s and 255’s. Then replace it with the median of the element of window.
Case ii): If all elements as 0’s and 255’s. Then eliminate255’s and 0’s and find the median value of the remaining elements. Replace with the median value.(calculated with NSA)
Step 4: Repeat steps 1 to 3 until all the pixels in the entire image are processed for noise removal.
[image:2.595.308.536.175.571.2]4.
ILLUSTRATION
OF
PROPOSED
ALGORITHM
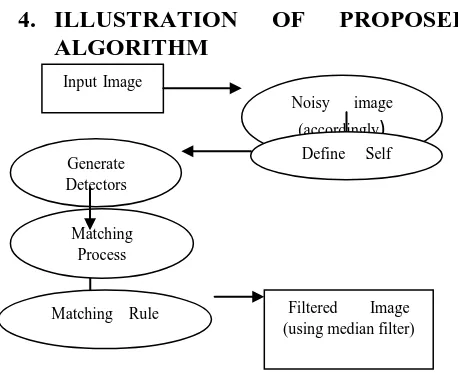
Figure 1: DFD of proposed work
(1)
Define Self:
AIS (Artificial Immune System) address a similar problem, in which we define a set S of equal-length strings to be “protected” (self). More commonly, single strings are segmented into set of strings with equal length. The remaining other strings that are not included in the original set S are called as nonself N. These two sets form a universe U (i.e. S ∪
N=U, S ∩ N=). The string here could be a string of bits, a string of assembly instructions, a string of ASCII characters or a pattern of activities.
(2)
Generating Detectors:AIS (Artificial Immune System) generate a set of R detectors that are circulating around a distributed environment.
(3) Matching Process:
In order to keep a sufficiently small set of detectors and make sure a relatively constant size of it with the increase of “protected” string, exact non-matching cannot be adopted.
(4) Matching Rule:
Two equal-length strings can only match if they are equal in r contiguous positions.
5.
SIMULATION RESULTS
5.1 MSE (Mean Square Error) Evaluation
Table 1 has indicated the quantized examination of the mean square error. As mean square blunder need to be lessened, consequently the proposed algorithm is indicating the better outcomes about over the accessible systems as mean square error is less in every case. Figure 2 is graphical representation of Table 1Table 1: Mean Square Error Evaluation
MSE EVALUTION FOR DIFFERENT FILTERS AT NOISE DENSITY 0.8
IMAGE NOISY
IMAGE
MEDIAN FILTER
SSMF NSA
Image1 15523 10480 695 521
Image2 17543 11867 445 324
Image3 17702 11844 479 339
Image4 16088 10587 779 665
Image5 15753 10479 1277 1093
Image6 17619 11959 689 440
Image7 16803 11348 850 723
Figure 2: Graphical representation of Table 1
5.2 PSNR (Peak Signal to Noise Ratio)
Evaluation
In Table 2 the Value of the PSNR is calculated for all the input images. More is the value of the PSNR, much better is the result. Hence proposed algorithm is giving preferable outcomes in comparison with the existing strategies Figure 3 is graphical representation of Table 2
Noisy image (accordingly
)
Input ImageDefine Self Generate
Detectors
Matching Process
Matching Rule Filtered Image
[image:2.595.45.274.283.470.2]Table 2: Peak Signal to Noise Ratio Evaluation
PSNR EVALUTION FOR DIFFERENT FILTERS AT NOISE DENSITY 0.8
IMAGE NOISY IMAGE
MEDIAN FILTER
SSMF NSA
Image1 6.2210 7.9272 19.7110 19.8636
Image2 5.6898 7.3874 21.6472 22.4021
Image3 5.6506 7.3958 21.3274 21.7062
Image4 6.0658 7.8831 17.5 19.5
Image5 6.1572 7.9276 17.0689 17.3644
Image6 5.6710 7.3539 19.7486 20.8069
[image:3.595.48.286.147.427.2]Image7 5.8769 7.5816 18.8366 18.9768
Figure 3: Graphical representation of Table 2
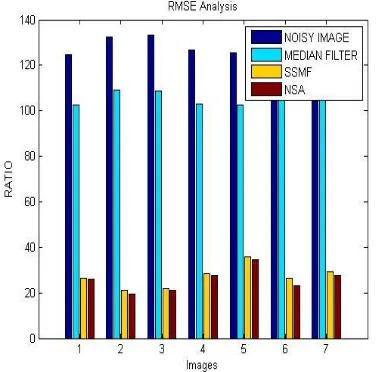
5.3 RMSE (Root Mean Square Error)
Evaluation
RMSE (root mean square error) need to be minimized; so this is the main objective. Table 3 has clearly illustrated that the RMSE is minimum in case of proposed algorithm hence proposed algorithm is giving preferable outcomes in comparison with the existing strategies. Figure 4 is graphical representation of Table 3
Table 3: Root Mean Square Error Evaluation
RMSE EVALUTION FOR DIFFERENT FILTERS AT NOISE DENSITY 0.8
IMAGE NOISY
IMAGE
MEDIAN FILTER
SSMF NSA
Image1 124.5913 102.3719 26.3629 25.9037
Image2 132.4500 108.9358 21.0950 19.3391
Image3 133.0489 108.8301 21.8861 20.9523
Image4 126.8385 102.8931 28.2666 27.6586
Image5 125.5110 102.3670 35.7351 34.5398
Image6 132.7366 109.3572 26.2488 23.2379
Image7 129.6264 106.5270 29.1548 27.6880
Figure 4: Graphical representation of Table 3
5.4 BER (Bit Error Rate) Evaluation
[image:3.595.310.532.404.731.2]The BER (bit error rate) needs to be minimized; so this is the main objective. Table 4 has clearly illustrated that the BER is minimum in case of proposed algorithm hence proposed algorithm is giving preferable comes in comparison with the existing strategies. Figure 5 is graphical representation of Table 4
Table 4: Bit Error Rate Evaluation
BER EVALUTION FOR DIFFERENT FILTERS AT NOISE DENSITY 0.8
IMAGE NOISY IMAGE
MEDIAN FILTER
SSMF NSA
Image1 0.1607 0.1261 0.0507 0.0403
Image2 0.1758 0.1354 0.0462 0.0346
Image3 0.1770 0.1352 0.0469 0.0361
Image4 0.1649 0.1269 0.0523 0.0418
Image5 0.1624 0.1261 0.0286 0.0576
Image6 0.1763 0.1360 0.0506 0.0481
[image:3.595.50.285.593.743.2]Image7 0.1702 0.1319 0.0531 0.0427
23
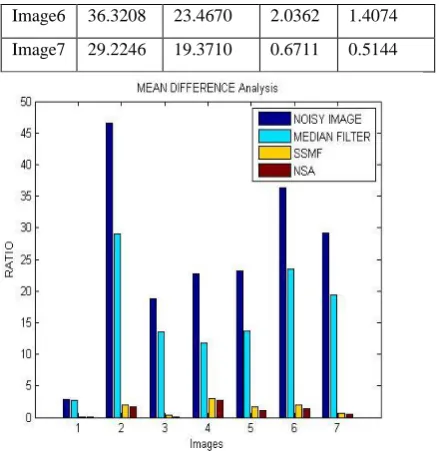
5.5
MD (Mean Difference) Evaluation
MD (mean difference) needs to be minimized; so this is the main objective. Table 5 has clearly illustrated that the MD is minimum in case of proposed algorithm hence it has given better results than the existing techniques. Figure 6 is graphical representation of table 4.
Table 5: Mean Difference Evaluation
MEAN DIFF EVALUTION FOR DIFFERENT FILTERS AT NOISE DENSITY 0.8
IMAGE NOISY
IMAGE
MEDIAN FILTER
SSMF NSA
Image1 2.7962 2.7730 0.1129 0.0091
Image2 46.6043 29.0833 1.9301 1.6451
Image3 18.7140 13.4709 0.2926 0.0385
Image4 22.6774 11.8253 2.9340 2.6349
Image5 23.1960 13.6906 1.7390 1.0468
Image6 36.3208 23.4670 2.0362 1.4074
[image:4.595.329.549.70.296.2]Image7 29.2246 19.3710 0.6711 0.5144
Figure 6: Graphical representation of Table 5
De noising performances are quantitatively measured by the Peak Signal-to-Noise Ratio (PSNR), Mean Square Error
(MSE), Root Mean Square Error (RMSE), Mean Difference
(MD), Bit Error Rate (BER)
MSE = 1
𝑚𝑛 (A
n
j=1
− B)
m
i=1 𝑚
𝑖=1
PSNR=10log10*(255*255)/MSE
RMSE = √MSE
BER = 1 PSNR MD = [ X − Y ]
The PSNR and other values of the proposed algorithm are compared against the existing algorithms at high noise density and are shown in Table 1 to Table 5.
From the Tables 1 to 5, it is observed that the performance of the proposed algorithm is better than the existing algorithms at both low and high noise densities
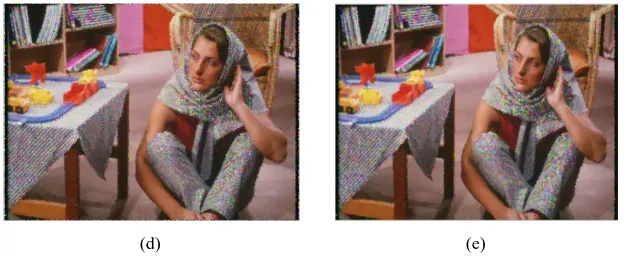
(a) (b) (c)
Figure 7 (a,b,c,d,e)
[image:4.595.61.526.388.678.2]Figure 7 image a is the input image, image b is the noisy image corrupted with 80% of noise, image c is the filtered image through median filter, image d is the SSMF based filtered image and image d is the filtered image with proposed algorithm.
6.
CONCLUSION
Image filtering is the process of reduction of the noise from a noisy image with an aim to produce a filtered image that is closed to the original image i.e. the ground truth image. Noise is an eminence deprivation influence that is restrained as unsolicited/unrelated material existing in the digital image. Several median based filters have been projected for the filtering of the noisy images polluted by salt and pepper noise. As the time passes new algorithms are generated to cover the drawbacks of the previous one. The switching median filter based algorithm eliminates impulse noise even in case of high density noise and produce better results over available filters. The main drawback of this algorithm or filter is that does not preserve edges or boundaries of the digital images. To overcome this disadvantage a new improved NSA based switching median filter has been proposed. The algorithm which has the capability to decrease the high density of the noise from images and also works over others when input image is noise free. The proposed method is efficient in preserving the edges. NSA is optimisation based phenomenon which is used to find the better replacement value for the noisy pixel.
7.
REFERENCES
[1] J. Astola and P. Kuosmaneen, Fundamentals of Nonlinear Digital Filtering. Boca Raton, FL: CRC, 1997.
[2] H. Hwang and R. A. Hadded, “Adaptive median filter: New algorithms and results,” IEEE Trans. Image Process., vol. 4, no. 4, pp. 499–502, Apr. 1995.
[3] S. Zhang and M. A. Karim, “A new impulse detector for switching median filters,” IEEE Signal Process. Lett., vol. 9, no. 11, pp. 360–363, Nov. 2002.
[4] P. E. Ng and K. K. Ma, “A switching median filter with boundary discriminative noise detection for extremely corrupted images,” IEEE Trans. Image Process., vol. 15, no. 6, pp. 1506–1516, Jun. 2006.
[5] K. S. Srinivasan and D. Ebenezer, “A new fast and efficient decision based algorithm for removal of high density impulse noise,” IEEE Signal Process. Lett., vol. 14, no. 3, pp. 189–192, Mar. 2007.
[6] V. Jayaraj and D. Ebenezer, “A new switching-based median filtering scheme and algorithm for removal of high-density salt and pepper noise in image,” EURASIP J. Adv. Signal Process., 2010.
[7] Shi-Jinn Horng , Ling-Yuan Hsu,” Using Sorted Switching Median Filter to remove high-density impulse noises,”ELSEVIER ,vol . 2,no. 4,pp. 956-967, june2013
[8] K. Aiswarya, V. Jayaraj, and D. Ebenezer, “A new and efficient algorithm for the removal of high density salt and pepper noise in images and videos,” in Second Int. Conf. Computer Modelling and Simulation(IEEE), pp. 409–413,2010.
[9] Gnanambal Ilangoand R. Marudhachalam, “New hybrid filtering techniques for removal of Gaussian noise from medical images,” ARPN Journal of Engineering and Applied Sciences, vol. 6, no. 2, pp. 8-11, 2011.
[10] Pei-Eng Ng and Kai-Kuang Ma, “A switching median filter with boundary discriminative noise detection for extremely corrupted images,” IEEE Transactions on Image Processing, vol. 15, no. 6, pp.1506-1516, 2006.