http://dx.doi.org/10.4236/jwarp.2013.512A001
Calibration of Hargreaves-Samani Equation for
Estimating Reference Evapotranspiration in Sub-Humid
Region of Brazil
José Romualdo de Sousa Lima1, Antonio Celso Dantas Antonino2, Eduardo Soares de Souza3, Claude Hammecker4, Suzana Maria Gico Lima Montenegro2,
Carlos Alberto Brayner de Oliveira Lira2
1Academic Unity of Garanhuns, Federal Rural University of Pernambuco, Garanhuns, Brazil 2Nuclear Energy Department, Federal University of Pernambuco, Recife, Brazil
3Academic Unity of Serra Talhada, Federal Rural University of Pernambuco, Serra Talhada, Brazil 4Land Development Department, Office of Science for Land Development, IRD, Montpellier, France
Email: romualdo@uag.ufrpe.br, acda@ufpe.br, suzanam@ufpe.br, cabol@ufpe.br, eduardosouza@uast.ufrpe.br, claude.hammecker@ird.fr
Received October 24, 2013; revised November 25, 2013; accepted December 14, 2013
Copyright © 2013 José Romualdo de Sousa Lima et al. This is an open access article distributed under the Creative Commons Attri- bution License, which permits unrestricted use, distribution, and reproduction in any medium, provided the original work is properly cited. In accordance of the Creative Commons Attribution License all Copyrights © 2013 are reserved for SCIRP and the owner of the intellectual property José Romualdo de Sousa Lima et al. All Copyright © 2013 are guarded by law and by SCIRP as a guardian.
ABSTRACT
Reference evapotranspiration (ETo) is an important parameter used in numerous applications, such as climatological and hydrological studies, as well as for water resources planning and management. There are several methods to esti-mate ETo, being that the FAO Penman-Monteith (EToPM) method is considered standard. This method needs many pa- rameters (solar radiation, air temperature, humidity and wind speed), however there are still many uncovered areas, suggesting the need for methods of calculating evapotranspiration based on few meteorological elements, such as air temperature. Therefore, this study aimed to determine the ETo by Hargreaves-Samani method in the experimental water- shed of the “Riacho do Papagaio” farm, in county of São João, in north-eastern Brazil, using data of 2011 and 2012. Reference evapotranspiration estimated by non-calibrated Hargreaves-Samani method (EToHS) was overestimated in all months (RMSE = 1.43 mm·d−1), mainly in months of lower evaporative demand (from May to July). Because of
these tendencies, this method cannot be used in its original form to estimate ET for this region; therefore, a calibration of radiation adjustment coefficient (kRs) was performed. The calibrated Hargreaves-Samani method (EToHSc) had better performance (RMSE = 0.52 mm·d−1), being suitable for predicting ETo in this region.
Keywords: Reference Evapotranspiration; Penman-Monteith; Hargreaves-Samani; Air Temperature
1. Introduction
Evapotranspiration is one of the major components in the hydrological cycle, and its reliable estimation is essential to water resources planning and management. Further- more, it is necessary to quantify ET for work dealing with water resource management or environmental stud- ies. ET quantification frequently must be preceded by the determination of reference evapotranspiration (ETo) [1]. There are several methods to estimate ETo, but their performance in different environments is diverse, since all of them have some empirical background. The FAO Penman-Monteith (EToPM) method has been considered
appropriate for the calibration of other ETo estimation equations. The utilization of these calibrated ETo equa- tions is recommended in the absence of data of any of the meteorological parameters necessary for the application of EToPM [4].
Hargreaves and Samani [5] developed an alternative approach to estimate ETo where only mean maximum and mean minimum air temperature and extraterrestrial radiation are required (the Hargreaves-Samani method is referred to hereafter as HS). Because extraterrestrial ra- diation can be calculated for a certain day and location, only minimum and maximum temperatures are the pa- rameters that require observation [2].
The HS method has been successfully compared with the EToPM using full datasets, or with grass lysimeter data, indicating that the HS method performs well in most climatic regions, with the exception of humid area where it tends to overestimate ETo [6]. The HS method is usually preferred with respective to other more com- plicated equations since it is reasonably adequate and requires only maximum and minimum air temperatures [7].
Therefore, the objective of this study was to evaluate the performance of the HS method to estimate ETo, in São João, Pernambuco, Brazil.
2. Material and Methods
2.1. Experimental Site, Climate and Soil
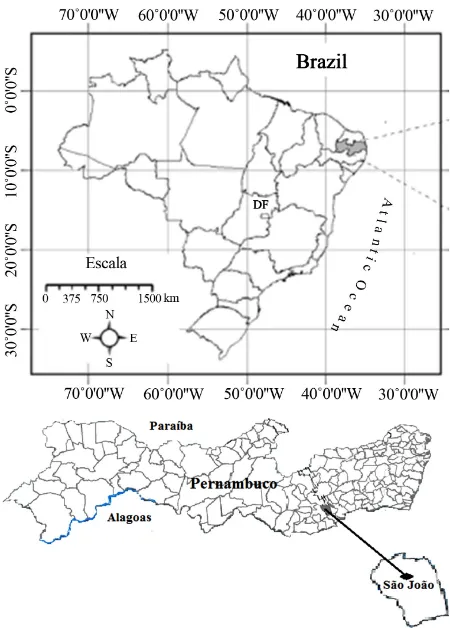
The study site was located at the “Riacho do Papagaio” Farm, in the Mundaú representative basin, county of São João, state of Pernambuco (8˚52'30"S, 36˚22'00"W, ele- vation 705 m) in north-eastern Brazil (Figure 1). The
study was conducted throughout the year in 2011 and from February to December in 2012.
According to data from the Water and Climate Agency of Pernambuco [8] the total annual rainfall is 782.0 mm, and the wettest trimester consists of the months of May, June and July. The soil at the experimental site is classi- fied as Neosoil Regolithic [9], which corresponds to En- tisol in the American Soil Taxonomy [10].
2.2. Field Measurements
A micro-meteorological tower was established in the centre of the experimental field, and sensors were in- stalled to record measurements of reference evapotran- spiration. The dry and wet bulb temperatures were meas- ured using integrated temperature-humidity probes (model HMP45C, Vaisala, Campbell Scientific Inc., Logan, UT, USA). The wind speed (U) was monitored with cup anemometers (model 014 A, Campbell Scien- tific Inc., Logan, UT, USA). The measurements were collected at 2.0 m above the top of the crop canopy.
[image:2.595.310.535.83.397.2]Net radiation (Rn) was measured with a net radiometer
Figure 1. Map of the study site.
(model Q7 net radiometer, REBS, Seattle, WA, USA) installed 2.0 m above the vegetation surface. The solar global radiation (Rs) was measured with a pyranometer (model LI-200X, LI-COR Inc., Lincoln, NE, USA). The soil heat flux (G) was measured using two-soil heat flux plates (model HFT3, REBS, Seattle, WA, USA) inserted at 0.05 m below the soil surface. Two temperature sen- sors (model 108L, Campbell Scientific Inc., Logan, UT, USA) were also located at 0.02 and 0.08 m below the soil surface to calculate the surface ground heat flux. The measurements from all of the sensors were recorded by a data logger (model CR10X, Campbell Scientific Inc., Logan, UT, USA) every 60 s. The mean/sum data were logged every 1800 s.
2.3. Evapotranspiration Estimation Methods The FAO Penman-Monteith method for calculating ETo can be expressed as [11]:
2 2
900 0.408
273 EToPM
1 0.34
s a a
Rn G U e e
T U
(1)
where EToPM is the reference crop evapotranspiration (mm·d1), Rn is the net radiation (MJ·m2·d1), G is the
2 1
saturation vapour pressure with temperature (kPa·˚C1), γ
is the psychometric constant (kPa·˚C1) e
s is the satura- tion vapor pressure (kPa), ea is the actual vapor pressure (kPa), Ta is the average daily air temperature (˚C), and U2
is the mean daily wind speed at 2 m (m·s1). The compu-
tation of all data required for calculating ETo were per- formed following Allen et al. (1998).
The HS method requires only observed Tmin (˚C) and
Tmax (˚C) for the estimation of ETo (mm·d−1), which is
given as:
max min
EToHS0.0135kRsR Ta T Ta17.8 (2) where Ra is the extraterrestrial radiation (mm
2.4. Calibration and Validation of HS Method
on ·d1),
0.0135 is a factor for conversion from American to the International system of units and kRs is the radiation ad- justment coefficient. In the common version of HS equa- tion the value kRs= 0.17 is used [12].
To calibrate the HS equation, the slope of the regressi between daily EToPM and daily EToHS was forced to pass through the origin. The calibration coefficient was then obtained by calculating the product of the slope of the regression lines and the original coefficient.
slope
HS Rs
C k (3) where CHS is the new calibration coe
2.5. Evaluation Criteria
quare error (RMSE), corre- fficient for the Har- greaves-Samani method (the Hargreaves-Samani method calibrated is referred to hereafter as HSc). The data of 2011 were used for calibration and data of 2012 were used for validation.
In this study, the root mean s
lation coefficient (r) and index of agreement “d” [13] were used for the evaluating HS and HSc methods. The RMSE and index d are defined as:
2 1RMSE
n P O
i i i
n
(4)
2 1
2 1
1
n
i i i
n
i i
i
P O d
P O O O
(5)where Pi and Oi are the predicted and observed values,
3. Results and Discussion
[image:3.595.312.534.82.281.2]imated mean respectively; O is the average of Oi, and n is the total number of data.
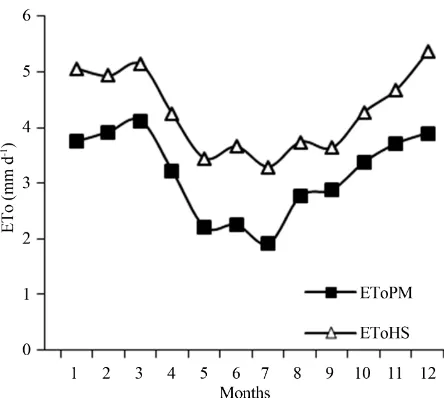
Figure 2 shows the comparisons of est
monthly ETo values using EToPM and HS methods in
Figure 2. Comparison of mean monthly EToPM and
011. The non-calibrated Hargreaves-Samani method
ationship between daily values of EToPM and ET
method estimates have a close relationship w
analysis (Table 1) shows that estimate
of
method cannot be us
EToHS and methods in São João, Pernambuco, Brazil, dur- ing the year of 2011.
2
(EToHS) overestimated the ETo in all months, mainly in months of lower evaporative demand. However, this method showed the same tendency in the evolution of monthly ETo values, when compared to EToPM method. The values of EToPM varied from 1.9 to 4.1 mm·d−1,
with average of 3.2 mm·d−1, while the values of ETHS
varied from 3.3 to 5.4 mm·d−1, and mean ETo was 4.3
mm·d−1.
The rel
oHS in 2011 and 2012 (non calibrated) is showed in
Figure3.
The HS
ith estimates from the Penman-Monteith method with the coefficients of determination (r2) of 0.78 in 2011 and
0.74 in 2012. However the general tendency of the EToHS is to overestimate ETo, which can be seen by the regression slope and by the regression intercept. These results contradict findings by Moeletsi et al. [14] in dif- ferent environmental conditions in South Africa which showed an underestimation by the HS method. Allen et al. [11] have indicated that high humidity conditions (as in this study) may result in an overestimation by HS method of ETo.
The statistical
ETo by HS method (non-calibrated) had RMSE higher in 2012 (1.43 mm·d−1) than in 2011 (1.21 mm·d−1). The
index d was lower in 2012 (non-calibrated) than in 2011, indicating low agreement of ETo estimated by Har- greaves-Samani method in this year.
Because of these tendencies, this
Figure 3. Relationship between daily EToPM and EToHS in
able 1. Statistical performance of the EToHS and EToHSc
d RMSE (mmd1)
São João, Pernambuco, Brazil, during the growing season of 2011 (a) and 2012 (b).
T
versus EToPM for estimating daily ETo during 2011 and 2012 in São João, Brazil.
r
HS 2011 0.89 0.70 1.21
HS 2012 0.86 0.56 1.43
HSc 2012 0.86 0.83 0.52
djusting the parameters to local conditions. Thus, a
months from May to July (period of lower ev
new coefficient was 0.13. These results ar
values of EToPM and ET
tion (E
values obtained in
[image:4.595.59.285.71.499.2]Fi
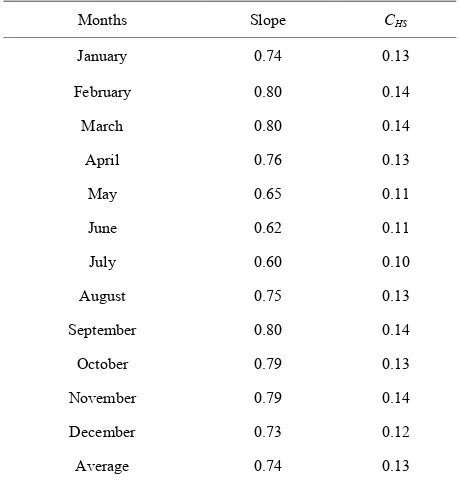
able 2. The slopes of regression lines between estimated
CHS
a
calibration of coefficient kRs was performed for every month with data of 2011 (period of calibration), then the data of 2012 were used to validate the method of HS (HSc method). These new calibration coefficient (CHS)
[image:4.595.308.538.493.734.2]and slopes of regression of each month are showed in
Table 2.
In the
aporative demand in this region) the calibrated coeffi- cient ranges from 0.10 to 0.11 and slopes of EToPM to EToHS ranges from 0.60 to 0.65, indicating higher over- estimate of ETo by HS method in this period. In other months calibrated coefficient ranged from 0.12 to 0.14 and slopes from 0.73 to 0.80, indicating lower overesti- mate of ETo.
Overall, the
e different of Moeletsi et al. (2013), that studied the ability of the HS method to estimate ETo in the semi-arid Free State Province of South Africa, and found values of
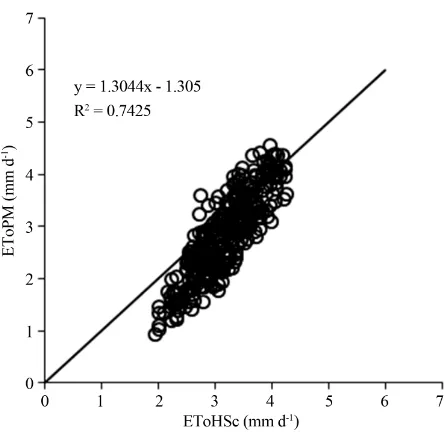
CHS ranged from 0.150 to 0.215. The relationship between daily
oHSc in 2012 (calibrated) is showed in Figure 4.
The calibrated Hargreaves and Samani equa ToHSc) was used to estimate daily ET from February 08 to December 31. The use of the new coefficient (CHS), 0.13 instead 0.17, improved the Hargreaves and Samani estimate at all the months. This is shown by the substan- tial reduction in RMSE values, from 1.43 to 0.52 mm·d−1,
and by substantial increase of index d, from 0.56 to 0.83 (Table 1). Other authors [14,15] also recorded an im-
provement in the estimation of the Hargreaves and Samani equation after calibration.
The correlation between the two
gure 4 shows that the reference ET for this region can
T
daily EToHS and EToPM and the calibration coefficients of the Hargreaves and Samani equation (CHS) for each month
using data from 2011.
Months Slope
January 0.74 0.13
February 0.80 0.14
March 0.80 0.14
April 0.76 0.13
May 0.65 0.11
June 0.62 0.11
July 0.60 0.10
A
S
N
ugust 0.75 0.13
eptember 0.80 0.14
October 0.79 0.13
ovember 0.79 0.14
December 0.73 0.12
[image:4.595.58.286.588.661.2]pp. 33-45. http://dx.doi.org/10.1023/A:1015508322413 [4] G. Landeras, A. Ortiz-Barredo and J. J. López, “Com-
parison of Artificial Neural Network Models and Empiri- cal and Semi-Empirical Equations for Daily Reference Evapotranspiration Estimation in the Basque Country (Northern Spain),” Agricultural Water Management, Vol. 95, No. 5, 2008, pp. 553-565.
http://dx.doi.org/10.1016/j.agwat.2007.12.011
[5] G. H. Hargreaves and Z. Samani, “Reference Crop Evapotranspiration from Temperature,” Journal of Ap-plied Engineering in Agriculture, Vol. 1, No. 2, 1985, pp. 96-99. http://dx.doi.org/10.13031/2013.26773
[6] T. Raziei and L. S. Pereira, “Estimation of ETo with Har- greaves-Samani and FAO-PM Temperature Methods for a Wide Range of Climates in Iran,” Agricultural Water Management, Vol. 121, 2013, pp. 1-18.
http://dx.doi.org/10.1016/j.agwat.2012.12.019
[7] G. H. Hargreaves and R. G. Allen, “History and Evalua- tion of Hargreaves Evapotranspiration Equation,”
of Irrigation and Drainage Engineering, Vol. 129Journal , No. 1, 2003, pp. 53-63.
http://dx.doi.org/10.1061/(ASCE)0733-9437(2003)129:1( 53)
[image:5.595.61.284.81.297.2][8] APAC, “Water and Climate Agency of Pernambuco,” 2013. http://www.apac.pe.gov.br
Figure 4. Relationship between daily EToPM and cali-brated EToHSc in São João, Pernambuco, Brazil, during the growing season of 2012.
Rs
We consider the magnitude of the correlat
ng the daily ETo for this region when on te
is suitable for predicting imate of São João, Pernambuco, radiation, humidity and wind sp
[1] R. Lopez-Urrea, F. Martin de Santa Olalla, C. Fabeiro
A. Moratalla, “ ations Us-
ing Lysimeter arid Climate,”
Ag-egion of Pernambuco,”
rvation Service, Washington DC, 2006.
56,
Richard G. Allen,” Journal of Irrigation
be estimated reliably using the following Hargreaves-
Samani equation: [9] J. C. B. Santos, V. S. Souza Júnior, M. M. Corrêa, M. R. Ribeiro, M. C. Almeida and L. E. P. Borges, “Carachteri- zation of Entisols of Semiarid R
ETo 1.3044 EToHSc 1.305 (6) where EToHSc is ETo calculated from Equation (2), with
k = 0.13.
ion coeffi-
Brazilian Journal of Soil Science, Vol. 36, No. 3, 2012, pp. 683-695.
[10] Soil Survey Staff, “Keys to Soil Taxonomy,” 8th Edition, United States Department of Agriculture, Natural Re-sources Conse
cient (r2 = 0.742) and RMSE (0.52 mmd1) acceptable
for estimati ly air
[11] R. G. Allen, L. S. Pereira, D. Raes and M. Smith, “Crop Evapotranspiration: Guidelines for Computing Crop Wa- ter Requirements,” FAO Irrigation and Drainage Paper mperature data are available.
4. Conclusion
The Hargreaves-Samani method
Rome, 1998.
[12] Z. Samani, “Discussion of ‘History and Evaluation of Hargreaves Evapotranspiration Equation’ by George H. Hargreaves and
ETo in sub-humid cl
Brazil when solar eed and Drainage Engineering ASCE,Vol. 130, No. 5, 2004, pp. 447-448.
http://dx.doi.org/10.1061/(ASCE)0733-9437(2004)130:5( 447.2)
[13] C. J. Willmott, S. G. Ackleson, J. J. Davis, K. M. Fed-dema and D. R. Klink. “Statistics for the evaluation and compari
data are missing, being that this method has to be cali- brated for a better performance.
REFERENCES
son of models,” Journal of Geophysical Research, and
Vol. 90, No. C5, 1985, pp. 8995-9005. http://dx.doi.org/10.1029/JC090iC05p08995
[14] M. E. Moeletsi, S. Walker and H. Hamandawana, “Com- parison of the Hargreaves and Samani Equa
Thornthwaite Equation for Estimating Dekada Testing Evapotranspiration Equ
Observations in a Semi
ricultural Water Management, Vol. 85, No. 1-2, 2006, pp. 15-26. http://dx.doi.org/10.1016/j.agwat.2006.03.014 [2] P. C. Sentelhas, T. J. Gillespie and E. A. Santos, “Evalua-
tion of FAO Penman-Monteith and Alternative Methods for Estimating Reference Evapotranspiration with Miss-
tion and the l Evapotran- spiration in the Free State Province, South Africa,” Phys- ics and Chemistry of Earth, Vol. 66, 2013, pp. 4-15. http://dx.doi.org/10.1016/j.pce.2013.08.003
[15] P. Gavilán, I. J. Lorite, S. Tornero and J. Berengena, “Regional Calibration of Hargreaves Equation for E mating Reference ET in a Semiarid Environ
ing Data in Southern Ontario, Canada,” Agricultural Wa- ter Management, Vol. 97, No. 5, 2010, pp. 635-644. http://dx.doi.org/10.1016/j.agwat.2009.12.001
[3] P. Droogers and R. G. Allen, “Estimating Reference Evapotranspiration under Inaccurate Data Conditions,”
Irrigation and Drainage Systems, Vol. 16, No. 1, 2002