Correlation between diabetes prevalence and
subsequent cancer mortality in North Carolina
counties
John G. Spangler
*, Julienne Kirk
Department of Family and Community Medicine, Wake Forest School of Medicine, Medical Center BLVD, Winston-Salem, USA;
*
Corresponding Author
Received 8 November 2013; revised 6 December 2013; accepted 14 December 2013
Copyright © 2014 John G. Spangler, Julienne Kirk. This is an open access article distributed under the Creative Commons Attribu-tion License, which permits unrestricted use, distribuAttribu-tion, and reproducAttribu-tion in any medium, provided the original work is properly cited. In accordance of the Creative Commons Attribution License all Copyrights © 2014 are reserved for SCIRP and the owner of the intellectual property John G. Spangler, Julienne Kirk. All Copyright © 2014 are guarded by law and by SCIRP as a guardian.
ABSTRACT
Worldwide, over 250 million people live with di- abetes mellitus, a disease which has been de- scribed as an epidemic. While much is known about the cardiovascular risks associated with this condition, its association with cancer has been less appreciated at the population level. This study assessed the relationship between colo-rectal, breast and prostate cancer mortality, and diabetes prevalence measured years earlier at the county level in the 100 counties of North Carolina. Methods: County level data were ob- tained from the 2000 US Census, the Centers for Disease Control and Prevention, and the North Carolina State Center for Health Statistics. The 2004 diabetes prevalence data by county and county level mortality from 2005 to 2009 for co-lorectal, breast and prostate cancer mortality were analyzed descriptively. Then multivariate linear regression was carried out to evaluate the contribution of pre-existing diabetes prevalence to cancer mortality, controlling county level co-variates. Results: Average North Carolina coun- ty level prevalence of diabetes mellitus in 2004 (9%) was higher than the average preva- lence of diabetes nationally in 2004 (7%). Mor- tality rates for breast, colorectal and prostate cancers at the county level were also higher than those na-tionally. In multivariate analysis, county level 2005-2009 total cancer mortality as well as mor-tality from colon and prostate can- cers (but not breast cancer) correlated with county level 2004 diabetes prevalence rates. Diabetes mellitus prevalence in 2004 explained 31%, 34% and
42% of the variance of mortality from prostate, colorectal and total cancers. Conclusions: The- se findings support the relationship between diabetes mellitus and cancer at the population level. Direct and indirect costs of cancer care in North Carolina in 2004 were $5.57 billion. Be-cause diabetes explained 42% of the variance of total county level cancer mortality, prevention and control of diabetes could save the state over $2 billion.
KEYWORDS
Diabetes Mellitus; Cancer; Mortality; North Carolina
1. INTRODUCTION
Over 250 million people live with diabetes globally, a number which is set to expand to over 365 million by about 2030 [1,2]. While the cardiovascular risks asso- ciated with diabetes mellitus are well known, less is ap- preciated by the public and physicians [3] regarding this disease’s relationship with cancer [1]. The association is likely to be complex, involving not only hyperglycemia and hyperinsulinemia, but also physical activity, diet and obesity [1,4]. Additionally, patient- and organ-specific factors may make individuals vulnerable to carcinogene- sis [1]. Of crucial importance, not only is diabetes related to cancer, but diabetes increases cancer mortality [4].
Results have been equivocal for prostate cancer [14]. Diabetes shares many common etiologies, such as in-creasing age, male gender, African Americans and non- Hispanic white ethnicity, being overweight, inactivity, smoking and drinking excessive alcohol [15]. Theoretical mechanisms mainly focus on insulin and insulin-like growth factor (IGF-1 and IGF-2), implicating type 2 diabetes mellitus as the major contributing disease state [1]. These growth factors share about 80% similarity with insulin. Moreover, high levels of insulin decrease the growth factors’ binding proteins, exposing tissue to even higher levels of free IGF-1 and IGF-2 [16].
While studies have evaluated these mechanisms at the individual level, the impact of diabetes on cancer rates at the population level has not been fully evaluated. This study looked at county level data from the 100 counties of the state of North Carolina and evaluated the relation- ship between mortality of colo-rectal, breast and prostate cancer; and diabetes prevalence rates by county years earlier to see if elevated rates of county level diabetes preceded cancer deaths rates.
2. METHODS
Data for this study were obtained from the 2000 US Census, the Centers for Disease Control and Prevention, and the North Carolina State Center for Health Statistics as described earlier [17]. Specific to this study, 2004 NC county prevalence rates of diabetes mellitus were ob- tained from the CDC [18]. Additionally, mortality rates for cancer of the breast, colo-rectum and prostate were obtained from the NC State Center for Health Statistics for the combined years of 2005-2009 [19]. Thus, county level exposure to prevalent diabetes preceded cancer death rates. Data on demographics, diabetes prevalence and cancer rates were analyzed descriptively. Next, mul-
tivariate linear regression was carried out to evaluate the contribution of 2004 prevalence of diabetes rates to can- cer mortality. All models controlled for demographics, and significance was set at <0.05. IBM SPSS 21 statis- tical software was used for analyses.
3. RESULTS
Mean county population was 80,494 and median county income was $34,874 (Table 1). Average county level poverty was nearly 14%. Mean diabetes prevalence was 9% in all 100 counties (mean 2004 US prevalence = 7%) [18]. Total cancer mortality for North Carolina was 194.3 per 100,000 population for 2005-2009 which is higher than the estimate for the US for 2006 (180.7 per 100,000 population). In addition, both North Carolina breast cancer and prostate cancer mortality rates for 2005-2009 (24.1 and 26.9 per 100,000 population, re- spectively) were higher than the US 2004-2008 death rates (23.5 and 24.4 per 100,000 population, respectively [20]. Finally, North Carolina colorectal cancer death rate for 2005-2009 was 17.5 per 100,000 population, which again is higher than that of the US population (15.7 per 100,000 population) [21].
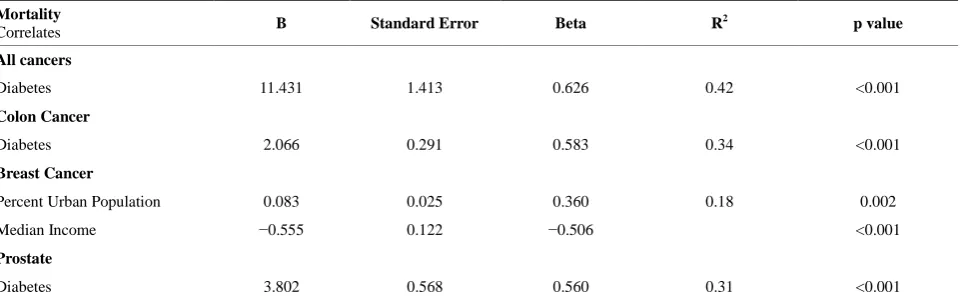
[image:2.595.56.540.549.706.2]The county-level diabetes prevalence of 2004 [18] correlated with the 2005-2009 death rates [19] of all cancers, colon cancer and prostate cancer (p < 0.001 for all). Breast cancer death rates correlated positively with county-level percent urban population and negatively with median income of counties (p = 0.002 and p < 0.001, respectively). Diabetes explained 42% of the variance of total cancer mortality, 34% of the variance for colon cancer mortality and 31% of the variance for prostate cancer mortality. Together, percent county level urban population and median income explained 18% of the variance for breast cancer mortality.
Table 1. North Carolina county demographic, diabetes and cancer variables (mean, standard deviation, minimum and maximum
val-ues).
County Variable Mean SD Minimum Maximum
Population 80494 108091 4149 695454
Median Income of County 34874 5757.5 25180 54999
Percent Poverty 13.8 4.3 0.8 23.2
Percent < High School education 11.3 2.1 5.0 20.1
Diabetes Prevalence (percent population) (2004)# 9.0 1.2 6.7 13.0
Total Cancer Mortality* 194.3 22.7 149.3 257.3
Colon Cancer Mortality* 17.5 4.4 10.0 35.5
Breast Cancer Mortality*+ 24.1 6.3 0.0 45.5
Prostate Cancer Mortality*+ 26.9 8.4 11.7 53.2
*All cancer rates are per 100,000 population. Cancer rates are age-adjusted and combined from 2005 to 2009 from North Carolina State Center for Health
Sta-tistics. #2004 diabetes prevalence from Centers for Disease Control and Prevention +Breast cancer rates are
4. DISCUSSION
We have found that county level diabetes mellitus pre- valence in 2004 correlated with cancer death rates from 2005-2009 for all cancers, colon cancer and prostate cancer. For cancer mortality rates, diabetes explained between 31% and 42% of the variance in linear regres-sion modeling. The fact that diabetes prevalence pre-ceded cancer mortality lends some support to the hy-pothesis that in North Carolina, diabetes mellitus may be involved in the development of cancer—at least at the county level. While studies evaluating this relationship at the individual level have found a diabetes-cancer con-nection [5-13], this is the first population level analysis in North Carolina estimating the variance explained at the county level by diabetes. Since cancer mortality is associated with multiple causes at the individual level, the percent variance explained by diabetes at the popula-tion level for all cancers, colon cancer and prostate can-cer is surprisingly high.
At the cellular level, diabetes, through insulin resis- tance, hyperinsulinemia, and elevated IGF-1 and -2, in- creases cell growth, helping to promote cancer [16]. While population data cannot be extrapolated down to the individual level, the county-level connection between cancer mortality and diabetes which we found is biolog- ically plausible. Other variables might also come into play at the population level. For example breast cancer at the population level is associated with the median in- come and percent urban population of a county. There are likely many other population level factors which we have not measured involved in county cancer death rates for all cancers, colon cancer and prostate cancer. For decades, population level socioeconomic factors (espe- cially lower socioeconomic status) have been known to correlate with cancer [22-25]. Indeed, cancer rates glo- bally are set to rise due in large part by the adoption by developing nations unhealthy Western lifestyle factors
such as cigarette smoking, physical inactivity and poor diet. Very frequently, these behaviors co-exist [3,15]. Aside from county-level socioeconomic variables (e.g., median income, high school education and percent po- verty), our analysis could not account for these particular cancer risk factors. Nor could our analysis account for the fact that many pro-carcinogenic behaviors co-exist.
Despite these limitations, this study has important im- plications for public health in North Carolina. For exam- ple, focusing resources on the prevention, diagnosis and treatment of diabetes may also have the additional bene- fit of reducing cancer mortality state-wide. Cancer screening is still vitally important, and one plausible reason we did not find a relationship between breast cancer mortality and diabetes might be due to increased awareness or uptake of screening mammography, de- tecting breast cancer at earlier stages [26,27]. Nonethe- less a focus on diabetes prevention might help reduce mortality from cancers which cannot be screened for such as liver, kidney, pancreas and bladder. Given that in 2004 the state of North Carolina spent $5.57 billion on direct and indirect costs of cancer care [25], diabetes prevention and control can have a large effect on health expenditures not only for diabetes, but also for cancer. It is unlikely that all diabetes could ever be eliminated in the state. However, if, as we have found, diabetes ex- plains 42% of the variance in county level mortality from all cancers (Table 2), the savings from reduction of di- abetes could approach over $2 billion.
5. CONCLUSION
[image:3.595.59.540.564.714.2]The findings from this study support the relationship between diabetes mellitus and cancer at the population level that warrants enhanced strategies to increase aware- ness for cancer screening among patients with this dis- order. The development of population strategies to pre- vent and treat diabetes appears important in North Caro-
Table 2. Linear regression correlates of all cancers, as well as colon, breast and prostate cancers.
Mortality
Correlates B Standard Error Beta R
2 p value
All cancers
Diabetes 11.431 1.413 0.626 0.42 <0.001
Colon Cancer
Diabetes 2.066 0.291 0.583 0.34 <0.001
Breast Cancer
Percent Urban Population 0.083 0.025 0.360 0.18 0.002
Median Income −0.555 0.122 −0.506 <0.001
Prostate
Diabetes 3.802 0.568 0.560 0.31 <0.001
lina. Moreover, education of health care providers about the diabetes-cancer relationship deserves strong consid- eration.
REFERENCES
[1] Vigneri, P., Frasca, F., Sciacca, L., Pandini, G. and Vig- neri, R. (2009) Diabetes and cancer. Endocrine-Related Cancer, 16, 1103-1123.
[2] Wild, S., Roglic, G., Green, A., Sicree, R. and King, H. (2004) Global prevalence of diabetes. Diabetes Care, 27,
1047-10
[3] Irizarry, L., Li, Q.E., Duncan, I., et al. (2013) Effects of Cancer Comorbidity on Disease Management: Making the Case for Diabetes Education (A Report from the SOAR Program). Population Health Management, 16,
53-
[4] Giovannucci, D., Harlan, D.M., Archer, M.C., et al. (2010). Diabetes and Cancer: A Consensus Report. Dia-betes Care, 33, 1674-1685.
[5] El-Serag, H.B., Hampel, H. and Javadi, F. (2006) The association between diabetes and hepatocellular carci- noma: A systematic review of epidemiologic evidence.
Clinical Gastroenterology and Hepatology, 4, 369-380.
[6] Huxley, R., Ansary-Moghaddam, A., Berrington de Gon- zalez, A., Barzi, F. and Woodward, M. (2005) Type-II diabetes and pancreatic cancer: A meta-analysis of 36 studies. British Journal of Cancer, 92, 2076-2083.
[7] Lindblad, P., Chow, W.H., Chan, J., Bergstrom, A., Wolk, A., Gridley, G., McLaughlin, J.K., Nyren, O., Adami, H.O. (1999) The role of diabetes mellitus in the aetiology of renal cell cancer. Diabetologia, 42, 107-112.
[8] Washio, M., Mori, M., Khan, M., Sakauchi, F., Watanabe, Y., Ozasa, K., Hayashi, K., Miki, T., Nakao, M., Mikami, K. et al. (2007) Diabetes mellitus and kidney cancer risk: the results of Japan Collaborative Cohort Study for Eva- luation of Cancer Risk (JACC Study). International Jour- nal of Urology, 14, 393-397.
[9] Friberg, E., Orsini, N., Mantzoros, C.S. and Wolk, A. (2007) Diabetes mellitus and risk of endometrial cancer: A meta-analysis. Diabetologia, 50, 1365-1374.
[10] Larsson, S.C., Orsini, N. and Wolk, A. (2005) Diabetes mellitus and risk of colorectal cancer: A meta-analysis.
Journal of the National Cancer Institute, 97, 1679-1687.
[11] Larsson, S.C., Orsini, N., Brismar, K. and Wolk, A. (2006) Diabetes mellitus and risk of bladder cancer: A meta- analysis. Diabetologia, 49, 2819-2823.
[12] Larsson, S.C., Mantzoros, C.S. and Wolk, A. (2007) Dia-betes mellitus and risk of breast cancer: A meta-analysis.
International Journal of Cancer, 121, 856-862.
[13] Mitri, J., Castillo, J. and Pittas, A.G. (2008) Diabetes and risk of non-Hodgkin’s lymphoma: A meta-analysis of ob-servational studies. Diabetes Care, 31, 2391-2397.
[14] Kasper, J.S. and Giovannucci, E. (2006). A meta-analysis of diabetes mellitus and the risk of prostate cancer. Can- cerEpidemiology, Biomarkers and Prevention, 15, 2056-
206
[15] American Diabetes Association (2013) Diabetes and Cancer.
[16] Manjinder, S., Sandhu, M.S., Dunger, D.B. and Giovan- nucci, E.L. (2002) Insulin, Insulin-Like Growth Factor-I (IGF-I), IGF binding proteins, their biologic interactions, and colorectal cancer. Journal of the National Cancer In- stitute, 94, 972-980.
[17] Spangler, J.G. (2012) Diabetes mortality and environ- mental heavy metals in North Carolina counties: An eco- logical study. Journal of Diabetes Mellitus, 2, 369-372.
[18] Center for Disease Control and Prevention (2013) Diabe-tes Data and Trends.
[19] (2013) North Carolina State Center for Health Statistics.
[20] Jemal, A., Siegel, R., Ward, E., Hao, Y., Xu, J. and Thun, M.J. (2009) Cancer Statistics. CA: A Cancer Journal for Clinicians, 59, 225-249.
[21] CDC (2013) US Cancer Statistics: An Interactive Atlas.
[22] Dayal, H., Chiu, C.Y., Sharrar, R., et al. (1984) Ecologic correlates of cancer mortality patterns in an industrialized urban population. Journal of the National Cancer Insti- tute, 73, 565-574.
[23] Stocks, P. (1960) On the relations between atmospheric pollution in urban and rural localities and mortality from cancer, bronchitis and pneumonia, with particular refer- ence to 3,4-benzopyrene, beryllium, molybdenum, vana- dium and arsenic. British Journal of Cancer, 14, 397-418.
[24] Jemal, A., Center, M.M., DeSantis, C. and Ward, E.M. (2010) Global Patterns of Cancer Incidence and Mortality Rates and Trends. Cancer Epidemiology, Biomarkers & Prevention, 19, 1893-1907.
[25] Battle, L.A., Knight, K., Gaines, M., Jayathirtha, C. and Williams, D. (2004) North Carolina Cancer Facts and Figures 2004. North Carolina Central Cancer Registry: Raleigh, North Carolina.
117, 714-7 [27] Kalager, M., Zelen, M., Langmark, F. and Adami, H.O.
(2010) Effect of Screening Mammography on Breast-
Cancer Mortality in Norway. The New England Journal of Medicine, 363, 1203-1210.