http://dx.doi.org/10.4236/me.2016.73040
How to cite this paper: Shih, W.R. and Do, N.T.H. (2016) Impact of Tourism on Long-Run Economic Growth of Vietnam. Modern Economy, 7, 371-376. http://dx.doi.org/10.4236/me.2016.73040
Impact of Tourism on Long-Run Economic
Growth of Vietnam
Wurong Shih, Ninh T. H. Do
College of Business, Southern Taiwan University of Science and Technology, Taiwan
Received 24 February 2016; accepted 25 March 2016; published 28 March 2016
Copyright © 2016 by authors and Scientific Research Publishing Inc.
This work is licensed under the Creative Commons Attribution International License (CC BY).
http://creativecommons.org/licenses/by/4.0/
Abstract
Tourism is a potential industry as a new impetus for economic growth of Vietnam, and is identified as a key sector in Vietnamese economy, as such, the Vietnam government has identified the tour-ism industry as a key sector in the national economy and one of the crucial importance in securing its long-term growth. The study examines the role of tourism in driving the economic growth of Vietnam over the period of 1995-2013 by using Tourism-Led Growth Hypothesis (TLGH). The sta-bility of TLGH is analyzed using a Rolling Window regression technique. The analyses performed in this study are based on an econometric methodology consisting of the pooled Ordinary Least Squares test, unit root test, co-integration analysis, and Granger causality test. The findings show that the TLGH is supported in the case of Vietnam. In other words, tourism has indeed played a key role in driving economic growth in Vietnam in recent decades. Moreover, the Rolling Window re-gression results confirm the stability of the TLGH in the case of Vietnam.
Keywords
Tourism, Economic Growth, Tourism-Led Growth Hypothesis, Vietnam
1. Introduction
ward a more service industrial base. The tourism industry in Vietnam has expanded rapidly in recent years due to the free-market-oriented economy [1] and the recognition by government of tourism as a major economic driver. As an engine for economic growth, tourism industry has many positive impacts in terms of generating foreign exchange earnings, creating employment, and generating income [2]. Honey and Gilpin [3] reported that tourism had had a snowball effect on contributing to economic growth in Vietnam. Moreover, Bennet [4] de-scribed Vietnam as an emerging economy with a significant and growing low cost tourism market.
Tourism is one of the largest and most dynamic industries in the world-economy, and has significant multip-lier effects on economic activity. Researchers have long investigated tourism in established areas such as Aus-tralia, Taiwan [5], Span [6], Italy [7], or Korea [8]. However, the tourism industry in Vietnam has attracted rela-tively little attention thus far. In a rare study, H.M.T. Nguyen, H.C.D. Nguyen, and T.D. Nguyen [9] showed that TLGH is valid for Vietnam. However, the analyses focused only on the hotel and restaurant sector, and thus there is no guarantee that the findings can be extended to the tourism industry as a whole. Ridderstaat, Croes, and Nijkamp [10] argued that government policy planners need to understand the validity of the TLGH in their particular case in order to devise appropriate tourism strategies. The present study thus tests the validity of the TLGH for economic growth in Vietnam based on economic and tourism data collected over the period of 1995-2013. Importantly, the study provides a wider perspective on the role played by tourism in stimulating economic growth than earlier studies based on the hotel and restaurant sector alone. As such, the results provide more robust basis on which to formulate effective tourism policies.
The TLGH has been widely used in the literature to test the causality relationship between tourism and eco-nomic growth (Lokman and Abdulnasser 2005 [8] [11] [12]). In utilizing the TLGH to investigate the role played by tourism as an economic driver in Vietnam, the present study adopts an econometric methodology based on the pooled Ordinary Least Squares (OLS) test, a unit root test, co-integration analysis, and Granger causality test. Notably, the proposed methodology provides a more reliable understanding of the validity of the TLGH than that obtained using a single metric alone. Lean and Tang [13] argued that the stability of the causal-ity relationship over the sample period was also an important factor. Thus, the present study aims to understand not only the validly of the TLGH in the case of Vietnam, but also its stability over time.
2. Data and Methodology
Based on previous studies by Lee and Chien [14], Balaguer and Cantavella-Jorda [6], and Kasimati [15], several variables were used including real GDP, tourist receipts, tourist arrivals, and real exchange rate to test the signi-ficance between tourism and economic growth. The present study investigates the causality relationship between tourism and economic growth in Vietnam by used of three variables, namely the Gross Domestic Product (GDP), tourist arrivals (TOUR), and the real exchange rate (EXR) [16]. The GDP and tourist arrival information were obtained directly from the annual reports published by the General Statistical Office of Vietnam over the sample period (1995-2013). Tourist expenditure data were available only from 2003 to 2013. Furthermore, Ka-tircioglu [17] found a multicollinearity problem emerges when tourism receipts are used. Thus, tourism expend-iture was excluded from analysis. The real exchange rate (Vietnam Dong per USD) was calculated by multiply-ing the Vietnam Dong per USD and consumer price index in Vietnam. Table 1 summarizes the data used in the analyses.
In accordance with the studies of Lee and Chang [18], Fayissa, Nsiah, and Tadasse [19], Sadi and Henderson [20], and Makochekanwa [21] and the analysis model was formulated as follows:
it 0 1 it 2 it it
ln GDP =β +β ln TOUR +β ln EXR +ε (1) All of the variables were transformed into a natural logarithm form in order to induce stationarity in the va-riance-covariance matrix. The model given in Equation (1) was tested using the pooled OLS regression.
Table 1. Summary statistics of analyzed data.
Variables GDP TOUR EXR
Mean 69.07211 3429758 15715.95
Median 49.42000 2927876 15746.00 Maximum 171.3900 7572352 20933.42 Minimum 20.74000 1351300 11032.58 Std. Dev. 47.72835 1844306 2981.106
0 1 1 1 1 2 1 1 4
ln GDPt λ mi=λi ln GDPt− im=λi ln TOURt− im=λi ln EXRt i− εt
∆ = +
∑
∆ +∑
∆ +∑
∆ + (2)0 1 1 1 1 2 1 1 4
ln TOURt λ mi= λi ln GDPt− im=λi ln TOURt− im= λi ln EXRt i− εt
∆ = +
∑
∆ +∑
∆ +∑
∆ + (3)where λ is the deterministic component and εt is white noise. To investigate the long-run relationship be-tween tourist arrival (TOUR) and GDP, this study employs the testing procedure which developed by Engle and Granger [23]. They noted that with two time-series variables co-integrated (i.e. at least one directional Granger causation exists), Granger causality tests can be performed.
3. Empirical Results
At the first step in cointegration analysis, the pooled OLS regression is implemented. Table 2 presents the re-sults of the pooled OLS regression test. It is observed that the GDP is significant correlated with both TOUR and EXR. Moreover, the coefficient of TOUR is positive (2.172). In other words, the number of tourist arrivals increases with an increasing GDP. In additional, the real exchange rate (EXR) has negative sign, an indication that decrease in EXR results in increasing Vietnam’s economic growth in the long run. Moreover, the relation-ship between GDP, TOUR, and EXR are mutually. Thus, when EXR decreases, the volume of international tourist arrivals (TOUR) increases, and GDP increases.
Schubert, Brida, and Risso [24] found that in most economic time-series studies, OLS regressions produce significant parameters and a high R-square result. Consequently, a causality test is required. However, prior to performing causality analysis, a unit root test must first be applied to study the stationarity of the variables. Ta-ble 3 shows the results of the Augmented Dickey-Fuller unit root test for the present variables given a 10% sig-nificance level. As shown, both variables are unit root or non-stationarity at Level, but stationary at First differ-ent. According to Phillips [25], if the residual is non-stationary at Level but stationary at first different, the Jo-hansen co-integration test must be applied to test for the presence of a long-run equilibrium relationship in the regression model.
The results presented in Table 4 show that the null hypothesis is rejected at 10 percent significance level. Therefore, it can be concluded that tourism and economic growth are co-integrated. In other words, a meaning-ful long-run relationship exists between tourism and economic growth in Vietnam.
Co-integration does not by itself indicate the direction of the causal relationship. Thus, a Granger causality test was further used to confirm the validity of the TLGH in Vietnam.
Table 5 shows the F-test results for both hypotheses, namely tourism does not Granger cause economic growth (3.3108), economic growth does not Granger cause tourism (0.8375). Rejection of the null hypothesis of tourism-led economic growth is accepted. In other words, the TLGH is empirically supported in the case of Vietnam. However, for the second hypothesis, the null hypothesis is not rejected (0.8375). Thus, it is inferred that, economic growth is not a driver tourism growth in Vietnam. This result is consistent with that observed for other countries such as Spanish [6], and may be caused by a small sample size.
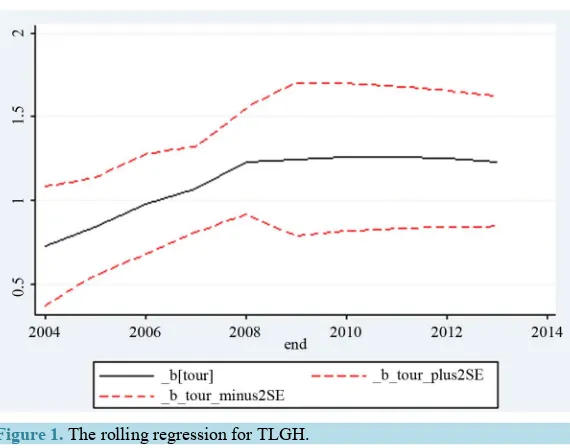
The stability of the TLGH was investigated using the Rolling Window regression technique. No statistical procedure is available for determining the optimal window size. Following Lean and Tang [12], the window size was set at 10 years. Figure 1 shows that the TLGH remains stable over the time for the Vietnam economy.
4. Conclusions
Table 2. Pooled OLS regression.
Variables Coefficient Std. Error t-Statistic Prob. LOG (TOUR) 2.172605 0.216521 10.03415 0.0000
[image:4.595.114.512.391.588.2]LOG (EXR) −2.943712 0.335003 −8.787115 0.0000 R-Squared 0.885357 Mean Dependent Var 4.014249 Adjusted R-Squared 0.878613 S.D. Dependent Var 0.681372 S.E. of Regression 0.237394 Akaike Info Criterion 0.061111 Sum Squared Residual 0.958052 Schwarz Criterion 0.160526 Log Likelihood 1.419442 Hannan-Quinn Criter 0.077936 Durbin-Watson Stat 1.201880
Table 3. Augmented dickey-fuller test of stationary.
ADF Test
Level First Different Second Different
Intercept Intercept & Trend None Intercept Intercept & Trend None Intercept Intercept & Trend None
GDP 5.412 0.821 10.411 0.441 −4.760** 2.140 −4.503** −4.529* −5.121***
TOUR 1.936 −0.442 4.221 −3.192* −5.140** −2.167* −4.774** −4.673* −4.539***
EXR 0.057 −3.264 2.344 −3.284* −3.189 −1.618* −4.777** −4.834** −5.072***
Note: *Significant at 10% level; **Significant at 5% level; ***Significant at 1% level.
Table 4. Augmented dickey-fuller test of stationary.
Unrestricted Cointegration Rank Test (Trace)
Hypothesized Trace 0.05
No. of CE(s) Eigenvalue Statistic Critical Value Prob.**
None* 0.735329 40.60144 29.79707 0.0020
At most 1* 0.585743 18.00389 15.49471 0.0205
At most 2 0.162876 3.022315 3.841466 0.0821 Unrestricted Cointegration Rank Test (Maximum Eigenvalue)
Hypothesized Trace 0.05
No. of CE(s) Eigenvalue Statistic Critical Value Prob.**
None* 0.735329 22.59756 21.13162 0.0309
At most 1* 0.585743 14.98157 14.26460 0.0384
At most 2 0.162876 3.022315 3.841466 0.0821
Table 5. The Granger causality test results.
Null Hypothesis: F-Statistic Probability Result lnTOUR does not Granger Cause lnGDP 3.3108 0.0711* Significant
lnGDP does not Granger Cause lnTOUR 0.8375 0.5066 Non-Significant lnEXR does not Granger Cause lnGDP 1.4273 0.2979 Non-Significant lnGDP does not Granger Cause lnEXR 2.9714 0.0895* Significant
lnEXR does not Granger Cause lnTOUR 3.1419 0.0796* Significant
Figure 1. The rolling regression for TLGH.
tourism and economic growth in Vietnam over the period of 1995-2103. The sample data have been analyzed by means of pooled OLS, a unit root test, the Johansen co-integrated test, and the Granger causality test. The results have shown that the TLGH is confirmed in the case of Vietnam. In addition, the Johansen co-integration test re-sults have shown that the GDP growth rate, real exchange rate and number of tourist arrivals are co-integrated in Vietnam over the sample period. These results have confirmed the findings of H.M.T. Nguyen, H.C.D. Nguyen, and T.D. Nguyen [9] based on a narrower perspective of the hotel and restaurant sector that the TLGH is valid for Vietnam. Importantly, the present study has not only confirmed the validity of the TLGH in Vietnam, but has also established its stability over a ten-year period.
The present findings are of significant importance to policy makers in Vietnam since they show that the tour-ism industry is a major driver of economic growth. As such, the Vietnam government should actively promote the tourism sector through the adoption of vigorous investment and development policies and should formulate and promulgate policies and practices aimed at promoting Vietnam as a tourism destination throughout the world. Tourism has a relatively short history in Vietnam. However, the recent growth in tourist arrivals indicates that there is a huge potential for development in the tourism business. Overall, the present results show that the tourism industry has been instrumental in driving economic growth in Vietnam in recent years, and given suita-ble investment and development policies, it may be reasonably expected to continue to do so in the coming years and decades.
References
[1] Haley, U.C. and Haley, G.T. (1997) When the Tourists Flew in: Strategic Implications of Foreign Direct Investment in Vietnam’s Tourism Industry. Management Decision, 35, 595-604. http://dx.doi.org/10.1108/00251749710176091
[2] Shan, J. and Wilson, K. (2001) Causality between Trade and Tourism: Empirical Evidence from China. Applied
Eco-nomics Letters, 8, 279-283. http://dx.doi.org/10.1080/135048501750104114
[3] Honey, M. and Gilpin, R. (2010) Tourism in the Developing World: Promoting Peace and Reducing Poverty. Special Report, United States Institute of Peace, Washington DC.
[4] Bennett, J., Hitchcock, M., King, V.T. and Parnwell, M. (2009) The Development of Private Tourism Business Activi-ty in the Transitional Vietnamese Economy. Tourism in Southeast Asia: Challenges and New Directions, 146-164. [5] Kim, H.J. and Chen, M.H. (2006) Tourism Expansion and Economic Development: The Case of Taiwan. Tourism
Management, 27, 925-933. http://dx.doi.org/10.1016/j.tourman.2005.05.011
[6] Balaguer, J. and Cantavella-Jorda, M. (2002) Tourism as a Long-Run Economic Growth Factor: The Spanish Case.
Applied Economics,34, 877-884. http://dx.doi.org/10.1080/00036840110058923
[7] Massidda, C. and Etzo, I. (2012) The Determinants of Italian Domestic Tourism: A Panel Data Analysis. Tourism
[8] Oh, C.O. (2005) The Contribution of Tourism Development to Economic Growth in the Korean Economy. Tourism
Management, 26, 39-44. http://dx.doi.org/10.1016/j.tourman.2003.09.014
[9] Nguyen, H.M.T., Nguyen, H.C.D. and Nguyen, T.D. (2014) Research Note: Empirical Assessment of the Tourism-Led Growth Hypothesis: The Case of Vietnam. Tourism Economics, 20, 885-892. http://dx.doi.org/10.5367/te.2013.0307
[10] Ridderstaat, J., Croes, R. and Nijkamp, P. (2014) Tourism and Long-Run Economic Growth in Aruba. International
Journal of Tourism Research, 16, 472-487. http://dx.doi.org/10.1002/jtr.1941
[11] Katircioğlu, S. (2010) Research Note: Testing the Tourism-Led Growth Hypothesis for Singapore—An Empirical In-vestigation from Bounds Test to Cointegration and Granger Causality Tests. Tourism Economics, 16, 1095-1101.
http://dx.doi.org/10.5367/te.2010.0012
[12] Tang, C.F. (2011) Is the Tourism-Led Growth Hypothesis Valid for Malaysia? A View from Disaggregated Tourism Markets. International Journal of Tourism Research, 13, 97-101. http://dx.doi.org/10.1002/jtr.807
[13] Lean, H.H. and Tang, C.F. (2010) Is the Tourism-Led Growth Hypothesis Stable for Malaysia? A Note. International
Journal of Tourism Research, 12, 375-378. http://dx.doi.org/10.1002/jtr.759
[14] Lee, C.C. and Chien, M.S. (2008) Structural Breaks, Tourism Development, and Economic Growth: Evidence from Taiwan. Mathematics and Computers in Simulation, 77, 358-368. http://dx.doi.org/10.1016/j.matcom.2007.03.004
[15] Kasimati, E. (2011) Economic Impact of Tourism on Greece’s Economy: Cointegration and Causality Analysis.
Inter-national Research Journal of Finance and Economics, 79, 79-85.
[16] Adamou, A. and Clerides, S. (2009) Prospects and Limits of Tourism-Led Growth: The International Evidence. The Rimini Centre for Economic Analysis WP 41-09. http://dx.doi.org/10.2139/ssrn.1495747
[17] Katircioglu, S.T. (2009) Revisiting the Tourism-Led-Growth Hypothesis for Turkey Using the Bounds Test and Jo-hansen Approach for Cointegration. Tourism Management, 30, 17-20. http://dx.doi.org/10.1016/j.tourman.2008.04.004
[18] Lee, C.C. and Chang, C.P. (2008) Tourism Development and Economic Growth: A Closer Look at Panels. Tourism
Management, 29, 180-192. http://dx.doi.org/10.1016/j.tourman.2007.02.013
[19] Fayissa, B., Nsiah, C. and Tadasse, B. (2008) Impact of Tourism on Economic Growth and Development in Africa.
Tourism Economics, 14, 807-818. http://dx.doi.org/10.5367/000000008786440229
[20] Sadi, M.A. and Henderson, J.C. (2001) Tourism and Foreign Direct Investment in Vietnam. International Journal of
Hospitality & Tourism Administration, 2, 67-90. http://dx.doi.org/10.1300/J149v02n01_04
[21] Makochekanwa, A. (2013) An Analysis of Tourism Contribution to Economic Growth in SADC Countries. Botswana
Journal of Economics, 11, 42-56.
[22] Dickey, D.A. and Fuller, W.A. (1981) Likelihood Ratio Statistics for Autoregressive Time Series with a Unit Root.
Econometrica, 49, 1057-1072. http://dx.doi.org/10.2307/1912517
[23] Engle, R.F. and Granger, C.W. (1987) Co-Integration and Error Correction: Representation, Estimation, and Testing.
Econometrica, 55, 251-276. http://dx.doi.org/10.2307/1913236
[24] Schubert, S.F., Brida, J.G. and Risso, W.A. (2011) The Impacts of International Tourism Demand on Economic Growth of Small Economies Dependent on Tourism. Tourism Management, 32, 377-385.
http://dx.doi.org/10.1016/j.tourman.2010.03.007
[25] Phillips, P.C. (1987) Time Series Regression with a Unit Root. Econometrica, 55, 277-301.