Optimization of Multistage Depressed Collectors
Tushar K. Ghosh,
Member, IEEE
, and Richard G. Carter,
Senior Member, IEEE
Abstract—Random walk and genetic algorithm techniques have been implemented in a 3-D collector simulation code to automate the design optimization of multistage depressed collectors. An axisymmetric four-stage collector and an asymmetric two-stage collector have been optimized following both approaches. Proce-dures for the implementation of these methods in any suitable code and simulated performance of the collectors are demonstrated. The results show significant improvement in the collector perfor-mances due to optimization. A comparison between the optimum collector performances that were obtained using these methods has also been carried out.
Index Terms—Genetic algorithms, multistage collector, opti-mization methods, random walk.
I. INTRODUCTION
T
HE MULTISTAGE collector is a critical component of vacuum microwave and millimeter-wave devices where efficiency is an important parameter, such as traveling-wave tube amplifiers in spaceborne and airborne applications, gy-rotrons in plasma applications, and klystrons and inductive out-put tubes in television transmissions. Therefore, optimization of multistage collector performance is essential to maximize recovered power from spent electron beam. Since the inception of modern multistage collectors, different techniques have been adopted to achieve maximum collector and overall efficiencies [1]–[4]. Secondary electrons play a determining role in collec-tor performance. Fabrication of electrodes with materials of low secondary electron emission coefficient reduces the effect of secondaries [5]–[8]. A transverse magnetic field may be applied in the collector region to reduce backstreaming of reflected primary and secondary electrons. Sometimes, introduction of asymmetry in the geometry may be useful to recapture the secondary electrons [9], [10]. Another way of improving mul-tistage collector performance is shaping of the electric and magnetic fields inside the collector in such a way that the electrons land on the electrodes perpendicularly. This reduces their transverse energy and, hence, loss in the form of heat. However, little has been published on methods of choosing the geometry of the collector electrodes to optimize the collector performance. It is not very efficient to optimize the collector performance manually as many geometrical parameters, e.g., angle, inner diameter, outer diameter, and thickness of eachManuscript received February 21, 2007; revised May 2, 2007. The work of T. K. Ghosh was supported in part by the Association of Commonwealth Universities, U.K., in the form of a Commonwealth Scholarship in the Ph.D. program and in part by the IEEE Electron Devices Society in the form of an IEEE-EDS Graduate Student Fellowship Award in 2001. The review of this paper was arranged by Editor W. Menninger.
T. K. Ghosh is with the Helix Engineering, e2v technologies, Chelmsford CM1 2QU, U.K. (e-mail: tushar.ghosh@e2v.com).
R. G. Carter, is with the Department of Engineering, Lancaster University, Lancaster LA1 4YR, U.K. (e-mail: r.carter@lancaster.ac.uk).
Digital Object Identifier 10.1109/TED.2007.900003
electrode and the spacing between the electrodes, need to be considered. Instead, a search algorithm can be used to find the collector geometry for optimum performance. Different tech-niques such as random walk, genetic algorithm, and simulated annealing have been tried in the past to automate the design process. The simulated annealing technique was implemented in two dimensions to optimize the geometry of an axisymmetric collector, but the feasibility of its fabrication was not consid-ered [11]. Optimization of multistage collector geometry using random walk and genetic algorithm was first demonstrated by the authors [12], [13]. The implementation of these techniques in a 3-D collector simulation code and the simulated perfor-mance of optimized axisymmetric and asymmetric collectors are presented here. Any electrostatic code with the capability of simulating the electron trajectories can be used as a basis for implementing these techniques for automated optimization.
II. DEVELOPMENT OF3-D PACKAGE
The mainframe version of Lancaster KOBRA,1 which was developed earlier in a European Space Research and Technol-ogy Centre sponsored project [14], was used as a basis for the implementation of both random walk and genetic algorithms. Due to the automated nature of the algorithm, it was necessary to make some changes in the package as well as in its preproces-sor and postprocespreproces-sor [13].
The option to input the geometry, the mesh information, the electrode potentials, and the boundary conditions through a data file has been created, which helps in changing the shape and size of any electrode easily due to parameterization. To generate the starting conditions of the electron trajectories, the parameters of the spent electron beam, i.e., position and velocity components, have been generated using a large-signal model. An interface with a 2.5-D model SUNRAY-3D [15] has been introduced to convert the initial conditions of the electron trajectories into a 3-D format.
To implement the optimization algorithms, it is necessary to combine the geometry generator, the Poisson solver, the trajectory solver, the preprocessor, the postprocessor, and the optimization codes. The present version of the package runs in the UNIX operating system in a batch mode, and it terminates once the user-specified iteration number is reached or the target collector efficiency is achieved. For each iteration, the simulation time for any collector geometry with 750 000 nodes was nearly 15 min in a 2.8-GHz personal computer with a 2-GB random access memory. After each cycle, the collector geom-etry is stored in a parameterized form along with its analysis report. This makes it possible to analyze the history of the
1KOBRA is distributed by INP-DME, 65205 Wiesbaden, Germany.
Fig. 1. Flow diagram of the package incorporating random walk algorithm.
changes being made in the collector geometry and their impact on its performance during the optimization process. The collec-tor geometry corresponding to the best efficiency achieved so far is stored in a separate file, which can be retrieved in case of intentional or accidental stopping during execution.
III. OPTIMIZATIONUSINGRANDOMWALKMETHOD
The simplest random walk algorithm starts from a point, follows a random path, and looks for the object function values at different points in a finite search space considering only one point at a time. Several variations of the algorithm are possible depending on the application to a specific problem [16], [17]. This algorithm is most effective in cases where the search space and the number of possibilities are small.
A. How It Works
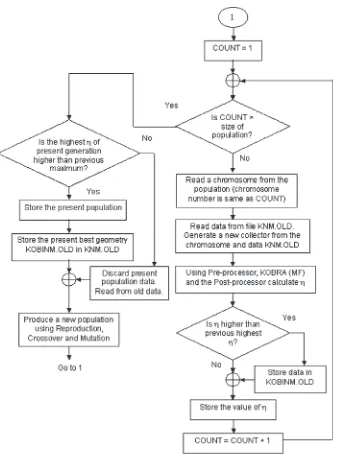
A basic flowchart for the design optimization package using random walk approach is shown in Fig. 1. The preprocessor uses the geometry and trajectory data to generate a suitable input file for the simulator. The postprocessor computes the efficiency of the collector, which acts as the object function value. If after any iteration the performance is better than the best value achieved so far, then the search operation starts again from this point; otherwise, it starts from the previous best geometry. The decision to choose the point of the next computation is made by the random walk algorithm. After several iterations, if no improvement in collector performance is observed, the user may start the optimization process again from the initial starting point along a different path. Otherwise, the whole process will continue until the number of iterations specified by the user.
A clear advantage of this technique over enumerative methods is that all dimensions of the collector electrodes are changed simultaneously. The detailed flowchart of the random walk section is shown in Fig. 2.
[image:2.594.338.529.67.305.2]Fig. 2. Detailed flowchart for the random walk section.
Fig. 3. Different dimensions of an electrode of a three-stage collector.
B. How to Create a New Geometry
[image:2.594.322.539.338.533.2]depending on the shape of an electrode. The complexity of the problem can be understood from the number of dimensions to be changed for a four-stage or a five-stage collector.
Precautions are taken while changing the dimensions of the electrodes.
1) Gap between the electrodes: In multistage collectors, it is common to have an electrode that lies inside the previous electrode (in the direction of the interaction circuit). A minimum value for g2 ensures a sufficient gap between the high-voltage electrodes to avoid sparking, and a maximum limit on the gap prevents the electrons from hitting the high-voltage insulators.
2) Outer radius: The maximum value of the outer radius depends on the inner radius and electrode thickness. 3) Inner radius: In the case of a cylindrical electrode, the
inner radius (d1) should be large enough to maintain a reasonable gap (g1) between the electrodes.
4) Beam hole radius:This dimension should be higher than the beam radius to accommodate the expanded beam. The spent beam electrons must not be allowed to strike the front face of the electrode (surface toward the interac-tion circuit). Otherwise, the secondaries and the reflected primaries generated here see an accelerating field, which causes them to stream back toward the interaction circuit. 5) Thickness of the electrodes: The minimum electrode
thickness should be fixed at a practical value.
6) Angle of inclination:The minimum and maximum are set at some practical values.
Other than the aforementioned parameters, several other parameters, such as the length of different parts of an electrode and the angles of the two end planes of the electrodes, may also be changed. The change in the angles of the planes is necessary for the optimization of asymmetric tilted electric field (TEF) collectors. However, for symmetric collectors, these angles are always kept fixed at 90◦to the axis.
IV. RESULTS ANDVALIDATION OF THEPACKAGE
IMPLEMENTINGRANDOMWALKALGORITHM
The random walk algorithm has been tested by optimizing the design of a four-stage axisymmetric collector and a two-stage asymmetric collector. After several trials, it was observed that the present package was capable of achieving a significant improvement in the efficiency for both the collectors.
A. Axisymmetric Collector
In Table I, the efficiencies of a four-stage axisymmetric col-lector for different trials are shown, where the initial colcol-lector geometry is the same in all cases. Only the results of the best four trials are shown in the table. For the initial geometry shown in Fig. 4, the collector efficiency is 70%, considering only primary electrons. The best collector efficiency in each case is shown after every 50 iterations. The amount of change in the dimensions of the collector electrodes is random in any trial in each run. For this reason, the intermediate steps are different, and the difference between the optimized efficiencies for all four cases is evident. The best efficiency among all these trials
TABLE I
[image:3.594.304.548.379.473.2]OPTIMIZEDCOLLECTOREFFICIENCIES FORDIFFERENTTRIALS (FOUR-STAGEAXISYMMETRICCOLLECTOR)
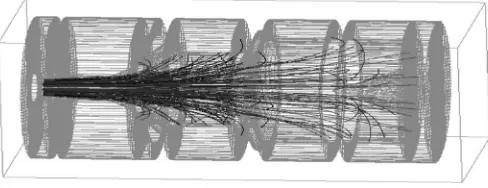
Fig. 4. Initial geometry of the four-stage collector with 70% efficiency.
Fig. 5. Final geometry of the four-stage collector with 89.2% efficiency.
is 89.2%. The improvement in the collector efficiency is more than 19 percentage points for the optimized geometry shown in Fig. 5. A careful look at the initial geometry shows that some of the trajectories are coming out through the gap between the electrodes and may therefore hit the high-voltage insulators and damage them. However, due to the optimization of the gap length between the electrodes, this phenomenon is missing in the optimized collector. If the number of trials is increased, then the efficiency may be increased further by a small amount.
B. Asymmetric Collector
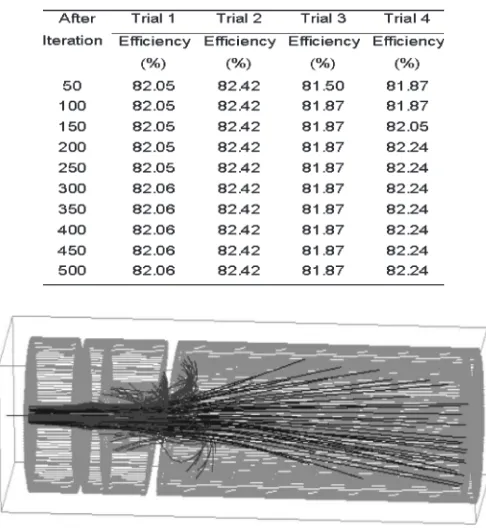
TABLE II
[image:4.594.46.289.98.362.2]OPTIMIZEDCOLLECTOREFFICIENCIES FORDIFFERENTTRIALS (TWO-STAGETEF COLLECTOR)
[image:4.594.52.287.99.367.2]Fig. 6. Initial geometry of the two-stage TEF collector with 79% efficiency.
Fig. 7. Final geometry of the two-stage TEF collector with 82% efficiency.
V. OPTIMIZATIONUSING AGENETICALGORITHM
The random walk method has major limitations, such as the possibility of being trapped at a local maximum and the requirement of a large number of trials to find the optimized geometry. These can be overcome by a more efficient technique, namely the genetic algorithm [18]–[21]. This method is based on natural phenomena and the theory of the survival of the fittest. It generates a new set of data through natural selection and genetics through random choice.
A. Implementation of the Genetic Algorithm
A basic flowchart for the automated optimization process implementing the genetic algorithm is similar to Fig. 1 except that the genetic algorithm replaces the random walk algorithm. However, this method is more complicated than the random walk approach, and it is also more difficult to implement.
The detailed flow diagram of the genetic algorithm process is shown in Fig. 8. The sequence of events implementing the
ge-netic algorithm is described in six steps for better understanding of the procedure.
1) From previous experience or by scaling an existing col-lector, a new geometry is created as a preliminary design. 2) Using a nonrepetitive random number generator, a popu-lation of chromosomes (a string of binary digits) of equal length is created in such a way that no two members in the population are the same. A brief description on how to choose the size of the population and the length of the chromosome is given in the next section.
3) A set of collectors is produced using the chromosomes and the basic geometry. For each collector, the simulator is run until a converged solution is achieved.
4) The efficiency of each collector, which is calculated using the postprocessor, is then used as the object function, or fitness value, for the corresponding chromosome. A new population of collectors is generated from the existing population through the three main operators: 1) reproduc-tion; 2) crossover; and 3) mutation. These three operators are discussed in detail in a later section.
5) The function of the genetic algorithm for this generation is complete, and the process is repeated for the next generation of collectors. The best collector geometry, corresponding to the best efficiency achieved in each generation, is used as the basic geometry for the next generation.
6) Steps 3–5 are repeated until the number of generations (specified by the user) is reached. If in any generation the best efficiency is not better than the previous best, then the total population is discarded, and a new population is created from the previous population.
B. How to Create a New Geometry
To introduce diversity in the optimization procedure, the search is started from a large population; i.e., a large number of geometries are created that covers many points in the search space for a possible solution. This also provides a large number of alternative paths toward optimization.
With a chromosome length of 10, there are 210=
1024 points in the search space. The larger the length of the chromosome, the larger the number of points it covers in the search space. In the present problem, each binary bit of a chro-mosome corresponds to a simple electrode, which makes the chromosome length same as the number of simple electrodes. It is worth mentioning here that in the present simulation package, the number of electrodes is not the same as the number of collector stages as the complex electrode geometry is created by combining predefined simple electrodes, as shown in Fig. 9. It is also possible to associate each binary bit with a dimension of an electrode. In that case, the chromosome length will be large.
Fig. 8. Flow diagram of the genetic algorithm section.ηdenotes the collector efficiency; KNM.OLD stores the best collector geometry data achieved until that generation; KOBINM.OLD stores the best geometry data of the collector in any particular generation, and it is generated by the algorithm using the chromosome and the data file KNM.OLD.
Fig. 9. Electrode shapes. (a) Funnel. (b) Cylinder. (c) Complex shape formed by combining funnel and cylinder.
C. Reproduction, Crossover, and Mutation
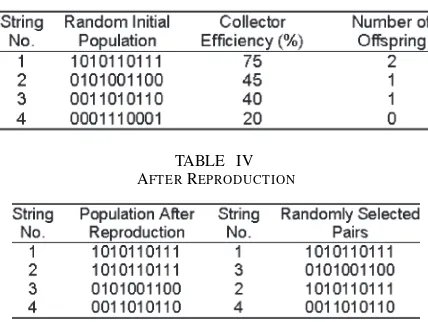
An example of the three basic operators (reproduction, crossover, and mutation) to create a new population is pre-sented here. A typical randomly generated population is shown in the second column of Table III, where the size of the
[image:5.594.144.444.566.668.2]TABLE III
[image:6.594.60.274.89.250.2]TYPICALREPRODUCTIONPROCESS
TABLE IV AFTERREPRODUCTION
In the reproduction process, the number of offspring of a collector is produced with a probability proportional to its efficiency. The number of offspring generated corresponding to each collector is shown in the fourth column. In the first line, the number of offspring is two as the collector with the best effi-ciency produces the most offspring, and in the second and third lines, the number of offspring is one each, whereas the member of the population with the worst efficiency dies off. Therefore, in Table IV, the first two chromosomes are the same as the first chromosome in Table III. Similarly, the second and third chromosomes in Table III remain the same before and after reproduction. They become the third and fourth chromosomes, respectively, in Table IV. The first and second columns of this table show the new string numbers and member chromosomes, respectively. These members are then entered into the mating pool where the pair of parents is chosen randomly from the population. In this case, the first and third chromosomes make a pair, and the second and fourth chromosomes make the second pair. The new string number and the chromosomes are shown in the third and fourth columns, respectively. It is worth mention-ing that the size of the population is made a constant even num-ber delinum-berately to keep the population size constant throughout the computation. In the natural world, the population size changes, which is a complex phenomenon and difficult to implement in an optimization using a genetic algorithm. More-over, an increase in the population number after each iteration will create a huge population after only a few iterations. This will increase the computation time for each trial many fold.
The next process is crossover. In this problem, we have used a single-point crossover, and the probability of crossover is always 1. A random number between “1” and “chromosome length−1” is used as the point of crossover. All digits between “1” and “point of crossover+1” are swapped between the pair of parents to produce two children. The crossover process is shown in Table V. In the first case, the crossover point is 6. Therefore, the first 7 bits of “Parent 1” chromosome are swapped with the corresponding bits of “Parent 2” chromosome to produce “Child 1” and “Child 2” chromosomes, respectively. In a similar way, other child chromosomes are generated. These children form the new population. The old and new populations are shown in Table VI.
TABLE V CROSSOVER
TABLE VI
OLD ANDNEWPOPULATIONS(BEFORE ANDAFTERCROSSOVER)
Fig. 10. Improvement in efficiency of a four-stage axisymmetric collector versus the number of generations (the starting geometry is the same for all trials).
Mutation is carried out when all the chromosomes in a population are the same. A random number is generated between “1” and “chromosome length” that determines the position of the bit where mutation is to be done. This position is different for each chromosome.
VI. RESULTS ANDVALIDATION OF THEPACKAGE
IMPLEMENTINGGENETICALGORITHM
A package has been developed using the genetic algorithm to automate the optimization of the designs of those collectors, which were earlier used to validate the random walk technique. This package has been tested in a similar way as the random walk package. For the symmetric collector, the population size, the chromosome length, the probability of crossover, and the maximum number of generations are taken to be 8, 12, 1, and 50, respectively; in the case of the asymmetric collector, these values are 8, 6, 1, and 50, respectively.
A. Axisymmetric Collector
Fig. 11. Optimized four-stage axisymmetric collector with primary electron trajectories. Efficiency of the collector is nearly 91%.
for all trials started from the same collector geometry, and the number of collectors simulated in each generation was the same as the population number. As the initial population in the genetic algorithm is created randomly and is nonrepetitive (each time the package is executed, the initial population is different), the intermediate steps are different, although the optimized results are nearly the same. For any trial, the amount of change in a specific dimension in any intermediate step is different. A maximum and a minimum limit have been set for the amount to be changed in any dimension in a single step. Any value between these limits can be chosen randomly to make a change in that dimension of the electrode.
The geometry of the four-stage collector with the primary trajectories after optimization is shown in Fig. 11. Different aspects of fabrication and practical issues of the collector, e.g., electrode thickness and gap between the electrodes, have been taken care of while optimizing its geometry (see Fig. 3). In the present example, the efficiency of the optimized collector is nearly 91%, which is an improvement by more than 20 percentage points from the initial collector geometry. A careful look at the collector geometry in Fig. 5, which is optimized via the random walk algorithm, reveals that a few trajectories are hitting at the front face of electrode 3 and electrode 4, which could have traveled a longer path before they are collected. The energies of these electrons are not recovered fully, and this reduces the collector efficiency and may cause excessive heating. On the contrary, nearly all the primaries in Fig. 11 are collected on the backs of the electrodes. This will also help in recapturing the secondary electrons. Another comparison between the two figures shows that the length of the collector has been reduced by nearly 30%, and this has reduced both its volume and its weight. This is important for spaceborne and airborne applications.
B. Asymmetric Collector
[image:7.594.39.290.71.163.2]To further check the suitability of the genetic algorithm, the two-stage asymmetric collector was optimized. After a number of trials, it was observed that the optimized collector efficiency is 84% for nearly all the trials. The best collector efficiency at intermediate steps for four different trials is plotted in Fig. 12. As in the previous example, the starting geometry is the same in all four cases. The geometry of the two-stage asymmetric collector after optimization is shown in Fig. 13. The improvement in collector efficiency is about 5 percentage points.
Fig. 12. Improvement in efficiency for a two-stage asymmetric collector versus the number of generations (the starting geometry is the same for all trials).
Fig. 13. Optimized two-stage asymmetric collector with primary electron trajectories. Efficiency of the collector is nearly 84%.
Fig. 14. Best collector efficiency for each trial showing the repeatability of the results. The curves with dotted lines are the random walk method, and the solid lines are the genetic algorithm.
VII. COMPARISON
The performance of the random walk algorithm is compared with the genetic algorithm on the basis of the simulated results of both symmetric and asymmetric collectors. The advantages and disadvantages in terms of consistency, computational time, accuracy, and implementation are discussed in detail.
A. Consistency
[image:7.594.302.549.257.362.2] [image:7.594.307.545.403.549.2]remains nearly the same across all trials, whereas the random walk method is less consistent, although only the best four trials are considered.
B. Computational Time
The total number of simulations carried out for both collec-tors in each trial using the genetic algorithm is 400 (50 gen-erations with eight collector simulations per generation). For the four-stage symmetric collector, the computational time for each trial is about 100 h, whereas for the two-stage asymmetric collector, the computational time is about 60 h. In the case of the random walk method, the times for each trial are 125 and 75 h for the four-stage symmetric and two-stage asymmetric collectors, respectively. In the latter case, only the best four trials are considered for comparison purposes. If, however, the total central processing unit time includes the time for all trials (not just the best four), then the average time for a successful trial using the random walk method will be much higher.
C. Accuracy
It is observed from Fig. 14 that the optimized performance of the best four trials using the random walk method is sometimes close to what is achieved using the genetic algorithm. More trials may be able to improve the performance of the collectors; however, this will increase the computational time.
D. Implementation
The advantage of the random walk method is its simplicity in implementation. However, there is always a possibility of the search being trapped in a local maximum due to the random nature of the algorithm. This can be overcome by changing both the starting point and the search path at different trials. In the example of the four-stage axisymmetric collector, the search is trapped in a local maximum after 100 iterations in trial 1 (see Table I). A better optimization is achieved by changing the path of the optimization in trial 3. Considering several other intermediate trials for which the method failed, it can be said that a large number of trials are necessary to achieve the optimized geometry.
On the contrary, the genetic algorithm employs a multidirec-tional search. It uses the geometry and performance information along with the search path from the chromosomes of each generation to create the population of a new generation through the natural evolution process. This makes the genetic algorithm more effective than the random walk method. For complex problems where both the number of variables and the search space are large, the genetic algorithm is the best choice if it is used efficiently. Previous experience in design and simulation of collectors may be helpful in implementing this algorithm for optimization purposes. Variations of this algorithm may be tried to reduce the time taken to solve complex problems. Each time it is executed, the genetic algorithm follows a different path toward the optimization, as the intermediate steps are different and the starting population is generated randomly, but the final outcome in each case is nearly the same. The repeatability
feature of the genetic algorithm makes it a better choice over the random walk method.
VIII. CONCLUSION
Genetic algorithm and random walk methods have been implemented using a 3-D collector simulator for the optimiza-tion of both axisymmetric and asymmetric collectors. These techniques can be implemented using any similar suitable code. The optimized performances of the best four trials using the random walk algorithm have been presented. A large number of trials are required to achieve the optimized geometry using this algorithm. On the other hand, repeatability of the results was achieved in all the trials of the genetic algorithm. To reduce the total computation time, the optimization of both of these collectors has been carried out without including the secondary electrons. If the effect of secondaries is included, then the efficiency is expected to be reduced by a few percent depending on the material used for the collector electrodes.
ACKNOWLEDGMENT
The authors would like to thank Dr. W. L. Menninger, L-3 Communications Electron Technologies, Inc., for his valuable suggestions to improve this paper; INP-DME for granting per-mission to use KOBRA3 for this research; and the Head of the Department of Engineering, Lancaster University, for providing facilities to carry out this work. One author, T K. Ghosh, would like to thank the Director of the Central Electronics Engineering Research Institute, Pilani, India, for providing leave and support during the project and e2v technologies, U.K., for their support during the preparation of this paper.
REFERENCES
[1] H. G. Kosmahl,A novel axi-symmetric electrostatic collector for linear beam microwave tubes, 1971. NASA Tech. Note TN D-6093.
[2] W. Neugebauer and T. Mihran, “A ten stage depressed collector for im-proving klystron efficiency,”IEEE Trans. Electron Devices, vol. ED-19, no. 1, pp. 111–121, Jan. 1972.
[3] H. G. Kosmahl, “Modern multistage depressed collectors—A review,” IEEE Trans. Electron Devices, vol. ED-70, no. 11, pp. 1325–1334, Nov. 1982.
[4] A. C. Schram, “TWT efficiency improvement using multi-stage collec-tors,”Microw. J., vol. 18, no. 5, pp. 31–33, Aug. 1975.
[5] R. Forman, “Secondary-electron-emission properties of conducting sur-faces with application to multistage depressed collectors for microwave amplifiers,” NASA, Washington, DC, NASA TP-1097, 1977.
[6] A. N. Curren and K. A. Jansen, “Secondary electron emission character-istics of ion-textured copper and high-purity isotropic graphite surfaces,” NASA, Washington, DC, NASA TP-2342, 1984.
[7] A. N. Curren, “Carbon and carbon-coated electrodes for multistage de-pressed collectors for electron-beam devices—A technology review,” IEEE Trans. Electron Devices, vol. ED-33, no. 11, pp. 1902–1913, Nov. 1986.
[8] P. Ramins and B. T. Ebihara, “Improvement in MDC and TWT overall efficiency through the application of carbon electrode surfaces,”IEEE Trans. Electron Devices, vol. ED-33, no. 11, pp. 1915–1924, Nov. 1986. [9] T. Okoshi, E. Chiu, and S. Matsuki, “The tilted electric field soft-landing
collector and its application to a travelling-wave tube,”IEEE Trans. Elec-tron Devices, vol. ED-19, no. 1, pp. 104–110, Jan. 1972.
[10] J. R. Hechtel, “A novel electrostatic-focusing depressed collector for linear beam tubes,”IEEE Trans. Electron Devices, vol. ED-24, no. 1, pp. 45–52, Jan. 1977.
[12] T. K. Ghosh and R. G. Carter, “Design optimisation of multistage de-pressed collectors for high efficiency travelling wave tubes using genetic algorithm,” inProc. 3rd IEEE Int. Vac. Electron. Conf., Apr. 23–25, 2002, pp. 158–159.
[13] T. K. Ghosh, “Three dimensional modeling and optimization of multistage depressed collectors,” Ph.D. dissertation, Dept. Eng., Lancaster Univ., Lancaster, U.K., 2002.
[14] L. Kumar, P. Spadtke, R. G. Carter, and D. Perring, “Three-dimensional simulation of multistage depressed collectors on micro-computers,”IEEE Trans. Electron Devices, vol. 42, no. 9, pp. 1663–1673, Sep. 1995. [15] V. Srivastava and R. G. Carter, “Improved 2.5-dimensional large signal
model for helix TWTs & its application for stability analysis,” Univ. Lancaster, Lancaster, U.K., Report MRG/98/1, Feb. 1998.
[16] M. N. Barber and B. W. Ninham,Random and Restricted Walks:Theory and Applications. New York: Gordon and Breach, Jun. 1970.
[17] F. Spitzer, Principles of Random Walk. New York: Springer-Verlag, Jan. 1976.
[18] Z. Michalewicz, Genetic Algorithm + Data Structure=Evolution Programs. Berlin, Germany: Springer-Verlag, 1992, pp. 107–139. [19] D. E. Goldberg,Genetic Algorithms in Search, Optimization, and Machine
Learning. Reading, MA: Addison-Wesley, 1989, pp. 70–110. [20] L. Davis,Handbook of Genetic Algorithms. New York: Van Nostrand,
1991, pp. 60–100.
[21] L. Davis,Genetic Algorithms and Simulated Annealing. London, U.K.: Pitman, 1990, pp. 111–136.
Tushar K. Ghosh(S’99–M’00) received the B.E. degree in electronics and telecommunication engi-neering from Bengal Engiengi-neering College, Howrah, India, in 1990, the M.E. degree in electronics and telecommunication engineering from Jadavpur Uni-versity, Kolkata, India, in 1993, and the Ph.D. degree in engineering from Lancaster University, Lancaster, U.K., in 2002, for his work on 3-D modeling and optimization of multistage collectors.
From 1993 to 1994, he worked on electromag-netic pulse sensors as a Senior Research Fellow at Jadavpur University. In 1994, he joined the Central Electronics Engineering Research Institute (CEERI), Pilani, India, as a Project Scientist and was a Scientist from 1995 to 2004. During this period, he was a key member of the C-band and Ku-band space TWT project teams, where he was involved in the design and development activities. He has developed a number of computer codes implementing advanced optimization techniques, which are presently being used at CEERI for the design purpose. He joined e2v technologies, Chelmsford, U.K., in 2004 as a Principal Engineer, where he is currently involved in improving the design and modeling techniques of TWTs. He has authored or coauthored a number of papers published in international journals and conference proceedings. His primary interests are in vacuum device physics, modeling, and design.
Dr. Ghosh was awarded the Commonwealth Scholarship from 1999 to 2002. He was one of the first three recipients of the IEEE-EDS Graduate Student Fellowship Award in 2001.
Richard G. Carter (M’97–SM’01) received the B.S. degree in physics from the University of Cambridge, Cambridge, U.K., in 1965 and the Ph.D. degree in electronic engineering from the University of Wales, Cardiff, U.K., in 1968, for his work on the propagation of waves on neutralized ion beams.
From 1968 to 1972, he worked on high-power traveling-wave tubes as a Development Engineer at English Electric Valve Co., Ltd. He joined the Department of Engineering, University of Lancaster, Lancaster, U.K., as a Lecturer in 1972 and was promoted to Senior Lecturer in 1986 and Professor of electronic engineering in 1996. His research interests include electromagnetics and microwave engi-neering, with particular reference to the theory, design, and computer modeling of microwave tubes and particle accelerators.