Published Online February 2014 (http://www.scirp.org/journal/aim) http://dx.doi.org/10.4236/aim.2014.43019
The Optimization of Aspergillus sp. GM4 Tannase
Production under Submerged Fermentation
Alessandra Gonçalves de Melo
1, Rayssa Cristina Faria Pedroso
1, Luis Henrique Souza Guimarães
2,
José Guilherme Lembi Ferreira Alves
3, Eustáquio Souza Dias
1, Mário Lúcio Vilela de Resende
4,
Patrícia Gomes Cardoso
1*1
Department of Biology, Sector of Microbiology, Federal University of Lavras, Lavras, Brazil
2
Department of Biology, University of São Paulo, Ribeirão Preto, Brazil
3
Department of Food Science, Federal University of Lavras, Lavras, Brazil
4
Department of Phytopathology, Federal University of Lavras, Lavras, Brazil Email: *patricia@dbi.ufla.br
Received December 17, 2013; revised January 17, 2014; accepted January 25, 2014
Copyright © 2014 Alessandra Gonçalves de Melo et al. This is an open access article distributed under the Creative Commons At- tribution License, which permits unrestricted use, distribution, and reproduction in any medium, provided the original work is prop- erly cited. In accordance of the Creative Commons Attribution License all Copyrights © 2014 are reserved for SCIRP and the owner of the intellectual property Alessandra Gonçalves de Melo et al. All Copyright © 2014 are guarded by law and by SCIRP as a guard- ian.
ABSTRACT
Tannase is a hydrolytic enzyme that is involved in the biodegradation of tannins and it has biotechnological po-tential in the pharmaceutical, chemical, food and beverage industries. Microorganisms, especially filamentous fungi, are important tannase producers. The aims of this work were to find a potential tannase producer and to improve the cultivation conditions. Three Aspergillus species (A. japonicus 246A, A. tamarii 3 and Aspergillus sp. GM4) were investigated in different culture media (Adams, Czapeck, Khanna, M5 and Vogel) and inducers (1% and 2% tannic acid; 1% green tea; 1% methyl gallate; 1% gallic acid). Aspergillus sp. GM4 and Adams medium were selected. The tannase production by Aspergillus sp. GM4 in Adams medium was induced in the presence of 2% (w/v) tannic acid and gallic acid as carbon sources, while green tea was not able to induce tannase produc-tion. The Plackett-Burman screening design was performed with the variables MgSO4, KH2PO4, yeast extract,
tannic acid, agitation rate and salt solution. The variables MgSO4 and agitation rate were selected for the
opti-mization of tannase production using a Central Composite Rotatable Design. Under optimized conditions, a 2.66-fold increase in the enzyme production was observed with small modifications in the medium composition.
KEYWORDS
Aspergillus sp.; Response Surface Methodology; Submerged Fermentation; Tannase; Tannic Acid
1. Introduction
Tannase (EC 3.1.1.20) is a hydrolytic enzyme involved in the biodegradation of tannins. This enzyme catalyzes the hydrolysis of the ester and depside bonds present in hydrolysable tannins, releasing gallic acid and glucose [1]. Tannase also has many applications in food, bev- erage, pharmaceutical and chemical industries, and even in bioremediation [2,3]. Industrial bioconversion of tan- nic acid is generally accomplished by tannase for the production of gallic acid, which is mostly used in the pharmaceutical industry to produce the anti-bacterial
drug Trimethoprim [4]. Gallic acid is also an important substrate for the synthesis of propyl gallate, an antioxi- dant used in the food industry [1].
Microorganisms can continuously produce tannase in large quantities, resulting in an increased yield with the establishment of optimized fermentation methods. Tan- nase is produced in the presence of tannic acid by several filamentous fungi, mainly Aspergillus and Penicillium
species [4]. Industrial production of microbial tannase is obtained by submerged culture because this simplifies sterilization and process control [5]. Studies evaluating the cultivation of tannase-producing strains are important for choosing strains and enzymes with desirable charac-
teristics for industrial applications. The optimization of enzyme production is an important step that can be per- formed by individually optimizing each parameter (tem- perature, cultivation time and pH, among others), as has been done for Aspergillus flavus tannase production [6], or by using the factorial design methodology, as has been done for Bacillus massiliensis tannase production [7]. This article describes the optimization of tannase produc- tion under submerged fermentation by Aspergillus sp. GM4, a new strain producer, using the Response Surface Methodology (RSM).
2. Material and Methods
2.1. The Selection of the Microorganism and
Culture Medium
Three Aspergillus species (A. japonicus 246A, A. tamarii
3 and Aspergillus sp. GM4) belonging to the culture col- lection of the Laboratory of Prospection and Genetics of Fungi (Department of Biology, Federal University of Lavras, Lavras, MG, Brazil) were previously selected due to their ability to produce tannase in tannic acid agar. The submerged fermentations for tannase production were conducted using 25 mL of Khanna [8], Czapeck [9], M5 [10], Adams [11] or Vogel [12] media in 125 mL Erlenmeyer flasks containing 2% (w/v) tannic acid as the main carbon source, pH 6.0. The media were previously autoclaved at 120˚C and 1.5 atm for 20 min and were inoculated with a spore suspension at 1 × 10⁵ conidia/mL of medium. Erlenmeyer flasks containing the media were incubated at 30˚C for 72 h on a rotary shaker (100 rpm). Then, the biomass was separated by vacuum filtration through Whatman N˚ 1 filter paper, and the cell-free cul- ture broth was used to measure the extracellular tannase activity.
2.2. The Effect of the Incubation Time on
Tannase Production
A spore suspension of Aspergillus sp. GM4 (1 × 10⁵ co- nidia/mL) was inoculated in modified Adams medium (pH 6.0) with the following composition (g/L): yeast extract, 2.0; KH2PO4, 1.0; MgSO4·7H2O, 0.5; and tannic
acid, 20.0. Erlenmeyer flasks were incubated at 30˚C and 100 rpm for 24, 48, 72, 96 and 120 h. After each incuba- tion period, the culture filtrate, obtained as described above, was analyzed for tannase activity.
2.3. The Effect of Inducers on the Tannase
Activity
The fungus Aspergillus sp. GM4 was initially grown at 30˚C for 48 h (100 rpm) in the modified Adams medium containing 2% (w/v) glucose as a carbon source. Then, the mycelia mass was separated by vacuum filtration,
washed with sterilized distilled water, transferred in aseptic conditions to the modified Adams medium with the appropriate inducers (w/v) (1% and 2% tannic acid; 1% green tea; 1% methyl gallate; 1% gallic acid) and incubated at 30˚C for 48 h and 100 rpm. The mycelia mass was also transferred to a flask containing 1% (w/v) glucose and to a control flask without a carbon source. After the incubation time, the tannase activity was meas- ured, and the induction ratio was calculated by dividing the induced tannase activity by the basal tannase activity from the medium containing glucose as the sole carbon source [13].
2.4. Enzyme Assay
The tannase activity was estimated using a method de- scribed by Deschamps [14]. One unit of tannase activity was defined as the amount of enzyme required to release one µmol of gallic acid per minute under the standard assay conditions.
2.5. Protein Estimation
The protein content in the culture filtrate was estimated using the Bradford assay [15] with BSA as a standard.
2.6. Optimization Procedure and Experimental
Designs: Plackett-Burman Design, Central
Composite Rotatable Design and Response
Surface Analysis
To determine which variables significantly influence tan- nase production by Aspergillus sp. GM4 under sub- merged fermentation, a Plackett-Burman (PB) screening design was used [16,17]. Six independent variables (MgSO4·7H2O, KH2PO4, yeast extract, tannic acid, agita-
tion rate and salt solution) were investigated, and each variable was tested at low (−1) and high (+1) levels, with three more repetitions at the central point in 15 experi- mental runs (Table 1). The initial concentrations of the salts were as follows (g/L): ZnSO4·7H2O, 0.0035;
Cu-SO4·5H2O, 0.0031; MnSO4·H2O, 0.0069; FeSO4, 0.0033;
145
Central Composite Rotatable Design.
The experiments were based on a Central Composite Rotatable Design (CCRD) with the two variables se- lected by the PB design. A CCRD with a total of 11 ex- periments was adopted, and four factorial points and three central points were included to verify the curvature of the experimental region and to provide additional de- grees of freedom for error, which are important for test- ing the significance of effects [18]. The independent va-riables, their levels and real values are presented in
Ta-ble 2. In addition, four axial points (at a distance of
[image:3.595.60.538.254.504.2]±1.41 from the central point) were added to the matrix to fit this design to a second order model. The tannase ac- tivity was taken as the dependent variable (Y). The tan- nase production data were subjected to analysis of vari- ance (ANOVA) to examine the adjustment of the model, and the deviation between the predicted and observed values was calculated. The proportion of variance ex- plained by the model is given by the coefficient of de- termination (R2). The mathematical relationship between the independent and dependent variables was obtained using a second order polynomial Equation (1):
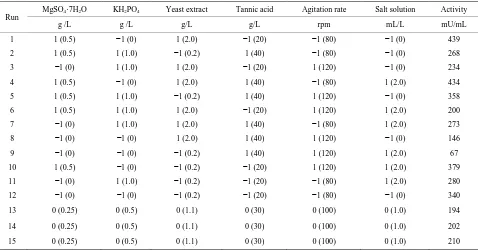
Table 1. Plackett-Burman design matrix with six independent variables containing real and coded values and tannase activity as the response.
Run MgSO4·7H2O KH2PO4 Yeast extract Tannic acid Agitation rate Salt solution Activity
g /L g /L g/L g/L rpm mL/L mU/mL
1 1 (0.5) −1 (0) 1 (2.0) −1 (20) −1 (80) −1 (0) 439
2 1 (0.5) 1 (1.0) −1 (0.2) 1 (40) −1 (80) −1 (0) 268
3 −1 (0) 1 (1.0) 1 (2.0) −1 (20) 1 (120) −1 (0) 234
4 1 (0.5) −1 (0) 1 (2.0) 1 (40) −1 (80) 1 (2.0) 434
5 1 (0.5) 1 (1.0) −1 (0.2) 1 (40) 1 (120) −1 (0) 358
6 1 (0.5) 1 (1.0) 1 (2.0) −1 (20) 1 (120) 1 (2.0) 200
7 −1 (0) 1 (1.0) 1 (2.0) 1 (40) −1 (80) 1 (2.0) 273
8 −1 (0) −1 (0) 1 (2.0) 1 (40) 1 (120) −1 (0) 146
9 −1 (0) −1 (0) −1 (0.2) 1 (40) 1 (120) 1 (2.0) 67
10 1 (0.5) −1 (0) −1 (0.2) −1 (20) 1 (120) 1 (2.0) 379
11 −1 (0) 1 (1.0) −1 (0.2) −1 (20) −1 (80) 1 (2.0) 280
12 −1 (0) −1 (0) −1 (0.2) −1 (20) −1 (80) −1 (0) 340
13 0 (0.25) 0 (0.5) 0 (1.1) 0 (30) 0 (100) 0 (1.0) 194
14 0 (0.25) 0 (0.5) 0 (1.1) 0 (30) 0 (100) 0 (1.0) 202
15 0 (0.25) 0 (0.5) 0 (1.1) 0 (30) 0 (100) 0 (1.0) 210
Table 2. The levels of the two independent variables and the central composite rotatable design for the optimization of tan-nase activity.
Run
MgSO4·7H2O (x1) Agitation rate (x2) Activity (mU/mL) Relative
g/L rpm Experimental Predicted deviation (%)
1 −1 (0.4) −1 (52) 218.59 184.09 15.78
2 1 (1.1) −1 (52) 135.88 112.32 17.34
3 −1 (0.4) 1 (108) 431.11 431.21 −0.02
4 1 (1.1) 1 (108) 394.46 359.44 8.88
5 −1.41 (0.25) 0 (80) 211.32 222.14 −5.12
6 1.41 (1.25) 0 (80) 92.02 119.62 −29.98
7 0 (0.75) −1.41 (40) 168.90 200.25 −18.56
8 0 (0.75) 1.41 (120) 538.97 553.28 −2.66
9 0 (0.75) 0 (80) 160.87 170.88 −6.22
10 0 (0.75) 0 (80) 170.42 170.88 −0.27
[image:3.595.57.541.541.736.2]2 0 i i ij i j ii i
Y =
β
+∑
β
x +∑
β
x x +∑
β
x (1) where Y is the predicted value, represented by the enzy- matic activity; β0 is the constant term; βi is the linear co-efficient; βij is the interaction coefficient; βii is the quad-
ratic coefficient; and xi and xj are the independent vari-
ables in the coded values. The significance of all terms in the polynomial function was assessed statistically using the F-value at a probability (p) of 0.05. The model was then used to generate response surfaces and contour curves to determine the optimal operating ranges of the independent variables.
3. Results
Three species of Aspergillus genera were cultured in Adams, Czapeck, Khanna, M5 and Vogel culture media. Adams medium was more favorable for enzyme produc- tion for Aspergillus japonicus 246A (19.8 U/mg) and
Aspergillus sp. GM4 (12.0 U/mg) (Table 3), followed by Khanna and Czapeck. M5 medium was not favorable for tannase production, which could have been due to the composition of the medium, with yeast extract and pep- tone as additional carbon sources. A. tamarii 3 presented a lower tannase activity compared to the other species, with a maximum production of 3.0 U/mg in Czapeck medium. Protein content of and tannase production by
Aspergillus japonicus 246A and Aspergillus sp. GM4 were very similar. Many studies have been conducted with A. japonicus for tannase production. Therefore, we selected Aspergillus sp. GM4 for optimization of tannase production culture conditions.
The potential of some substrates to induce tannase ac- tivity was measured (Table 4). The Aspergillus sp. GM4 was initially cultured in modified Adams medium con- taining 2% (w/v) glucose, and a basal tannase activity (1.29 U/mg) was observed. The mycelia mass was trans- ferred to modified Adams medium containing gallic acid, green tea, methyl gallate, tannic acid or glucose to ex- amine induction or repression by these carbon sources.
Tannase activity increased 3.25-fold when Aspergillus
sp. GM4 was grown with 2% (w/v) tannic acid compared to 1% (w/v). Methyl gallate presented a higher induction ratio than all of the other additives except 2% (w/v) tan nic acid. In the presence of green tea, Aspergillus sp. GM4 presented low tannase activity. No activity was detected after 48 h incubation in the medium containing glucose, suggesting that tannase production by Aspergil- lus sp. GM4 is substrate induced and is repressed in the presence of glucose. Aspergillus sp. GM4 produced tan- nase with gallic acid as the sole carbon source in the me- dium. This result was interesting because it suggests that the tannase production by Aspergillus sp. GM4 can con- tinue even with an increase in product content in the cul- ture medium. Adams medium containing 2% (w/v)
Table 3. Production of tannase by Aspergillus sp. GM4, A. japonicus 246A and A. tamarii 3 in different culture media.
Units Adams Czapeck Khanna M5 Vogel
A
sp
er
g
il
lu
s
s
p
.
GM
4
Tannase
activity mU/mL 202 162 149 51 60
Proteins µg/mL 17 15 15 83 17
Specific
activity U/mg 12.0 10.8 9.9 0.6 3.5
A
. j
a
p
o
ni
cu
s
2
4
6
A
Tannase
activity mU/mL 178 102 146 91 77
Proteins µg/mL 9 12 10 26 9
Specific
activity U/mg 19.8 8.5 14.6 3.5 8.6
A
. ta
m
a
rii
3
Tannase
activity mU/mL 124 85 177 71 23
Proteins µg/mL 69 28 61 40 14
Specific
[image:4.595.309.537.112.320.2]activity U/mg 1.8 3.0 2.9 1.8 1.6
Table 4. The specific enzyme activity and the induction ra-tio in the presence of different inducers.
Inducer (w/v)
Aspergillus sp. GM4
Specific activity
U/mg Induction ratio
Basal activity 1.3 1.0
1% Gallic acid 5.3 4.1
1% Green tea 1.2 0.9
1% Methyl gallate 8.8 6.8
1% Tannic acid 2.9 2.2
2% Tannic acid 9.3 7.1
tannic acid was used to cultivate Aspergillus sp. GM4 for 24, 48, 72, 96 and 120 h. The extracellular tannase activ- ity was the highest after 72 h of incubation, and the ac- tivity decreased after this period. Therefore, 72 h was fixed as the best incubation time for tannase production from Aspergillus sp. GM4.
The results of the PB design are shown in Table 1. The tannase activity varied from 67 mU/mL (run 9) to 439 mU/mL (run 1). The positive or negative effects of the independent variables MgSO4·7H2O, KH2PO4, yeast
extract, tannic acid, agitation rate and salt solution were valued and are shown in Figure 1.
Yeast extract, salt solution, KH2PO4 and tannic acid
have no statistically significant effect on tannase produc- tion (Figure 1). It was found that low concentrations of KH2PO4, tannic acid and salt solution increase tannase
production, but the effects are not significant. Further- more, the results indicate that the enzyme production by
[image:4.595.308.539.358.487.2]147
Figure 1. Pareto chart of the effects of the independent va-riables on tannase production by Aspergillus sp. GM4.
The variables MgSO4 and agitation rate have a signi-
ficant effect on tannase production (p < 0.1), and these variables were selected for the CCRD. MgSO4 has shown
a positive effect on enzyme production, indicating that an increase in this compound in the culture medium can favor enzyme production. The agitation rate showed a significant negative effect, which indicates that lower agitation levels yield higher levels of tannase production. The salt solution was not part of the initial composition of the culture medium and was removed from the me- dium for the next step to minimize the enzyme produc- tion costs.
The tannase characterization of Aspergillus sp. GM4 (data not shown) showed that the tannase activity is slightly inhibited in the presence of some metal ions (1 mM), such as K+, Zn2+, Mn2+, and Fe3+, with a greater effect for Mn2+. Although supplementing the medium with trace elements can be important for fungal growth, the presence of these metal ions may have negative ef- fects on the secreted enzyme activity. Yeast extract, KH2PO4 and tannic acid were fixed. From this point, the
medium was modified to the following composition (g/L): tannic acid, 20.0; KH2PO4, 0.5 and yeast extract, 1.0. The
pH was adjusted to 6.0, and the medium was incubated at 30˚C. The MgSO4 concentration and the agitation rate
were studied. The CCRD matrix containing the assays and the predicted and observed results for each assay are presented in Table 2.
The estimated effect for each variable and the interac- tions between the variables were determined and are re- ported in Table 5. Both variables are relevant to tannase production at a 95% confidence level. The correlation analysis has shown that the MgSO4 interaction versus the
agitation rate and the MgSO4 quadratic term were not
statistically significant. The agitation rate quadratic term and both linear terms are significant, which affects the curvature in the response surface plot. The analyses of
[image:5.595.57.289.84.256.2]the results show that the deviations were low in the de- sirable range where the activity value was high.
Table 6 shows the analysis of variance (ANOVA) for
tannase production. The terms with no significance were removed from the ANOVA. The results of the ANOVA show good reproducibility of the data observed with a very low error value. The determination coefficient (R2) explained 97.6% of the variability of the data, and the
F-test results demonstrated that the fit of the model was very good (F-regression >3.71).
The regression analysis of the experimental data ob- tained after the ANOVA resulted in the adjusted second order polynomial Equation (2) below:
( )
2
1 2 2
Tannase activity Y
0.170 0.036x 0.124x 0.103x
=
− + + (2)
where Y is the tannase produced as a function of the coded levels of MgSO4·7H2O concentration (x1) and agi-
tation rate (x2). The predicted values and the relative de-
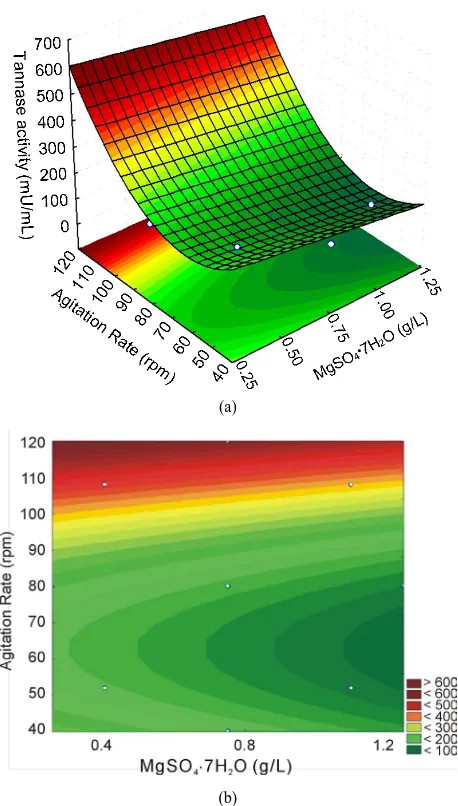
viation between the real and predicted response for each assay are presented in Table 2, and the response surface and contour curve with the influence of the variables MgSO4 and agitation rate on enzyme activity are pre-
sented inFigure 2.
Figure 2 shows that the optimum conditions for tan-
nase production are at the highest levels of agitation (between 110 and 120 rpm) and that the variations in the MgSO4 levels do not exhibit a greater influence on the
tannase activity. This result indicates that the MgSO4
levels should be between 0.25 and 0.5 g/L. These results are different from the previous ones from the Plackett- Burman design, most likely due to differences in the tested ranges.
In this simplified low cost medium, Aspergillus sp. GM4 tannase demonstrated an activity of 539 mU/mL, representing a 2.66-fold increase compared to the activity obtained before applying the experimental design. The experimental design reduced the number of medium components and slightly increased the tannase produc- tion.
4. Discussion
Table 5. Effect estimates for extracellular tannase production by Aspergillus sp. GM4.
Factor Effect Std. Err. t(5) p −95% 95%
Cnf. Limt Cnf. Limt
Mean 0.168 0.017 10.023 0.0002 0.125 0.211
1 MgSO4·7H2O (L)a −0.072 0.021 −3.511 0.0171 −0.125 −0.019
MgSO4·7H2O (Q) 0.005 0.025 0.193 0.8549 −0.058 0.068
2 Agitation rate (L)a 0.249 0.021 12.122 0.0001 0.196 0.302
Agitation rate (Q)a 0.208 0.025 8.495 0.0004 0.145 0.271
1L by 2L 0.023 0.029 0.794 0.4633 −0.052 0.098
[image:6.595.309.538.235.638.2]aSignificant factors (p < 0.05).
Table 6. Analysis of variance for tannase production.
Source of variation
Sum of squares
Degrees of freedom
Mean
squares F test
Regression 42.75315 3 14.251052 20907.0
Error 0.004771 7 0.0006816
Total 0.203996 10
R2 = 97.6%; F3,7; 0.05 = 3.71.
using tannic acid as a carbon source [6]. Generally, the production of this enzyme occurs during the first steps of microbial growth because tannase is a primary metabolite [13,20]. According to Aguilar et al. [21], the maximal tannase production by Aspergillus sp. is attained between 1 to 3 days of cultivation, as observed for the Aspergillus
sp. GM4 extracellular tannase. The decrease in the tan- nase production after three days of cultivation may be due to the reduction in substrate availability and the se- cretion of proteases that can act on secreted tannase.
Tannase can be produced either constitutively or un- der induction, depending on the strain and fermentation conditions. The enzyme production by Aspergillus sp. GM4 was induced in the presence of 2% (w/v) tannic acid, methyl gallate and gallic acid. However, a basal level of tannase production was observed when glucose was used as a carbon source. According to Bradoo et al.
[19], the fungus A. japonicus produced tannase constitu- tively in culture medium containing simple or complex sugars, but the production is increased when tannic acid is the sole carbon source [19]. There is some controversy regarding the tannase regulation mechanism and the spe- cific roles of some compounds in the induction and re- pression of tannase expression. Tannic acid cannot act directly as an inducer because tannic acid is a large mo-lecule that cannot cross the cell membrane, and there is no known tannic acid transporter. Therefore, the basal levels of tannase synthesis are important for initiating tannic acid hydrolysis to release the intermediary com- pounds that can act as true inducers [3]. In addition, some studies have shown that up to 0.2% (w/v) glucose concentration may favor the production of tannase, but
(a)
(b)
Figure 2. Three-dimensional response surface plot and con- tour curve for tannase activity showing the effects of agita-tion rate and MgSO4·7H2O.
above 2% (w/v), this carbon source exhibits a strong ca-tabolic repression of enzyme synthesis [13].
[image:6.595.56.287.257.329.2]149
uct. This condition may be unfavorable if the enzyme production is regulated by the end-product. The tannase production by A. niger [13] and A. japonicus [19] are repressed by gallic acid, suggesting that the enzyme production in these strains are regulated in this manner. In contrast, Aspergillus sp. GM4 tannase production is induced by gallic acid in cultivation medium, which de-monstrates that the presence of the product in the me- dium (at the tested concentrations) does not repress the production process. This response to gallic acid was also observed for tannase produced by Emericella nidulans
[22] and Bacillus massiliensis [7]. Gallic acid has been used to induce tannase production and has also been linked to the regulation of this process.
The use of statistical methodology to optimize the culture conditions and to improve enzyme production has been a useful tool for biotechnology and has recently received more attention. Some important parameters should be considered for microorganism growth and se- cretion of biotechnological products of industrial interest. The RSM can be used to analyze the influence of differ- ent parameters on enzyme production, to determine the statistical significance level, and to examine the statisti- cal interactions among the factors involved in the process. The “one-at-a-time” approach showed that four factors (tannic acid, sodium nitrate, agitation rate and incubation period) have the most influence on tannase production in
A. niger,and the use of the CCRD and RSM approaches increased the enzymatic production 2-fold (from 9.8 U/mL to 19.7 U/mL) [23]. However, the tannase produc- tion by Aspergillus sp. GM4 increased 2.66-fold using the RSM under optimized conditions in submerged fer- mentation. Tannase production in submerged fermenta- tion by Aspergillus sp. improves at high aeration rates [20], as observed in studies with A. niger and Aspergillus
sp. GM4. The agitation rate shows an important effect on the supply of nutrients, especially oxygen, for filamen- tous fungi cultivation. Furthermore, good mixing, mass and heat transfer require a threshold level of agitation. However, high agitation rates can lead to high energy dissipation rates and to high shear stress, which may re- sult in fragmentation and cell and mycelial network damage [24]. Therefore, it is important to find the opti- mal agitation rate for enzyme production without induc- ing mycelium damage.
Others factors that are important to tannase production are the supplementation of the culture medium with an adequate concentration of carbon, nitrogen and mineral source (besides cultivation in an ideal pH), temperature and incubation time. Aspergillus sp. GM4 tannase pro- duction was increased with low MgSO4 supplementation.
Many enzymes require metal ion activators to achieve full catalytic activity. At low concentrations, metal ions act as enzymatic cofactors, thereby increasing the cata-
lytic activity of the enzyme, whereas at high concentra- tions, metal ions can reduce catalytic activity [25]. Mg2+ is a well-known enzyme cofactor. The supplementation of the culture medium with salts containing magnesium is important for adequate action of magnesium-depend- ent enzymes, which are present in the general metabolic pathways and in synthesis of nucleic acids.
5. Conclusion
The Adams medium favored the Aspergillus sp. GM4 tannase production and is a low cost medium compared to the other tested culture media. Aspergillus sp. GM4 produces tannase in the presence of tannic acid and me-thyl gallate inducers. Gallic acid as the sole carbon source induced tannase production. This result suggests that tannase production by Aspergillus sp. GM4 can con- tinue in the presence of increasing product in the culture medium and that the end product does not regulate en- zyme production. In addition, the Plackett-Burman and Central Composite Rotatable designs were shown to be effective in reducing the number of components in the medium composition and increased tannase production 2.66-fold.
Acknowledgements
The authors sincerely thank the Fundação de Amparo à Pesquisa do Estado de Minas Gerais (FAPEMIG, Brazil), Coordenação de Aperfeiçoamento de Pessoal de Nível Superior (CAPES, Brazil) and Conselho de Desenvolvi-mento Científico e Tecnológico (CNPq, Brazil) for the financial aid that made the development of the present work possible.
REFERENCES
[1] P. K. Lekha and B. K. Lonsane, “Production and Appli- cation of Tannin Acyl Hydrolase: State of the Art,” In: S. Neidleman and A. Laskin, Eds., Advances in Applied Mi- crobiology, Academic Press, Inc., San Diego, 1997, pp. 215-260.
[2] S. Sharma, L. Agarwal and R. K. Saxena, “Purification, Immobilization and Characterization of Tannase from
Penicillium variable,” Bioresource Technology,Vol. 99, No. 7, 2008, pp. 2544-2551.
http://dx.doi.org/10.1016/j.biortech.2007.04.035
[3] M. Chávez-González, L. V. Rodríguez-Durán, N. Balagu- rusamy, A. Prado-Barragán, R. Rodríguez, J. C. Contreras and C. N. Aguilar, “Biotechnological Advances and Chal- lenges of Tannase: An Overview,” Food Bioprocess Tech- nology,Vol. 5, No. 2, 2012, pp. 445-459.
http://dx.doi.org/10.1007/s11947-011-0608-5
612-614.
http://dx.doi.org/10.1016/S0141-0229(96)00206-2
[5] B. Kar and R. Banerjee, “Biosynthesis of Tannin Acyl Hydrolase from Tannin-Rich Forest Residue under Dif- ferent Fermentation Conditions,” Journal of Industrial Microbiology and Biotechnology, Vol. 25, No. 1, 2000, pp. 29-38. http://dx.doi.org/10.1038/sj.jim.7000011 [6] R. Paranthaman, R. Vidyalakshmi, S. Murugesh and K.
Singaravadivel, “Optimization of Various Culture Media for Tannase Production in Submerged Fermentation by
Aspergillus flavus,” Advances in Biological Research, Vol. 3, 2009, pp. 34-39.
[7] P. D. Belur, R. Goud and D. C. Goudar, “Optimization of Culture Medium for Novel Cell-Associated Tannase Pro- duction from Bacillus massiliensis Using Response Sur- face Methodology,” Journal of Microbiology and Bio- technology,Vol. 22, No. 2, 2012, pp. 199-206.
http://dx.doi.org/10.4014/jmb.1106.06004
[8] P. Khanna, S. S. Sundari and N. J. Kumar, “Production, Isolation and Partial Purification of Xylanases from an
Aspergillus sp.,” World Journal of Microbiology and Bio- technology, Vol. 11, No. 2, 1995, p. 42.
http://dx.doi.org/10.1007/BF00704661
[9] A. Wiseman, “Handbook of Enzyme Biotechnology,” John Wiley and Sons, Halsted Press, Inc., New York, 1985, p. 148.
[10] R. M. Peralta, H. F. Terenzi and J. A. Jorge, “Β-D-Gly- cosidase Activities of Humicola Grisea: Biochemical and Kinetic Characterization of a Multifunctional Enzyme,”
Biochimica et Biophysica Acta,Vol. 1033, No. 3, 1990, pp. 243-249.
[11] P. R. Adams, “Mycelial Amylase Activities of Thermo- philic Species of Rhizomucor, Humicola and Papulaspo- ra,” Mycopathologia,Vol. 112, No. 1, 1990, pp. 35-37. http://dx.doi.org/10.1007/BF01795178
[12] H. J. Vogel, “Distribution of Lysine Pathways among Fun- gi: Evolutionary Implications,” The American Naturalist, Vol. 98, No. 903, 1964, pp. 435-446.
http://dx.doi.org/10.1086/282338
[13] C. N. Aguilar, C. Augur, E. Favela-Torres and G. Vinie- gra-González, “Induction and Repression Patterns of Fun- gal Tannase in Solid-State and Submerged Cultures,”
Process Biochemistry,Vol. 36, No. 6, 2001, pp. 565-570. http://dx.doi.org/10.1016/S0032-9592(00)00251-X
[14] A. Deschamps, G. Otuk and J. Lebeault, “Production of Tannase and Degradation of Chestnut Tannin by Bacte- ria,” Journal of Fermentation Technology, Vol. 61, No. 1, 1983, pp. 55-59.
[15] M. M. Bradford, “A Rapid and Sensitive Method for the Quantitation of Microgram Quantities of Protein Utilizing the Principle of Protein-Dye Binding,” Analytical Bio- chemistry, Vol. 72, 1976, pp. 248-254.
http://dx.doi.org/10.1016/0003-2697(76)90527-3
[16] R. L. Plackett and J. P. Burman, “The Design of Opti-
mum Multifactorial Experiments,” Biometrika, Vol. 33, No. 4, 1946, pp. 305-325.
http://dx.doi.org/10.1093/biomet/33.4.305
[17] C. F. Silva, S. L. Arcuri, C. R. Campos, D. M. Vilela, J. G. Alves and R. F. Schwan, “Using the Residue of Spirit Production and Bio-Ethanol for Protein Production by Yeasts,” Waste Management, Vol. 31, No. 1, 2011, pp. 108-114. http://dx.doi.org/10.1016/j.wasman.2010.08.015 [18] J. F. M. Burkert, R. R. Maldonado, F. Maugeri Filho and
M. I. Rodrigues, “Comparison of Lipase Production by
Geotrichum candidum in Stirring and Airlift Fermenters,”
Journal of Chemical Technology and Biotechnology,Vol. 80, No. 1, 2005, pp. 61-67.
http://dx.doi.org/10.1002/jctb.1157
[19] S. Bradoo, R. Gupta and R. K. Saxena, “Parametric Op- timization and Biochemical Regulation of Extracellular Tannase from Aspergillus japonicus,” Process Biochemi- stry,Vol. 32, No. 2, 1996, pp. 135-140.
http://dx.doi.org/10.1016/S0032-9592(96)00056-8
[20] R. Belmares, J. Contrera-Esquivel, R. Rodriguez-Herrera, A. Coronel and C. N. Aguilar, “Microbial Production of Tannase: An Enzyme with Potential Use in Food Indus- try,” Lebensmittel-Wissenschaft Und-Technologie, Vol. 37, No. 8, 2004, pp. 857-864.
[21] C. N. Aguilar, R. Rodriguez, G. Gutierrez-Sanchez, C. Augur, E. Favela-Torres, L. A. Prado-Barragan, A. Ra- mirez-Coronel and J. C. Contreras-Esquivel, "Microbial Tannases: Advances and Perspectives,” Applied Microbi- ology and Biotechnology,Vol. 76, No. 1, 2007, pp. 47-59. http://dx.doi.org/10.1007/s00253-007-1000-2
[22] H. B. Gonçalves, A. J. Riul, H. F. Terenzi, J. A. Jorge and L. H. S. Guimarães, “Extracellular Tannase from Emeri- cella nidulans Showing Hypertolerance to Temperature and Organic Solvents,” Journal of Molecular Catalysis B:
Enzymatic Journal of Molecular Catalysis B: Enzymatic, Vol. 71, No. 1-2, 2011, pp. 29-35.
http://dx.doi.org/10.1016/j.molcatb.2011.03.005
[23] S. Sharma, L. Agarwal and R. K. Saxena, “Statistical Optimization for Tannase Production from Aspergillus niger under Submerged Fermentation,” Indian Journal of Microbiology,Vol. 47, No. 2, 2007, pp. 132-138. http://dx.doi.org/10.1007/s12088-007-0026-6
[24] S. Kelly, L. H. Grimm, J. Hengstler, E. Schultheis, R. Krull and D. C. Hempel, “Agitation Effects on Sub- merged Growth and Product Formation of Aspergillus niger,” Bioprocess and Biosystems Engineering, Vol. 26, No. 5, 2004, pp. 315-323.
http://dx.doi.org/10.1007/s00449-004-0368-y
[25] B. Kar, R. Banerjee and B. C. Bhattacharyya, “Effect of Additives on the Behavioral Properties of Tannin Acyl Hydrolase,” Process Biochemistry, Vol. 38, No. 9, 2003, pp. 1285-1293.