Enhancement Technique of Image Contrast using New
Histogram Transformation
Wanhyun Cho1, Seongchae Seo2, Jinho You3, Soonja Kang4
1
Department of Statistics, Chonnam National University, Gwang-ju, Korea; 2Department School of Electronics & Computer Engi-neering, Chonnam National University, Gwang-ju, Korea; 3Doul Infotech, Gwang-ju, Korea; 4Department of Mathematical Educa-tion, Chonnam National University, Gwang-ju, Korea.
Received November 2013
ABSTRACT
This paper presents a preprocessing technique that can provide the improved quality of image robust to illumi-nation changes. First, in order to enhance the image contrast, we proposed new adaptive histogram transforma-tion combining histogram equalizatransforma-tion and histogram specificatransforma-tion. Here, by examining the characteristic of histogram distribution shape, we determine the appropriate target distribution. Next, applying the histogram equalization with an image histogram, we have obtained the uniform distribution of pixel values, and then we have again carried out the histogram transformation using an inverse of target distribution function. Finally we have conducted various experiments that can enhance the quality of image by applying our method with various standard images. The experimental results show that the proposed method can achieve moderately good image enhancement results.
KEYWORDS
Image Preprocessing Technique; Contrast Enhancement; Histogram Equalization and Specification; Target Distribution Function
1. Introduction
Image enhancement is the preprocessing of image to im-prove the interpretability or perception of information in images for human viewers and to provide a better input for other automated image processing techniques. The principal objective of image enhancement is to modify attributes of an image to make it more suitable for a giv-en task and a specific observer. During this process, one or more attributes of an image are modified. The choice of attributes and the way that they are modified are spe-cific to a given task. Moreover, observer-spespe-cific factors, such as the human visual system and the observer’s ex-perience, will introduce a great deal of subjectively into the choice of image enhancement methods [1,2].
Image enhancement is generally used in the following three cases: noise reduction from image, contrast en-hancement of the very dark and bright image, and high-light the edges of the objects in a blurring image. Noise reduction is the process of removing noise form a signal or an image. In general, images taken with both digital camera and conventional film cameras will pick up noise
from a variety of sources. Therefore, it is required that the noise is removed for many further uses of these im-ages. Contrast enhancement is acquiring clear image through brightness intensity value redistribution. That is, this is enhancing features as stretching interval between dark and brightness area. De-blurring process is to re-store the sharp images via image de-convolution such as Wiener de-convolution.
image histogram equalization (DSIHE), minimum mean brightness error bi-histogram equalization (MMBEBHE), recursive mean-separate histogram equalization (RMSHE), recursive sub-image histogram equalization (RSIHE), multi-peak histogram equalization with brightness pre-serving (MPHEBP), and dynamic histogram equalization (DHE). On the other hand, another popular contrast en-hancement scheme is histogram specification. This tech-nique enables us to match the histogram of input image close to the histogram of target image. However, speci-fying the output histogram is not a smooth task as it va-ries from image to image. Hence, several researches have been proposed on improvement of histogram specifica-tion. They are dynamic histogram specification (DHS), Histogram specification with Gamma distribution (HSGD), image fusion histogram specification (IFHS), and auto-matic exact histogram specification (AEHS).
However, there are some problems when we have used the histogram equalization (HE) to improve the contrast of the image. First, the HE method does not take the mean brightness of an image into account. Second, the HE method may result in over enhancement and satura-tion artifacts due to the stretching of the gray levels over the full gray level range. Third, the HE method always yields the middle gray level regardless of the input image, and cause undesirable artifacts. Therefore, in order to improve these problems, we have decided in advance the target images and then we use the histogram specifica-tion method to an input image to get an image similar with target image. But, it is difficult that we determine in advance the appropriate target image. Hence, it is re-quired to a new contrast enhancement method robust to illumination changes.
Hence, in order to solve these problems at the same time, we try to propose a new image enhancement me-thod that uses a new histogram transformation. In the Section 2, in order to enhance the image contrast, we have considered new adaptive histogram transformation combining histogram equalization and histogram speci-fication. In the Section 3, we presented experimental results that is able to demonstrate the effectiveness of the proposed method in comparison to a few existing me-thods quantitatively. And in the Section 4, we mentioned the conclusion of my paper.
2. Contrast Enhancement
2.1. CDF Transformation
Here we will propose a technique that can improve the contrast of an image by using a combination of
Histo-cified cumulative distribution function (CDF) to achieve a well illuminated image. In our case, we adaptively se-lect the CDF so that the contrast of image can automati-cally achieve an optimal level.
First, we assume to have an input image I(x,y) with N pixels and a total number of L gray levels, e.g., 256 gray levels for an 8-bit image. We transform the distribution of the pixel intensity values in the image I(x,y) into a uniform distribution on interval [0,1] by using the histo-gram equalization defined as the following formula. For a grey level of k, k = 0, 1, ⋯, L-1, a new transformed one uk is defined by
0 , [0, , L 1]
k i
k i
n
u k
N
=
=
∑
∈ − . (1)where ni denotes the number of pixels in I(x,y) with the
grey level value i. Equation (1) defines a mapping of the pixel’ intensity values from their original range [0,⋯,L-1] to the domain of [0,1].
Second, if the distribution of desired target image ITA
is specified, we define its probability density function (PDF) and CDF as follows:
0
G(z)=
∫
zpz(v) dv, z∈[0, L 1]− . (2) Third, we try to find a new value knew correspondingwith uk such that
0
uk =G(knew)=
∫
knewpz(v) dv. (3) But, since a new value knew is continuous value scaledon an interval [0, L-1], we should take a Gauss bracket integer [knew + 0.5].
Here, the procedure that we have considered so far would be expressed as the following example picture.
Figure 1 shows the density histogram of a given image, its equalized histogram & specified CDF, and the density histogram of output image.
Furthermore, we consider the three types of density histogram structures in order to determine adaptively a proper CDF form in our CDF transformation.
2.2. Skew Histogram to the Right
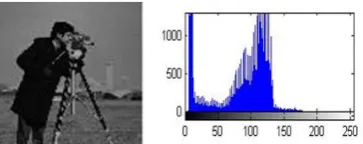
When it is given a dark image like as the following ex-ample image in Figure 2, its density histogram has a form skewed to the right.
(a) (b)
[image:3.595.59.282.77.295.2](c)
[image:3.595.319.526.84.167.2]Figure 1. Graphical Representation of our procedure. (a) Histogram of synthetic image; (b) Its equalized histogram & specified CDF; (c) Histogram transformation.
Figure 2. Dark sample image and its histogram.
prove the contrast of a given image, it is required with brighter image. Therefore, we have to consider a skew distribution to the left such as the Gompertz distribution with the opposite structure about a given histogram. Here, the expressions for its PDF, CDF and Inverse CDF are given respectively by
( )
(
)
( )
(
(
)
)
ηexpη, b 0,
G z 1 expη1
bz bz
z
bz
p z b e e e
e
η η
= − >
= − − − (4)
and 1
( )
1 1(
)
u ln 1 ln 1
η
G u
b
− = − −
. Finally, when ap-
plying our method with CDF being Gompertz distribu-tion to a given image, we have to select two parameters,
η and b. Here, we used η = 0.018 and b = 2.322. Figure 3
shows the contrast improved image and its histogram obtained by using our method.
2.3. Skew Histogram to the Left
[image:3.595.316.531.208.286.2]As opposed to above, suppose that we have a very bright image like as the following example image in Figure 4. Then, its density histogram has a form skewed to the left. In such a case, the average of the gray values of a giv-
Figure 3. Contrast enhanced image and its histogram after applying CDF transformation.
Figure 4. Bright sample image and its histogram.
en image is larger than the average value (N + 1)/2 of symmetrical distribution. Hence, in order to improve the contrast of a given image, it is required with darker im-age. Therefore, we have to consider a skew distribution to the right such as the log-normal distribution or the Weill distribution with the opposite structure about a given histogram. Here, the expressions for PDF, CDF, and inverse CDF of the Weibull distribution are given respectively by
( )
( )
1
1
z λ0, >0, k>0
λλ
G z 1 e
,
xp
λ
k z
k
k z
p z
z
−
−
= ≥
= − −
(5)
and 1
( )
λ(
(
)
)
1/ln 1 k
G− u = − −u . Finally, when applying our method with CDF being Weibull distribution to a
given image, we have to select two parameters, λ (scale) and k (shape). Here, we used λ = 1.0 and k = 1.5. Figure 5 shows the contrast improved image and its histogram obtained by using our method.
2.4. Symmetrical Histogram
Third, suppose that we have a usual image or equalized image like as the following example image in Figure 6. Its density histogram is generally given as the shape sim- ilar to the histogram of a symmetric distribution.
[image:3.595.82.264.345.417.2]Figure 5. Contrast enhanced image and its histogram after applying CDF transformation.
Figure 6. Usual sample image and its histogram.
( )
1 1 2exp , - < , 0
2 2
z
z
p z µ µ σ
σ πσ
−
= − ∞ < ∞ >
(6)
and
( )
0 1 1 2G z exp 2 2
z u
du
µ σ πσ
−
= −
∫
Finally, when applying our method to a given image with CDF being the Normal distribution, we have to
se-lect two parameters, μ (location) and σ (scale). Here, we
used μ = 127.5 and σ = 14. Figure 7 shows the contrast improved image and its histogram obtained by using our method.
2.5. Adaptive Histogram Transformation
Finally, we adaptively improve the contrast of input im-age by applying the following procedure. This method is summarized below.
1) Calculate the average for the gray values of the in-put image.
2) Determine whether this value belongs something among the three regions [0, μ-σ],[μ - σ,μ + σ] and [μ + σ,
255], where μ and σ are selected by the mean and the standard deviation of normal distribution. Here, we used
μ = 127.5 and σ = 42.
3) If this value belongs to the first region, we apply the Gomertz CDF method for input image, else if this value belongs to the second region, we apply the normal CDF method for input image, and else if this value belongs to the third region, we apply the Gumbel CDF method for input image.
3. Experiments
In this section, we provide experimental results in order
various contrast enhancement methods were tested on standard images Camera man, Man, Barbara, Lena, Elaine. All of images are with size of 512 × 512 pixels. To compare their performances, the same images are enhanced with Gamma correction (GC), Histogram equalization (HE), Histogram specification (HS), and proposed method (PM). For all these methods, the per-formance is measure qualitatively in terms of human visual perception and quantitatively by using the widely used metric EME (a measure of enhancement) for mea-suring contrast enhancement. This measure is defined as follows:
2 1 ; ,
1 1
1 2 ; ,
1
EME 20 log
w
k k max k l
w
l k
min k l I
k k = = I
=
∑ ∑
where an image I(x,y) is split into k1 k2 blocks Wk,l (x,y)
of sizes l1×l2, and max; ,
w k l
I and min; ,w k l
I are respectively maximum and minimum of the image I(x,y) inside the block Wk,l (x,y). The EME values for different images
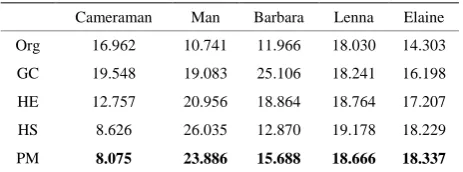
are given in Table 1. Here, Org, GC, HE, HS, and PM denote respectively for original image, gamma correction, histogram equalization, histogram specification, and pro- pose method.
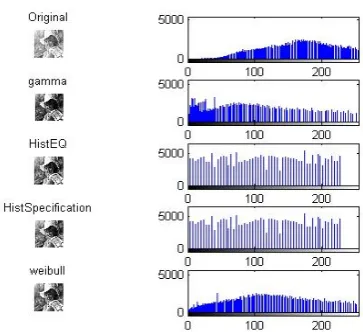
The enhanced images and histograms obtained by dif-ferent methods for the Elaine image are shown in Figure 8.
It is evident from the table and figure that the proposed method provides better contrast enhancement than the existing methods.
[image:4.595.310.537.510.594.2]Figure 7. Contrast enhanced image and its histogram after applying CDF transformation.
Table 1. EME values for different methods and images.
Cameraman Man Barbara Lenna Elaine
Org 16.962 10.741 11.966 18.030 14.303
GC 19.548 19.083 25.106 18.241 16.198
HE 12.757 20.956 18.864 18.764 17.207
HS 8.626 26.035 12.870 19.178 18.229
[image:4.595.308.540.647.733.2]Figure 8. Enhanced images and histograms given by differ-ent methods.
4. Conclusion
In this paper, we propose a new image enhancement me-thod that combines both the histogram transformation and edge-preserving regularization. First, we proposed new adaptive histogram transformation combining histo-gram equalization and histohisto-gram specification in order to enhance the image contrast. Second, we consider the characters of a various regularization functions in the energy functional that satisfies an edge-preserving noise reduction.
From the experimental results, we note that the pro-posed method can provide better contrast enhancement than the existing methods. And we note that the total variation method is considered as the best way to remove noise than other methods.
Acknowledgements
This work was supported in part by the Research Foun-dation Grant by the Chonnam National University (CNU-2012) and it also was the results of a study on the “Leades INdustry-university Cooperation” Project,
sup-ported by the Ministry of Education, Science & Tech-nology (MEST).
REFERENCES
[1] R. Maini and H. Aggarwel, “A Comprehensive Review of Image Enhancement Techniques,” Journal of Computing, Vol. 2, No. 3, 2010, pp. 8-13.
[2] C. J. Prabhakar and P. U. Paraveen Kumar, “An Image Based Technique for Enhancement of Underwater Im- ages,” International Journal of Machine Intelligence, Vol. 3, No. 4, 2011, pp. 217-224.
[3] H. Ibrahim and N. S. P. Kong, “Brightness Preserving Dynamic Histogram Equalization for Image Contrast En- hancement,” Consumer Electronics, Vol. 53, No. 4, 2007, pp. 1752-1758.
[4] H. Yoon, Y. Han and H. Hahn, “Image Contrast En-hancement Based Sub-Histogram Equalization Technique without Over-Equalization Noise,” International Journal of Electrical and Electronics Engineering, Vol. 3, No. 6, 2009, pp. 323-329.
[5] M. Kaur, J. Kaur and J. Kaur, “Survey of Contrast En- hancement Techniques Based on Histogram Equalization,”
International Journal of Advanced Computer Science and Applications, Vol. 2, No. 7, 2011, pp. 137-141.
[6] V. Struc, J. Zibert and N. Pavesic, “Histogram Remap- ping as a Preprocessing Step for Robust Face Recogni- tion,” WSEAS Transactions on Information Science and Applications, Vol. 6, No. 3, 2009, pp. 520-529.
[7] K. K. Lavania and R. Shivali, Kumar, “A Comparative Study of Image Enhancement Using Histogram Ap-proach,” International Journal of Computer Applications, Vol. 32, No. 5, 2011, pp. 1-6.
[8] S. S. Agaian, K. P. Lentz and A. M. Grigoryan, “Trans- form-Based Image Enhancement Algorithms with Per- formance Measure,” IEEE Transactions on Image Pro- cessing, Vol. 10, No. 3, 2001, pp. 367-381.