2016 International Conference on Computer, Mechatronics and Electronic Engineering (CMEE 2016) ISBN: 978-1-60595-406-6
Automatic Recognition Method of Layer Paths in the Ionogram Based
on Mathematical Morphology Method and Inversion Technology
Huan SONG
1, Xian-jian ZOU
2,*, Zeng-qiang HAN
2and Xin-jian TANG
21Electronic Information School, Wuhan University, Wuhan, China
2State Key Laboratory of Geomechanics and Geotechnical Engineering, Institute of Rock and Soil
Mechanics, Chinese Academy of Sciences, Wuhan, China
*Corresponding author
Keywords: Automatic recognition, Mathematical morphology, Inversion technique, Ionogram.
Abstract. The automatic recognition of layer paths in the ionogram can get the key parameters of ionogram which are very important and necessary to the research of space exploration. This paper describes a new automatic recognition method and its application to automatically recognize layer paths from ionogram based on morphological operator and inversion technology. This method is verified through the comparison of actual detecting data with statistical analysis. Results show more than 90% automatic recognition results accord with the people analysis. This automatic recognition method has high acceptable rate and is suitable for recognition ionogram with different high angle wave states. It can accurately recognize the parameters in the ionogram with a fast and precise approach. This method meets the real-time requirements of ionosphere sounding detection in practice.
Introduction
Detection of ionosphere with short wave can obtain the ionogram, which describes the relation between radio wave propagation lag and frequency [1]. People extract parameters related to ionosphere from ionogram, such as group path and frequency, which truly reflect the state of ionosphere, and the process of extracting the feature parameters is called recognition [2-5]. Recognition of ionograms initially relies on the manual operation performed by experienced workers. This method provides more accurate results, but it is hard to meet real-time requirements [6-8]. Therefore, researchers make great efforts to realize the real-time automatic recognition of vertical ionogram.
However, some existing automatic recognition methods of vertical ionogram cannot be directly applied in the ionogram. Because there are big differences between vertical ionogram and ionogram, concrete embodiment in the F2 layer paths of ionogram consist of low angle wave, high angle wave and the O-mode echoes in the low angle part overlaps with the X-mode echoes. Up to date, the public references about ionogram automatic recognition are few. Redding (1996) [9] used several steps to complete the ionogram automatic recognition. These steps include filtering noise, refining paths, model fitting and merging paths. The described method in Ref. [9] is only suitable for the ionogram with one high angle wave. Fan et al. [10] used morphological operators in digital image processing method to identify E layer path, O-mode path and X-mode path from F2 layer. Even though some progress has been made in recent years in automatic recognition for ionogram, how to improve the reliability and accuracy of the data is still a big challenge and waiting for us to further research.
Automatic Recognition Method
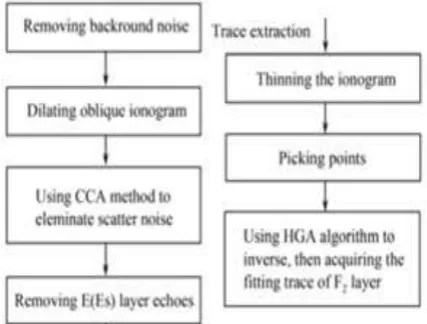
[image:2.595.190.404.142.304.2]In order to describe automatic recognition method clearly, we divide it into two parts. One is the pre-process of ionogram shown in the left of Figure 1. Another is the process of path extraction shown in the right of Figure 1. The whole framework of the method is shown in Figure 1.
Figure 1. Framework of the automatic recognition method.
The Pre-process of Ionogram
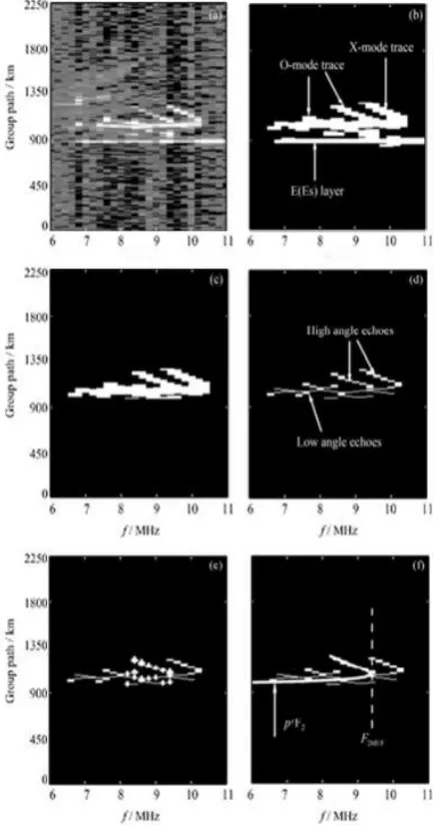
Echo signals in the ionogram are mixed with three kinds of noise, as shown in Figure 2 (a). In order to ensure the accuracy of F2 layer paths extraction, it is necessary to remove noise at the first. In the pre-process of ionogram, we take a connected component (CCA) method, which is used to eliminate scatter noise by adopting dilation in morphological operator [11]. The ionogram without noise is shown in Figure 2 (b).
The core of automatic recognition is path extraction, which directly affects the accuracy of automatic recognition results, while the existence of E (Es) layer echoes in the ionogram seriously affects the accuracy of the extraction of F2 layer paths. Therefore, it is necessary to remove E (Es) layer echoes before extracting path. E (Es) layer usually appears in the distance of 110 km above the ground and it is relatively stable. It can be removed by calculating the appeared positions in the ionogram, which is based on the ground distance between receiver and transmitter. The ionogram after eliminating E (Es) layer is shown in Figure 2 (c).
The Process of Path Extraction
In order to accurately extract the path features of the F2 layer, it is necessary to thinning the ionogram after dilating [13]. The ionogram after thinning operation is shown in Figure 2 (d). Some points Pi (fi, pi) (i =1, 2, 3, etc.) are obtained as the original input data of inversion algorithm in the thinning path. Pi is the corresponding observed group path at the detection frequency fi. Because only O-mode path is needed, the data of X-mode path should be removed before picking points.
The low angle echo of O-mode path and X-mode path in the ionogram is nearly at the same position in the ionogram. Otherwise, the high angle echo of O-mode path is in front of X-mode’s, i.e., the lines in Figure 2 (d). Therefore, we can use this feature to distinguish the O-mode echo and X-mode echo. They are by comparing the frequencies of them in the same group path. The echoes with smaller frequencies are from O-mode path, and others are from X-mode path. The white “*” on O-mode path are the selected input points, shown in Figure 2 (e).
Application and Discussion
Ionogram Data
[image:3.595.188.406.186.599.2]In this paper, we take this method to analyze actual ionogram data which are obtained in the Ionogram Laboratory of Wuhan University on August 24-26, 2010. The detection devices work in scanning frequency mode with the frequency between 6 MHz to 30 MHz. The pace of scanning frequency is 0.2 MHz and the distance resolution is 12.5 km.
Figure 2. The description of the automatic recognition process. (a) the ionogram before preprocessing; (b) removing noise; (c) eliminating e(es) layer; (d) thinning path; (e) selecting points (the white“*”); (f) fitting path (the white line).
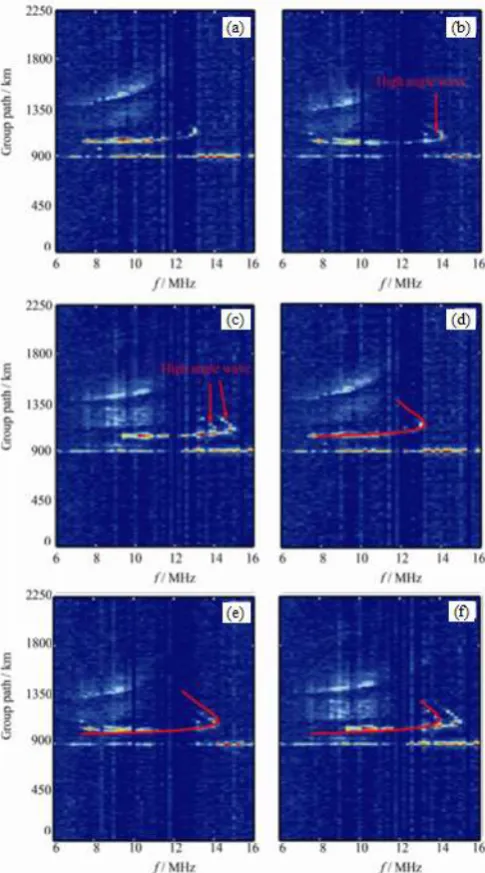
In order to show path fitting results clearly, we use the method automatically recognize three typical ionograms from the 41 ionograms. There are 49 ionograms in this experiment, 8 of which are without echo signal. Therefore, 41 ionograms are suitable for automatic recognition. The three ionograms with different high angle wave states are presented in Figure 3, which are obtained at 12:00 LT, 14:00 LT, 15:00 LT on August 24, 2010, respectively. Figure 3 (a) has not high angle wave or the high angle wave has not been developed yet. Figure 3 (b) only has a single high angle wave, and it is taken as O-mode path. Figure 3 (c) has two high angle waves which are developed very well.
Application Results and Discussion
shown in Figure 3 (d), Figure 3 (e) and Figure 3 (f), respectively. In order to verify the accuracy of proposed automatic recognition method, we compare the recognition results with the automatic recognition method (Auto) results and the manual recognition method (Manual) results. The values of two key parameters F2MUF and p'F2 in the ionogram are shown in Table 1.
Table 1. Comparison of automatic recognition method and manual recognition method.
Wave States Recognition Modes
Auto Manual
No high angle wave F2MUF /MHz 13.2 13.0
p’F2 /km 1042.5 1050.0
One high angle wave F2MUF /MHZ 14.2 14.0
p’F2 /km 998.7 1025.0
Two high angle waves F2MUF /MHz 14.0 14.0
p’F2 /km 1007.5 1025
Notices. p'F2 is the minimum group path of F2 layer and F2MUF is the maximum usable frequency of F2
[image:4.595.176.419.308.745.2]layer. The Auto represents the automatic recognition method and the Manual represents the manual recognition method.
Figure 3. Path fitting results of ionograms under three different high angle wave states. (a) no high angle wave; (b) one high angle wave; (c) two high angle waves; (d) is the fitting result of (a); (e) is the fitting result of (b); (f) is the fitting
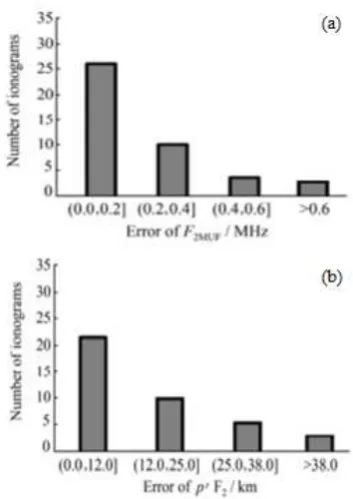
The manual recognition results are taken as reference values. The range of the tolerated deviation is ±3, which is the normal resolution of ionogram. The tolerated deviation is smaller than that of the ±5 in International Union of Radio Science (URSI). The accuracy of the automatic recognition results are confirmed when the F2MUF error of Auto and Manual is within 0.2 MHz and the p'F2 error is within 12.5 km, and acceptable when the F2MUF error is within 0.6 MHz and the p'F2 error is within 38 km. Otherwise, the automatic recognition results are not correct.
In Table 1, the F2MUF errors of three ionograms are 0.2, 0.2 MHz and 0.0 MHz, respectively. They are all within 0.2 MHz, which indicates that the automatic recognition results of F2MUF are accurate. The errors of p'F2 of three ionograms are 7.5, 26.25 km and 17.5 km, respectively. They are all within 38 km, which indicates that the automatic recognition results of p'F2 are acceptable.
Figure 3 (d), Figure 3 (e) and Figure 3 (f) present the path fitting results of three different high angle wave state ionograms by using automatic recognition method described above. It shows that the red lines are in good agreement with the true O-mode paths. The above results show that the proposed automatic recognition method can make full use of the ionogram data, and it is not only suitable for ionograms with different high angle wave state, but also able to fit F2 layer path in a fast and accurate way.
We can also show the automatic recognition results and the manual recognition results of all the ionograms obtained on August 24-26, 2010. Some curves show that the values of F2MUF and p'F2 fluctuate with time. The horizontal axis from left to right presents the different local time on August 24-26. The correlation coefficient of F2MUF between the automatic recognition results and manual recognition results is 0.997, and the correlation coefficient of p'F2 is 0.910. They are all nearly 1.0. The mean-square error (σ) of F2MUF and p'F2 are 0.243 MHz and 20.239 km, respectively. They are all involved in the defined acceptable range. These data show their application results of the automatic recognition method.
[image:5.595.208.385.454.704.2]Consequently, the automatic recognition results are close to the manual recognition results and their variation trends are almost the same values. Their statistical results of automatic recognition results are shown in Figure 4 (a) and Figure 4 (b).
Figure 4. Statistical results of automatic recognition results (a) and manual recognition results (b).
However, the method is not suitable for the ionograms obtained during sunrise and sunset when ionosphere changes rapidly. In addition, the proposed method can only be used to recognize F2 layer in ionogram. Actually, F1 layer and E(Es) layer also exist in the ionogram. Therefore, to develop a method for the automatic recognition of F2 layer, F1 layer and E(Es) layer at the same time is the work to be done in the future.
Conclusion
This paper applies an automatic recognition method to recognize ionogram based on a morphological operator and the hybrid genetic algorithm. This method includes ionogram preprocess and path extraction, and is used in application engineering. In order to verify the accuracy of this automatic recognition method, we use this method to automatically recognize some actual ionograms obtained on August 24-26, 2010. By comparing the automatic recognition method with the manual recognition method, we have obtained some important conclusions from the above results. This automatic recognition method is able to separate out O-mode path and X-mode path accurately. And the acceptable rates of F2MUF and p'F2 are 95.1% and 92.7%, respectively. It indicates that the accuracy and reliability of this method are high. The method can fully satisfy the need of real-time measurement and can apply in actual engineering and scientific experiments.
Acknowledgment
This paper was supported by the National Science Foundation of China (Grant No. 41402278 and No. 41372317).
References
[1]D. Reinisch B W and Huang X, “Automatic calculation of electron density profiles from digital ionograms: 1. Automatic O and X trace identification for topside ionograms,” Radio Science, vol 17, Mar. 1982, pp. 421-434, doi: 10.1029/RS017i002p00421.
[2]P Maragos and R Schafer, “Morphological skeleton representation and coding of binary images,” IEEE Transactions on Acoustics Speech and Signal Processing, vol 34, Oct. 1986, pp. 1228-1244, doi: 10.1109/TASSP.1986.1164959.
[3]X Huang and B W Reinisch, “Automatic calculation of electron density profiles from digital ionograms: 2. True height inversion of topside ionograms with the profile fitting method,” Radio Science, vol 17, Jul. 1982, pp. 837-844, doi: 10.1029/RS017i004p00837.
[4]L C Tsai and F T Berkey, “Ionogram analysis using fuzzy segmentation and connectedness techniques,” Radio Science, vol 35, Sep. 2000, pp. 1173-1186, doi: 10.1029/1999RS002170.
[5]N J Redding, “Image understanding of oblique ionograms: The autoscaling problem,” Intelligent Information Systems. Adelaide: IEEE, Nov. 1996, pp. 155-160, doi: 10.1109/ANZIIS.1996.573922.
[6]C Scotto and M Pezzopane, “A method for automatic scaling of sporadic E layers from ionograms,” Radio Science, vol 42, Apr. 2007, pp. RS2012-RS2012-5, doi: 10.1029/2006RS003461.
[7]Song H, Hu Y G, Zhao Z Y, et al, “Inversion of oblique ionograms based on hybrid genetic algorithm,” Chinese J Geophy, vol 57, Mar. 2014, pp. 703-714, doi: 10.6038/cjg20140302.
[9]N N Rao, “Inversion of sweep-frequency sky-wave backscatter leading edge for quasiparabolic ionospheric layer parameters,” Radio Science, Vol 9, Oct. 1974, pp. 845-847, doi: 10.1029/RS009-i010p00845
[10]J Song, Z Y Zhao, C Zhou, et al, “Inversion of HF sweep-frequency backscatter ionograms,” Chinese J Geophy, Vol 54, Aug. 2011, pp. 1953-1959, doi: 10.3969/j.issn.0001-5733.2011.08.002.
[11]G Chen, Z Zhao, Y Zhang, et al, “Application of the oblique ionogram as vertical ionogram,” Science China Technological Sciences, Vol 55, May 2012, pp. 1240-1244, DOI: 10.1007/s11431-012-4795-8.
[12]S W Mahfoud and D E Goldber, “A genetic algorithm for parallel simulated annealing,” In: Parallel Problem Solving from Nature, vol. 2 Elsevier, Amsterdam, Sep.1992, pp. 301-310.
[13]B Ö Hettemir and R Sonmez, “Hybrid genetic algorithm with simulated annealing for resource-constrained project scheduling,” Journal of Management in Engineering, Vol 31, Sep. 2015, pp. 115-137, doi: 10.1061/(ASCE)ME.1943-5479.0000323.
[14]P H Chen and S M Shahandashti, “Hybrid of genetic algorithm and simulated annealing for multiple project scheduling with multiple resource constraints,” Autom. Constr., Vol 18, Jul. 2009, pp. 434–443, doi:org/10.1016/j.autcon.2008.10.007.
[15]H Song, Y Hu, C Jiang, et al., “Automatic scaling of HF swept-frequency backscatter ionogram,” Radio Science, Vol 50, May 2015, pp. 381-392, doi: 10.1002/2014RS005621.