2016 Joint International Conference on Artificial Intelligence and Computer Engineering (AICE 2016) and International Conference on Network and Communication Security (NCS 2016)
ISBN: 978-1-60595-362-5
Tracking the Maximum Power of the Hybrid PV-wind Systems
Based on Genetic Algorithm
Ying-Li WANG
a, Jing GUO
b*, Chao TIAN
cHarbin University of Science and Technology Harbin, China
a[email protected], b[email protected]
*Corresponding author
Keywords:Hybrid PV-wind System, Maximum Power Tracking, Genetic Algorithm.
Abstract. In order to highlight the advantages of genetic algorithm in hybrid PV-wind system, this paper improves the traditional genetic algorithm, and establishes the mathematical model of photovoltaic power generation and wind power generator by MATLAB, to find out the maximum power point of the mathematical model under the iteration of genetic algorithm.
Introduction
As we all know, the natural resources in our country are very rich. Wind energy and solar energy in the north of China are complementary to each other, and in remote areas is the power grid cannot be used, but also need to use electricity. Based on the above problems, this paper proposes an improved genetic algorithm, which does not need to know whether the objective function can be guided or continuous, can quickly find the optimal solution of the objective function. Compared with other algorithms, this method tracks faster, and its precision is higher and real time is harder.
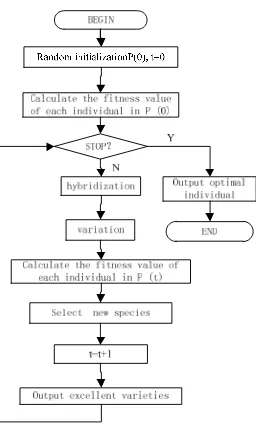
[image:1.612.221.349.432.644.2]Introduction of Genetic Algorithm
Figure 1. The Program Flow Chart of Genetic Algorithm.
iteration, you can find the optimal value of the function. The program flow chart of genetic algorithm is shown in (Fig. 1).
Solar Maximum Power Tracking Based on Genetic Algorithm
According to the principle of genetic algorithm. Using MATLAB genetic algorithm toolbox, set breeding pond contains a total of 20 individuals in a population, the objective function of PU formula, namely 2.6U 0.0001U exp 0.4135U 1 , the generation gap is set to 0.9, Gene recombinant probability 0.7.This article set 20 then generates initial individual. Individuals with these initial genetic cross as a parent, to find the best individual.
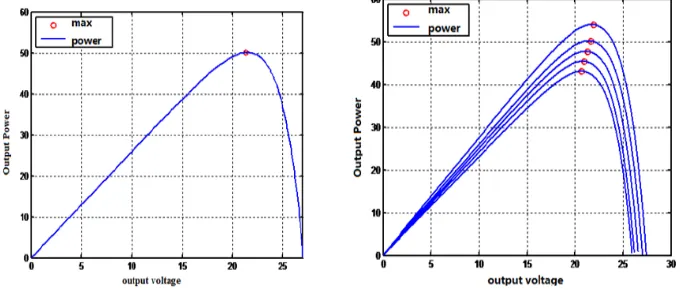
[image:2.612.139.479.252.397.2]After five generations of genetic tracking, you can find the optimal value of the objective function x = 21.2060V. Maximum power 50.1197W. Find the maximum power point as shown in ( Fig. 2).
Figure 2. The P-U Curve of Solar Cell Fig. 3 The P-U Curve of Solar Cell Between Different Temperatures.
For the case of different temperatures, a maximum power point of the solar panel is not the same can be obtained PU power curves at different temperatures, as shown in (Fig. 3), and each has its own curve of a maximum power point. With these curves, you can use the genetic algorithm to find the maximum value of each curve, expressed as "O" in (Fig. 3). The maximum power point of each temperature can quickly be found under the genetic.
Wind Energy Maximum Power Tracking Based on Genetic Algorithm
According to the aerodynamic characteristics of the wind turbine, the output power of the wind turbine can be expressed as:
ρ (1)
WhereCPis the wind energy utilization coefficient,ρ is the air density, R is the blade radius, V
is the wind speed.
In the case of different wind speed, the output power of the fixed wind turbine is proportional to , , and is proportional to the three time of the wind speed. The relationship between and the wind speed is shown as (1). represents how much energy a large windmill could absorb at a fixed time.
The relationship between and can be expressed as formula (3):
.
.
(3)
A mathematical representation method can be derived from the formula (1):
(4)
Where S is the circular area of blade rotation, P is the useful power of wind turbine; V is the upstream wind velocity.
Wind wheel in different wind speed will have different operating conditions, in order to express the conditions, it can be indicated by the tip speed ratio which is the ratio of tip circumference velocity and wind velocity.
λ (5)
Where n is the wind wheel speed, R is the wind wheel radius, w is the wind wheel angle frequency, V is the upstream wind speed.
&
According to the principle of aerodynamic force, torque and thrust are (6) and (7). Set λ as a changing value with time, and then you can infer how big the torque of wind turbine is.
(6)
(7)
Where T is the torque, F is the thrust. Formula (1) can be seen that when the wind turbine in leaf length, air density and wind speed are invariable, wind energy utilization coefficient becomes the only factors affecting power output, and output power and is proportional to ; is a function of the tip speed ratio λ , and λ is the tip speed ratio.
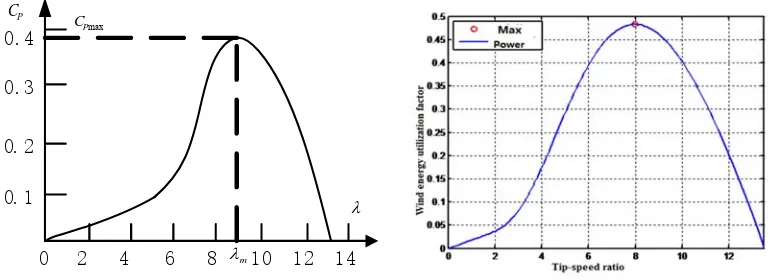
According to (Fig. 4) curve trend, it can be seen that is slowly increasing at first with the change of λ, and then rapidly decrease. In the middle of the increasing and decreasing, there is a maximum value which is the maximum wind energy utilization coefficient, and the corresponding will also have an optimal tip speed ratio. Therefore, this paper is to find the optimal tip speed ratio in the wind turbine maximum power tracking.
0 2 4 6 8 10 12 14
0.4
0.3
0.2
0.1
max P
C
m P
C
[image:3.612.95.487.562.702.2]
5), the point in the graph coordinates is (7.9789.0.482). Find out
which is the maximal wind energy utilization coefficient corresponding to the tip speed ratio, and substitute
into the formula (7), you can get the corresponding to the fan speed n.n .. . 18.36 (8)
By the formula (8), the n value is approximate 18.36 r/s, the wind turbine speed at this time is the best value for speed. In the controller design circuit, tracking the speed value of the wind turbine can track the maximum power of wind energy.
[image:4.612.134.481.240.418.2]Experimental Results Analysis
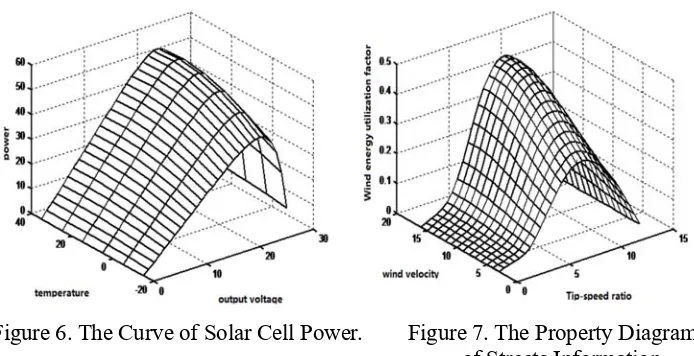
Figure 6. The Curve of Solar Cell Power. Figure 7. The Property Diagram of Streets Information.
In( Fig. 6), the essential of influencing the maximum power are the output voltage of the solar cell panel and the environmental temperature. X axis is output voltage value; Y axis is the current temperature value; Z axis is the output power. From this figure, you can see that at the same temperature,the power of the solar cell mainly rise with the increase of the output voltage at the beginning, and when it reach a maximum value, it will decline in an exponential form.
From( Fig. 7), we can see that under a fixed wind speed, the maximum wind energy using coefficient and tip speed ratio generally increase at first, when reach a maximum value, then decreases rapidly.
Also, under each different wind speeds, the overall trend of the wind energy utilization coefficient and tip speed ratio curve is basically consistent, only the position of the maximum points is different.
Conclusion
Acknowledgement
This research was financially supported by Natural Science Foundation of Heilongjiang Province of China (General Program) (E201235).
Reference
[1]Ma T., Yang H., Lu L. A feasibility study of a stand-alone hybrid solar-wind-battery system for a remote island [J]. Applied Energy, 2014, 121: 149-158.
[2]Chen N., Qu X., Weng W., et al. Design of Wind-solar Complementary Power System Based on Progressive Fuzzy Control [J]. Journal of Computers, 2014, 9(6): 1378-1384.
[3]Fu M.X., Li S.Z. Maximal Wind-energy Tracking Control of Variable-speed Constant-frequency Wind-power Generation System [C] Proceedingsof the CSU-EPSA. Editorial Board of Proceedings of the CSU-EPSA, School of Electrical & Automation Engineering Tianjin 300072 China, 2013, 25(1): 74-78.
[4]Green M.A., Emery K., Hishikawa Y., et al. Solar cell efficiency tables (Version 45) [J]. Progress in Photovoltaics: Research and Applications, 2015, 23(1): 1-9.
[5]Joshi S., Pandya V., Bhalja B. Maximum Power Point Tracking and MPPT efficiency for wind and solar energy conversion standalone system [C] India Conference (INDICON), 2014 Annual IEEE. IEEE, 2014: 1-6.