2018 International Conference on Modeling, Simulation and Analysis (ICMSA 2018) ISBN: 978-1-60595-544-5
The Influence Factors and Performance Analysis of Optical
Communication Systems Based on VPI
Qi-wu WU, Yang ZHOU
*, Ling-zhi JIANG
and Jie WANG
Engineering University of PAP, Xi’an, 710086, P. R. China
*Corresponding author
Keywords: Optical communication system, VPI, System parameters, Performance analysis.
Abstract. How to further improve the performance of optical communication systems will be an
important guarantee for the successful construction of next-generation optical networks. This paper builds an optical transmission simulation system on the VPI simulation platform. By changing the system parameters such as fiber length, transmitter bit rate, global bit rate and sampling rate, observed and analyzed the changes of spectrum and eye diagram of the optical transmission simulation system. The experimental results show that the transmitter bit rate and global bit rate have a greater impact on the spectral bandwidth of optical communication systems than the optical fiber length and sampling rate.
Introduction
Optical fiber communication system is a communication system that uses light wave as the carrier of information and uses optical fiber as a transmission medium [1]. It is mainly composed of optical transmitter, optical fiber and optical receiver. Among them, the user input information through the optical transmitter to achieve electrical-optical signal conversion, modulation in light, and then coupled into the fiber optic line transmitted to the receiving end. The optical receiver transforms the feeble optical signal transmitted through the optical fiber line, and finally restores the information from the sending user and delivers the information to the receiving user [2].
VPI transmission Maker is a powerful simulation software that simulates optical fiber communication systems and optimizes designs by changing different parameters for different modules [3]. We can also eliminate some problems that may be encountered in the implementation process through VPI simulation and improve the reliability of the optical communication system.
At present, there are many factors affecting the performance of optical communication systems [4], and most researchers analyze these factors from the theoretical and experimental aspects, but there are few researches on the influence of multiple factors on the same system performance index. Therefore, according to the role and characteristics of each component of the optical fiber communication system, based on the VPI simulation platform, combined with the basic framework of the optical fiber communication system, through the design of the corresponding simulation
module, a simulation platform of optical transmission system based on VPI is constructed. Finally,
through the experiment, the simulation results are qualitatively analyzed.
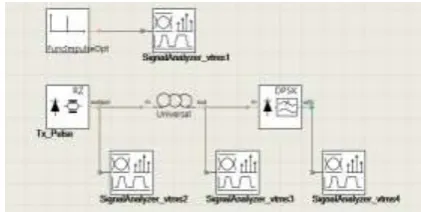
Architecture of Optical Communication System Based on VPI
Figure 1. Optical transmitter composition. Figure 2. Optical communications system components.
Experiment and Performance Analysis
System Basic Simulation Settings and Results
[image:2.595.314.525.70.176.2]The system default setting parameters are shown in Table 1. The experiment observes and analyzes the performance of the signal by changing the system parameters such as the signal rate of the global parameter and the local module parameters, BitRateDefault, and the fiber length.
Table 1. Default parameter settings.
Default parameters Default value
BitRateDefault 10GHz
TimeWindow 1024/10e9s
SampleRateDeafult 16*10e9bit/s
Length 1e3m
Attenuation 0.2e-3dB/m
In the other values are taken to the default value of the case, the optical transmitter output signal, the optical output signal and the optical receiver output signal shown in Figure 3 (a), Figure 3 (c) and Figure 3 (e). The receiver's spectrum bandwidth followed by about -12.7dbm, -12.93dbm, -58.13dbm. According to the shape of the eye diagram shown in FIG. 3 (b), FIG. 3 (d) and FIG. 3 (f), it can be judged that the signal output is good.
(a) Optical transmitter signal spectrum (b) Optical transmitter signal eye diagram
[image:3.595.102.502.71.183.2]
(e) Optical receiver signal spectrum (f) Optical receiver signal eye diagram
Figure 3. Default parameter output signal diagram.
The Effect of Fiber Length on System Performance
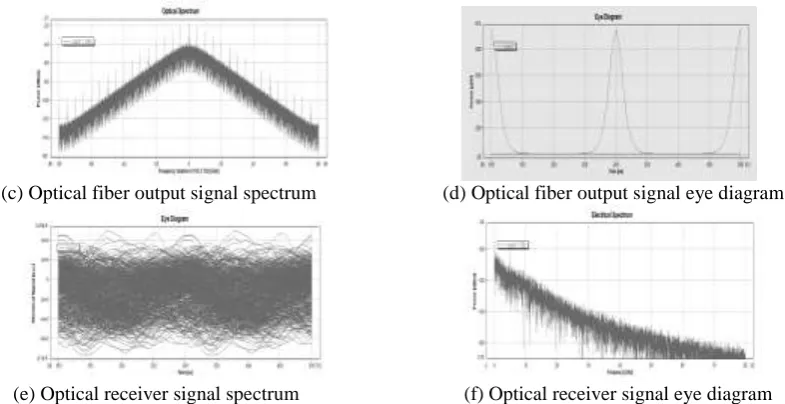
In the case of other values are the default value, set the optical fiber length L1 = 10e3m, observe and analyze the effect of optical fiber length on the optical output signal and optical receiver output
signal. The experimental resultsareshown in Figure 4.
(a) Optical fiber output signal spectrum (b) Optical fiber output signal eye diagram
[image:3.595.99.501.268.480.2]
(c) Optical receiver signal spectrum (d) Optical receiver signal eye diagram
Figure 4. Output signal diagram when changing the fiber length.
Comparison of Fig. 4 (b) with Fig. 3 (d) and Fig. 4 (d) with Fig. 3 (f) respectively shows that the
longer the optical fiber length, the smaller the opening angle of the eye. Comparing Fig.4 (a) with
Fig.3 (c) and Fig.4 (c) with Fig.3 (e) respectively, the spectrum waveform at the output end of the fiber varies slightly, but it can still be noticed that the spectrum with long fiber length is slightly broadened, with peak bandwidth of -42 db and -39 db.
The Effect of the Bit Rate on the Performance of the System
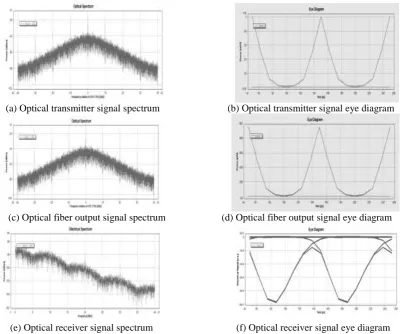
In the case of other values are the default values, set the bit rate of the optical transmitter B1 = 5e9, observe and analyze the effect of optical transmitter bit rate on the optical transmitter output signal, the optical output signal and the optical receiver output signal. The experimental results are shown in Figure 5.
[image:3.595.337.485.655.736.2]
(c) Optical fiber output signal spectrum (d) Optical fiber output signal eye diagram
[image:4.595.101.494.71.273.2]
(e) Optical receiver signal spectrum (f) Optical receiver signal eye diagram
Figure 5. The output signal when changing the transmitter bit rate.
When the bit rate of the optical transmitter becomes half of the original one, as shown in Figure 5 (a) and Figure 5 (b), the waveform density of the electrical signal of the transmitter is doubled and the quality of the eye diagram is less affected. The waveform density of the spectrum shown in Fig. 5 (c) doubles and the influence of the quality of the eye pattern shown in Fig. 5 (d) is small. The higher the transmission rate, the lower the noise performance and the longer the relay transmission distance. In the optical receiver section, comparing Fig. 5 (e) with Fig. 3 (e) shows that the bit rate is too small and can not accurately receive the signal. Comparison of Figure 5 (f) with Figure 3 (f) can be found that the eye quality is poor, serious distortion.
The Effect of Global Bit Rate on System Performance
In the case of other values are the default values, set the global variable bit rate B1 = 5e9, observe and analyze the effect of global bit rate on the optical transmitter output signal, optical output signal and optical receiver output signal. The experimental results are shown in Figure 6.
(a) Optical transmitter signal spectrum (b) Optical transmitter signal eye diagram
(c) Optical fiber output signal spectrum (d) Optical fiber output signal eye diagram
[image:4.595.93.508.469.769.2]
(e) Optical receiver signal spectrum (f) Optical receiver signal eye diagram
When the global variable signal rate is less than the local module signal rate, comparing Figure 3 with Figure 6 we can find that the global variable in the signal rate becomes smaller, the signal spectrum width will be reduced, the high-frequency signal power amplitude fall faster, and the quality of the eye diagram drops, especially the quality of the eye diagram of the optical receiver. Therefore, when the global bit rate becomes smaller, the spectrum width becomes narrower and the signal quality decreases.
The Effect of the Global Sampling Rate on System Performance
In the case of other values are the default value, set the sampling rate of the original one-half, observe and analyze the effect of sampling rate on the optical transmitter output signal, optical output signal and optical receiver output signal. The experimental results are shown in Figure 7.
(a) Optical transmitter signal spectrum (b) Optical transmitter signal eye diagram
(c) Optical fiber output signal spectrum (d) Optical fiber output signal eye diagram
[image:5.595.97.505.221.555.2]
(e) Optical receiver signal spectrum (f) Optical receiver signal eye diagram
Figure 7. The output signal when changing the global sampling rate
The sampling rate is the ratio of the total sampled data points to the time window. When the sampling rate becomes half, as shown in Fig. 7 (a), Fig. 7 (c) and Fig. 7 (e), the waveform density of the spectrum is increased. As shown in Fig. 7 (b), Fig. 7 (d), and Fig. 7 (f), the shape of the eye becomes less smooth as before, but the shape is similar. Therefore, when the sampling rate increases, the spectral width decreases, the signal quality changes little.
Summary
Acknowledgement
We gratefully acknowledge anonymous reviewers who read drafts and made many helpful suggestions. This work is supported by the National Science Foundation Project of P. R. China (No.61402529); the Natural Science Basic Research Plan in Shanxi Province of China (No.2015JQ6266); the Basic Research Foundation of Armed Police Engineering University (No.WJY201417, No.JLX201645).
References
[1] Wu Q W. Multi - Domain ASON Damage Detection Multicast Routing Algorithm Based on Hypergraph Model [J]. Journal of Optoelectronics. Laser, 2016(07): 722-729.
[2] Shen J H, Cheng J. Optical fiber communication system [M]. Beijing: China Machine Press, 2014.
[3] Zhang R F,Cheng G L,Gao H. Research on VPI Simulation of Wavelength Division Multiplexing System [J]. Science Times, 2007, 9(6):1-5.
[4] Li H Q. Transmission Characteristics of High Speed Optical Fiber Communication System [J]. Network and Communication Technology, 2016, (4):1-2.