2018 International Conference on Modeling, Simulation and Analysis (ICMSA 2018) ISBN: 978-1-60595-544-5
Study on the Method of Dependence Measure of Durations in
Construction Schedule Network
Jun-wen MO, Jing ZHAO
*and Zhao-ze HE
School of Civil Engineering, Lanzhou Jiaotong University, Lanzhou Gansu 730070, China
*Corresponding author
Keywords: Duration dependence, Pearson product-moment correlation coefficient, Nonlinear structural equation, Network planning technique.
Abstract. Previous research of construction schedule is based on the classic model of network
planning technique as the background, assume the duration of each process were independent of each other in the schedule network planning. In the process of the practical project, each duration of process is not independent of each other, but acting on each other. In this paper, through research, based on a series of assumptions, we used Product-Moment Correlation Coefficient to measure serial dependence between duration variables. We also propose to regard parallel duration dependency, the common influence factors and organization management as potential variables, establishing the nonlinear structural equation model to measure parallel dependency among duration variables. Finally, this paper applies dependence measure and duration forecast considered dependence to a practical project progress network, results show that the method has good applicability and scientificity.
Introduction
Previous research of construction schedule is based on the classic model of network planning technique as the background, the model assumes that the progress of network planning in the duration of each process were independent of each other. In the process of the practical project, each duration of process is not independent of each other, but acting on each other [1]. Battaineh [2] evaluated the progress report of 164 construction projects and 28 highway projects,the results show that the delay resulted from the mutual influence between each duration is universal:average ratio of highway engineering and construction projects to the actual construction period and the duration of the contract plan is 160.5% and 120.3% respectively. A project network plan is connected by the serial process and parallel process through a certain logic relationship and technological relationship. There is serial dependence between the former work and the successor in each line of works theoretically; and parallel work due to the common resource constraints, environmental factors and organizational management also can produce dependence to each other [3]. Based on establishing the network plan model about duration dependence in literature[4], this paper researches the measurement method about serial dependence and parallel dependence, and update the network of progress, apply the reference about the dependence of the progress.
Serial Dependence Measure
In order to measure serial dependence, establishing assumptions firstly:
(1) Assuming that there is a simple linear dependence between the serial processes, ignoring other nonlinear relationships;
(2) Assuming that the related duration data obey β distribution, and the parameter obtained from experienced engineering personnel according to some corresponding data of the existing project or similar projects
The Pearson product-moment correlation coefficient between the two variables is defined as quotients between the covariance of these two variables and the product of the two standard deviations, namely:
XY
( ) ( )
cov( , )
= x y
x y x y
E X Y
X Y
(1)
Eq. (1) defines the overall correlation coefficient of working durations, and which is generally represented by the Greek letter ρ. If the covariance and standard deviation of the sample duration instead of the overall covariance and standard deviation of the working durations, the correlation coefficient of the sample duration will be calculated, generally represented by r:
1 2 2 1 1 ( ) ( ) r ( ) ( ) n i i i n n i i i i
X X Y Y
X X Y Y
(2)Because the K. Pearson correlation coefficient mainly describes the linear dependence between random variables, the serial duration dependence is measured by the K. Pearson correlation coefficient. Setting (I, J) is a two-dimensional random variables, which represents a set of serial duration variables, and Var(I) >0, Var(J) > 0, then:
I J
( ) ( )
cov( , )
= i j
i j i j
E I J
I J
(3)
When i j =1, the duration variables I and J are completely linear correlation; when i j =0,
the duration variables I and J are not related; when 0< i j <1, the duration variables I and J have a certain extent linear dependence, and the closer i j is to 0, the weaker the linear dependence
between duration variables I and J is; the closer i j is to 1, the stronger the linear dependence
between the duration variables I and J is. When i j >0, the duration variables I and J are positive
dependence, when i j <0, the duration variables I and J are negative dependence.
Parallel Dependence Measure
Structural equation modeling is an important tool to study the relationship between observable variables and latent variables, as well as among the latent variables. The parallel duration dependence is an index which can not be directly observed; therefore it is needed to reflect the dependence evenly by calculating the quantity of the indicators which can be directly observed.In this paper, regarding the parallel dependence, the common influence factors and can organizational management as a potential variable,setting up observed variables which can reflect these indicators, and establishing the nonlinear structural equation model to measure the parallel dependencies.
Assumption of parallel dependence measure:
(1) Assuming that there is a nonlinear dependence between the parallel works due to the common influencing factors or management reasons, and the other dependences are ignored.
(2) The fitting regression equation is obtained by using the nonlinear structural equation to reflect the relationship between the parallel dependence and the various influence factors, and to select a factor which has the greatest influence degree as the quantitative index of the parallel dependence.
Selection of Variables
the material usage ratio, machinery shift ratio, capital ratio, the organizational management and the occupation time of working face ratio.The corresponding relations are shown in Table 1.
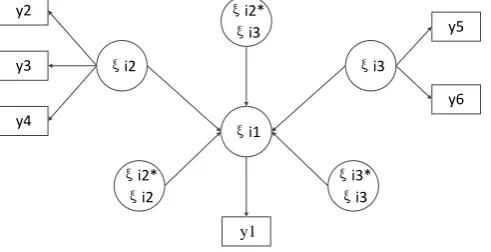
Table 1. Latent variables and observable variables.
Latent variables Observable variables Observation variable description ξi1(dependence) y1 duration time ratio ξi2(common influencing
factors)
y2 material usage ratio y3 machinery shift ratio
y4 capital ratio
ξi3(organizational management)
y5 the ratio of the number of managers
y6 the occupation time of working face ratio
The path diagram of the nonlinear structural equation model is shown in Fig. 1.
ξi1
ξi2*
ξi3
ξi2 ξi3
ξi2*
ξi2
ξi3*
ξi3 y2
y3
y4
y5
y6
y1
Figure 1. Path diagram of the nonlinear structural equation mode.
Nonlinear Structural Equation Model
According to the relevant knowledge of the above nonlinear structural equation model, the following nonlinear structural equation model is established, which is based on the latent variables and the corresponding explicit variables as shown in the table 1.
Measurement equation:
i i i
Y (4) Structural equation:
2 2
1 1 2 2 3 3 2 4 3 5 2 3
i r i r i r i r i r i i i
(5) Eq. (4) and (5), Yi is the 6*1 dimensional explicit variable of the first i individual, μ is the mean
vector of 6*1 dimension, is 6*3 dimensional factor load matrix, ξi is the 3*1 dimension of the latent variables, and ξi~ N(0,Φξ), εi is 6*1 dimensional random measurement error, and ε~ N(0,Φε). r is the coefficients to reflect the relationship among latent variables ξi1 and ξi2, ξi3. Δ~ N (0,Φδ) and it is independent of each other with ξ.
Parallel Duration Dependence Measure
Through the WinBUGS software the required sample of the Bias analysis can be extracted from the joint distribution of the arbitrary unknown parameters, and then according to the sample, the parameters of the model and the unknown quantity can be obtained, in addition to the Bayesian estimation and its standard deviation can be obtained.
Because the influence degree of each influencing factor to the duration dependence of the parallel work is not the same, namely |ri| is different, the bigger it is, the greater the degree of influence on the
parallel duration dependence and on the contrary, the influence degree is smaller.Therefore, the factors that influence the parallel duration dependence lowly is ignored,selecting the maximum value of |ri| as
[image:3.595.177.423.262.388.2]τij = max {ri| max |ri|, i≠j (6) where, ri>0 indicates that the corresponding influence factors have a favorable effect on the parallel
duration dependence, and the durations of the two parallel work may be shortened; ri <0, which
indicates that the corresponding factors have a negative effect on the duration dependence of the parallel work, and the durations of the two parallel works may increase.
Empirical Research Project Overview
This project is a single building for a company to develop a multi-story and high-rise residential buildings of large-scale projects. The scope of the project construction includes: foundation, underground structure, the main structure, building decoration, the roof of the building, construction of water supply drainage and heating, construction, electrical, fire protection, intelligent building, ventilation and air conditioning and energy saving et al.
Logical Relations between Processes and Single Node Network Planning
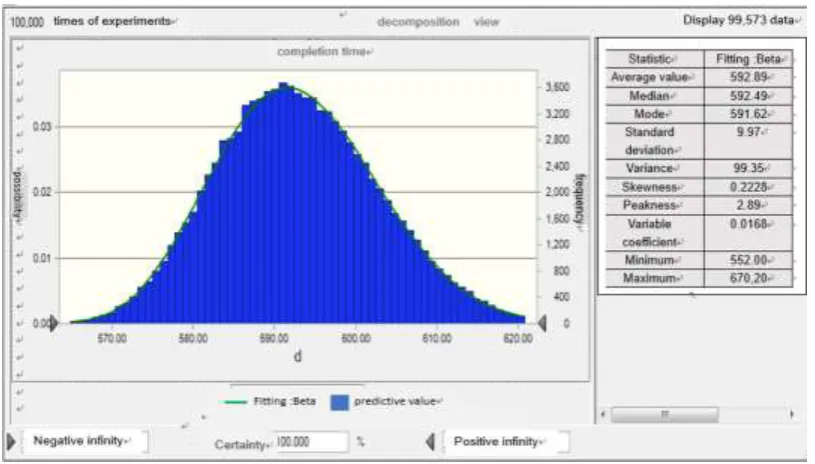
[image:4.595.51.546.341.711.2]In this paper, the work and the logical relations between the works and three point estimating of working duration as shown in Table 2.
Table 2. Logical relations between the works and three Point estimating of working duration.
Task
classification Node Name Successor
Minimum time
Most likely time
Maximum time
Pile foundation engineering
A Pressure test pile E、F、D 6 10 15
B Pipe Engineering F、H 20 25 33
C Piles test pile E、F、G 5 10 17 D Engineering pouring pile I 20 30 43 E Project supporting pile, water stop curtain I 19 25 33
F Pile test K 10 15 23
G Precipitation well construction J 16 25 39
H Basement excavation crown beam, ring
beam construction I 8 15 27
I Concrete ring beam curing L、M、N、
K 8 15 28
Dewatering well construction
J Precipitation well work T 70 90 120
Basement Construction
K Basement earth excavation P 16 30 48
L Cut pile P 18 30 40
M Cushion construction O 26 32 44
N Precipitation well construction S 21 28 39 O Basement structure construction U 78 90 120
Balcony foundation construction
outside Basement
P Foundation Construction gallery R、Q 5 8 18
Q Cushion construction T 5 10 25
R Trench Inspection T 4 7 10
S Precipitation well construction T 6 10 15
T Construction of foundation and basement
gallery U 24 30 42
Construction of standard
layer
U Basement Balcony standard outer layer
construction — 380 403 440
Str
C
B
A
G
E
F
H
D
I K P Q T U Fin
O M
L J
N
[image:5.595.101.495.68.243.2]R S
Figure 4. Single node network diagram.
Duration Prediction and Completion Probability
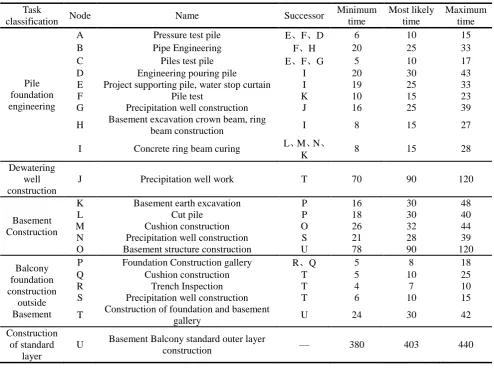
Utilizing Monte Carlo method to simulate the duration of the project can be simulated is 592.89 days, the standard deviation is 9.97, the duration of the project is 552 days, and the maximum is 670.2 days, as shown in Fig.5.At the same time, there are two key lines in Fig.4, which are B, H, I, M, O, U and A, D, I, M, O, U respectively.
Figure 5. Duration simulation data.
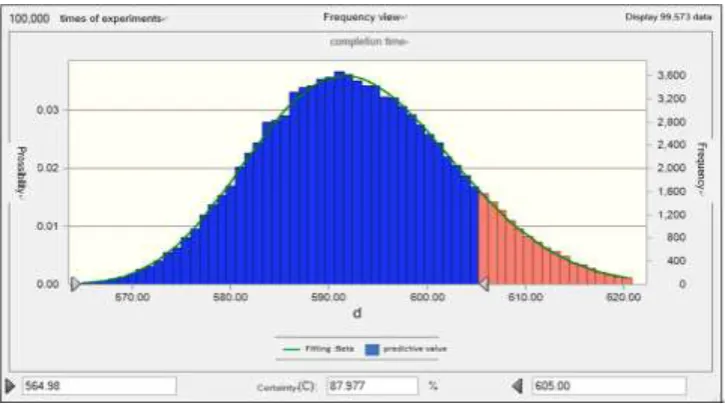
[image:5.595.95.503.351.583.2]Figure 6. Estimation of completion probability.
Conclusions
This paper mainly measures the dependence of duration variable in the network of progress. Considering the duration dependence can reflect the real inner link between duration, get closer to the forecast consequence of construction period in practical situation. From the practical simulation results, this method has good applicability and high efficiency.
Acknowledgement
This project was supported by the National Natural Science Foundation of China, Project No. 70961004.
Reference
[1] Junwen Mo, Yilin Yin and Mingxia Gao, State of the art of correlation-based model of project scheduling networks [J]. IEEE Transactions on Engineering Management, Vol.55, No.2, May, 2008. pp. 349-358.
[2] Battaineh H.T. Information system of progress evaluation of public projects in Jordan [D]. Department of Civil Engineering, Jordan University of Science and Technology, Jordan, 1999.
[3] Junwen Mo. Study on the dependence of duration in project scheduling network[D]. Tianjin University, 2010.12.