2017 3rd International Conference on Electronic Information Technology and Intellectualization (ICEITI 2017) ISBN: 978-1-60595-512-4
Dimensionality Reduction of Image Feature
Based on Mean Principal Component Analysis
Xia Sun, Qingmei Wang, Ruifu Zhang and Xiang Liu
ABSTRACT
With the development of computer vision and various advanced medical imaging devices, medical images contain more and more information. It is difficult to accurately express the characteristics of medical images with a single image feature, and it is not convenient for later diagnosis and recognition processing. In this paper, the chest CT images of children were used as research objects. Its colour features, texture features and shape characteristics were extracted. The main component analysis method is an effective method to reduce the characteristic redundancy. However, considering the limitations of principal component analysis in data standardization, in this research, the method of mean principal component analysis is used to reduce the characteristics of extraction. Experiment result shows that this method achieves a higher contribution rate with fewer dimensions. The conclusions of this research are beneficial to image recognition research.
INTRODUCTION
Feature dimension reduction is a process of selecting a low-dimensional feature set from the initial high-dimensional feature set to optimize the feature space according to a certain evaluation criterion. This process is usually used as a pre-processing step for machine learning [1]. Feature reduction has been widely studied since 1970s. The high dimensional feature data contains a large number of irrelevant ________________________
Xia Sun, Qingmei Wang, Xiang Liu, National Center for Materials Service Safety, University of Science and Technology Beijing, Beijing 100083, China.
and redundant information, which can greatly reduce the performance of the image recognition algorithm. Therefore, it is necessary to reduce the dimension of the high-dimensional data.
At present, the feature reduction methods can be divided into two categories, linear methods and nonlinear methods [2]. The linear representation methods include Principal Component Analysis (PCA) and linear Discriminant Analysis (LDA). These methods have formed a complete theoretical system and have shown good performance in applications [3]. As for the nonlinear dimensionality reduction method, the more representative is the kernel based method and the method based on manifold learning method [4].
The dimension of image feature vector is too high, the data volume is large, and there is a large amount of information redundancy between the features. Principal Component Analysis (PCA) is one of the common and effective method of dimensionality reduction of feature level data. By means of principal component, the method presented in this paper not only eliminates the redundant information between features, but also reduces the dimension of feature space, and retains the required identification information [5]. PCA is a well-known algorithm for data dimensionality reduction and feature extraction which can transform high-dimensional original data vector into a low high-dimensional vector with uncorrelated components. It is an unsupervised method based on statistical analysis without prior knowledge. [6]
MEAN VALUE METHOD
The principal component analysis is based on the covariance matrix. Different dimensions and orders of magnitude are obtained with different covariance, the principal components will vary between dimension and the change of the order of magnitude. A general way to solve this problem is to standardize the original data.
proved two theorems: First, the principal diagonal element of the covariance matrix of averaging data is the square of the coefficient of variation of each index. Second, the mean processing of raw data does not change the correlation coefficient between the indicators. The averaging process of raw data not only eliminates the influence of the dimension and quantity of the index, but also reflects the difference and mutual influence degree of each index in the original data.
With n CT images, P feature extraction of each image, original feature set is
( ij n p)
X x (1)
The mean value of the original data feature is
1
1
, 1, 2, ,
n
j ij
i
x x j p
n
(2)
Oder:
, 1, 2, , ; 1, 2, ,
ij ij
j
x
z i n j p
x
(3)
Where: zij is averaged data of original data xij.
Compared with the standardization method, the results obtained by means of averaging are more accurate. In this paper, the method of data averaging has used to pre-process the extracted image features.
MEAN PRINCIPLE COMPONENT ANALYSIS
Principal component analysis (PCA) has been widely used in many fields such as signal processing, image processing, pattern recognition and so on [8]. Principal component analysis (PCA) is a statistical analysis method, which can grasp the main contradiction of things, get the main factors from the high dimensional attributes, reveal the essence of things, and simplify the complex problems. It can reduce the dimension of feature space by creating new features by the linear combination of original features. Here is the steps of the mean principal component analysis:
1) The mean processing of original feature set data:
Where: 1
1
, 1, 2, ,
n
j ij
i
x x j p
n
.5
2) After averaging, the covariance matrix of each characteristic is calculated:
( ij)p p
V v (5)
Where: ij ij i j s v x x .
3) Computing the eigenvalues of covariance matrix V, arrange them in order of size ( 1 2 p 0 ), and the corresponding orthogonal unit
feature vector ( 1, 2, ,p), where i ( i1, i2, ,ip) ( i1, 2, , )p .
The eigenvalue is the variance of each principal component, which reflects the influence of each principal component.
4) The variance contribution rate and cumulative variance contribution rate of each principal component were calculated.
1
( 1, 2, , )
i i p j j i k
(6) 1 1 ( ) k i i p i i k
(7)The greater the ( )k , the more the original information contained in the previous K principal components.
5) Determining principal components according to the principle of cumulative contribution rate not less than a threshold (such as 95%). Set the K principal component is 𝑦𝑖 = 𝛼𝑖1𝑧1+ 𝛼𝑖2𝑧2+ ⋯ + 𝛼𝑖𝑝𝑧𝑝 (𝑖 = 1,2, ⋯ , 𝑘) . Where 𝑧𝑗 = (𝑧1𝑗, 𝛼2𝑗, ⋯ , 𝑧𝑛𝑗)′, and 𝑧𝑖𝑗 is the mean value of 𝑥𝑖𝑗.
EXPERIMENT & RESULT ANALYSIS
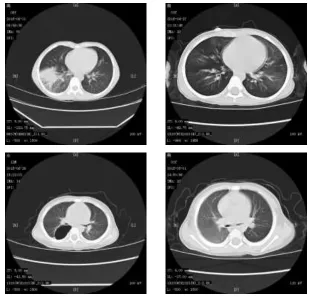
MATLAB software is used to analysis the data and extract the features from CT images (Table 1). The six dimensional colour feature was extracted using the grayscale histogram; the ten dimensional texture feature was extracted using a gray-level co-occurrence matrix and seven invariant moment eigenvalues are extracted by using the invariant moment feature extraction method.
Figure 1. Chest CT images of children.
TABLE I. FEATURES OF CHEST CT IMAGE.
Histogram-based color feature Texture feature based on
gray-level co-occurrence matrix
Shape feature based on moment invariants
6.651371786 0.026128704 53.01521169
17.49084613 0.00402086 78.68517303
26.58109709 4.138242009 6516.878236
24.78506728 0.111243442 0.009320908
51.67546361 10.52097222 1.181761176
.35.01962528 3.291852585 2.298446063
0.040907993 5.63102253
[image:5.612.91.502.528.676.2]Figure 2. Standardized principal component analysis.
As shown in Figure 2, the principal component analysis of the original feature set data needs to choose seven principal components to meet the requirements of cumulative contribution rate, and the cumulative contribution rate is up to 96.36%.
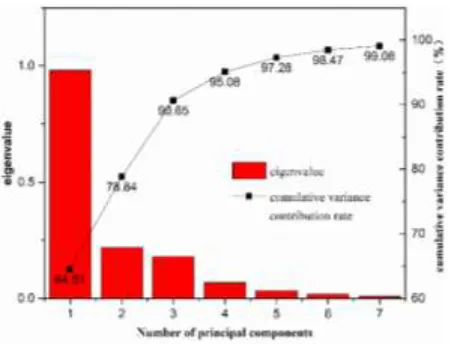
As shown in Figure 3, the original feature set has been analysed by principal component analysis method after mean processing. The cumulative contribution rate of the top five principal components is 97.28%.
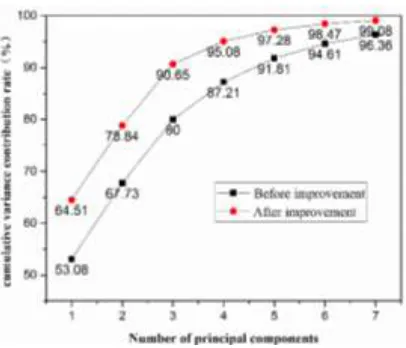
[image:6.612.185.410.426.598.2]Figure 4. Cumulative contribution rate of principal components before and after improvement.
As shown in Figure 4, the cumulative contribution rate of different cumulative number was higher than that the cumulative contribution rate before the improvement. Therefore, the mean principal component analysis method can get higher cumulative contribution rate with fewer principal components, and more information can be represented with fewer dimensions.
CONCLUSIONS
Feature reduction can effectively eliminate the irrelevant and redundant features of image samples, which is of great significance for image recognition. In this paper, the standard principal component analysis method and the mean principal component analysis method has been used and tested, the experimental results shows that the mean principal component analysis method can achieve higher contribution rate with fewer principal components and reduce the eigenvalues dimension of CT image.
The conclusions of this study are very important for developing the technology of CT image recognition.
REFERENCES
1. Jie, H. U. 2008. “Survey on feature dimension reduction for high-dimensional data,” Application
Research of Computers,25(9), 2601-2606.
2. Zhang, J., Dong, J. Y., & Wang, Y. 2006. “Current situation and progress of the study on
measurement geometry of total knee prosthesis and its application features,” Chinese Journal of
3. Griebel, M., & Hullmann, A. 2014. “Dimensionality reduction of high-dimensional data with a
nonlinear principal component aligned generative topographic mapping,” Siam Journal on
Scientific Computing,36(3).
4. Wang, Jianzhong, 2010. "Dimensionality Reduction Algorithms Based on Manifold Learning
and Their Applications to Face Recognition," Diss.
5. Song Yuqing, Chen Jianmei, Guo Yizheng, Wang Chunhong, 2008. “Research on multi-feature
medical image recognition based on data fusion,” Application Research of Computers,25(6),
1750-1752.
6. Xie, Y., & Zhang, T. 2015. “A fault diagnosis approach using SVM with data dimension
reduction by PCA and LDA method,” Chinese Automation Congress (pp.869-874). IEEE.
7. Ji, R. 2001. “Improvement of Data Processing Method in Principal Component Analysis,”
Journal of Shandong University of Science and Technology, 26(5), 95-98.
8. Yu, C., Guo, X., Zhang, A., & Pan, X. 2007. “An Improvement Algorithm of Principal
Component Analysis,” International Conference on Electronic Measurement and