2017 2nd International Conference on Computer Science and Technology (CST 2017) ISBN: 978-1-60595-461-5
Design and Implementation of Information
Management System for Rice
Rong-rong FAN
1, Hui XU
1,a*and Li-ting LEI
21College of Computer Sci.&Tech, Nantong University, Nantong, China,
2College of Electronic Information, Nantong University, Nantong, China,
*Corresponding author
Keywords: Information Management, Quality and Safety, Yield Prediction.
Abstract. In order to strengthen the management of the quality and safety of agricultural products, to rice as the object, based on the rice production and supply chain, this paper designs an information management system for rice. Using .Net platform, MVC4 framework and other technologies for the construction and development of the system, to achieve the rice from cultivation to sales of the whole process of information management, effectively strengthen the supervision of the quality and safety of rice; The data were processed and analyzed, and the prediction of rice yield was realized by multiple linear regression algorithm, which promoted the process of modern agricultural informatization.
Introduction
In recent years, China's modern agriculture has been rapid development, with the application of information technology in agriculture; agricultural production is also in progress. At present, although the level of agricultural modernization in China has been greatly improved, but there is still a certain gap between the level of agricultural information and agricultural product quality and safety management compared with developed countries [1]. At the same time, with the improvement of people's living standard and quality of life, more and more people begin to pay attention to diet and health. However, due to the lack of legal awareness of certain agricultural producers, the pursuit of profits, so that food safety issues, fake problems have occurred sometimes [2]. Hunan cadmium rice, Wuchang rice fake and other events, causing public concern about the safety of rice.
This paper aims to design a set of rice farming information management system, which is convenient for producers to scientifically and effectively manage the cultivation of rice and to supervise the government departments. At the same time, consumers can trace the source according to the two-dimensional code generated by the system, to protect their own right to know.
System Design
Requirements Analysis
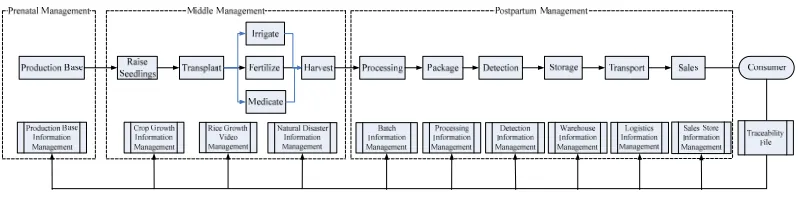
middle of rice production, once the middle of which there is a problem, in a timely manner to deal with the recall, to avoid the consumer to bring security risks; The other is the reverse traceability process, that is, the process of consumer traceability, consumers can scan the two-dimensional code on the packaging bag, to understand the whole process of rice production and supply of information files [3].
Figure 1. System flow chart.
System Role Design
According to the system flow chart, combined with the actual situation, the role of the system is divided into four categories: consumers, enterprises, the third-party regulators and system administrators [4]. Consumers that the front-end user, which can scan the two-dimensional code to view the traceability of rice files; Enterprise is the background information management system users, including production base, processing, transportation and other related enterprises, is the provider of system information; Third party regulatory agencies, mainly testing departments, local governments and other components, is responsible for monitoring the quality and safety of rice; System administrator, is mainly responsible for the operation and maintenance of the entire system, including user management, log management, etc.. System Overall Frame Design
The rice farming information management system is composed of two parts: Web terminal of information management system and mobile terminal of traceability system. Web-side information management system is mainly used to enter the relevant information of each link to ensure the continuity of information in each link; Secondly, the data analysis, the realization of the function of yield forecast, to provide users with reference to guide the production of rice. Mobile terminal of traceability system is mainly to facilitate consumers to view trace files.
The system is based on the B/S structure of the WEB application, the system uses three layer architecture development model, as shown in Fig. 2, divided into data access layer (DAL), business logic layer (BLL), interface layer (UI) . Among them, the interface layer using ASP.NET MVC4 framework for development.
[image:2.612.194.418.594.702.2]System Function Module Design
According to the system flow chart and demand, the rice information management system can be divided into seven modules: crop growth, yield prediction, product detection, processing and transportation, enterprise management, information statistics and system management.
(1) Crop growth module. This module is responsible for the management of rice seedling, transplanting, fertilization, irrigation and other agricultural operation information, to provide traceability as a source of data for growth.
(2) Yield prediction module. This module uses multiple linear regression algorithm to predict rice yield by using historical Yearbook and monitoring data, to provide users with reference.
(3) Product detection module. The module is responsible for the management of product testing records, when the test information entry, the need to upload the electronic version of the test report, to ensure the accuracy of the data.
(4) Processing and transportation module. The module is responsible for the management of rice batch, processing, transportation, warehousing, logistics and other information, which belongs to the post-natal management stage of rice. Among them, the rice planting records and rice batches need to correspond, and each batch of rice only to generate a two-dimensional code, if the product has not been tested or product testing failed, it cannot generate two-dimensional code.
(5) Enterprise management module. This module is responsible for the management of production base information, enterprise information, brand information and product information.
(6) Information statistics module. The module is used to count the rice diseases and insect pests, fertilization, natural disasters and other aspects of statistics, free to choose a number of batches of rice for comparison, to facilitate experts, production base staff, etc.
(7) System management module. This module contains two aspects: user management and log management. The system administrator is responsible for the management and maintenance of the system administrator.
System Implementation
The Realization of Characteristic Function -- Yield Forecast Module
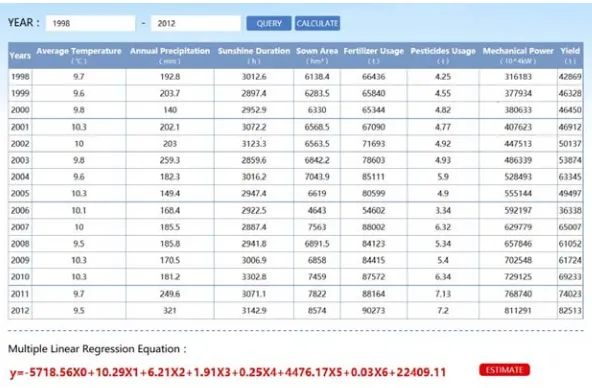
This paper collected the average annual temperature (℃), annual precipitation(mm),
sunshine hours(h), sown area(hec),fertilizer usage(ton),pesticide
usage(ton),mechanical power(GW) and rice yield(ton) from 1998 to 2015 in Ningxia
Statistical Yearbook. The average temperature(X0), annual precipitation(X1), sunshine
hours(X2), sown area(X3), fertilizer usage(X4), pesticide usage(X5) and mechanical
power(X6) as independent variables, the rice yield (Y) as the dependent variable, were
drawn scatter diagram. The results show that the seven independent variables and the dependent variables are approximately linear distribution, so we can establish a multiple linear regression model. The multiple linear regression equation is shown in Eq. 1:
Y= c0X0 + c1X1 + c2X2 + c3X3 + c4X4 + c5X5 + c6X6 + c7. (1)
In the Eq. 1, c0, c1 ,…, c6 were the corresponding regression coefficient; C7 was the
data from 2013 to 2015 were used as the test set, and the system was calculated by multiple linear regression algorithm. As shown in Fig. 3 , we can see that the regression equation is:
[image:4.612.167.463.137.331.2]Y=-5718.56X0+10.29X1+6.21X2+1.91X3+0.25X4+4476.17X5+0.03X6+22409.11
Figure 3. Multiple linear regression equation.
By calculation, multiple correlation coefficient r=0.99595, close to 1, indicating that the relative error is close to 0, so the linear regression effect is good. And then F test,
can get F=32.92, Sig.=0<0.005.Therefore, the model has significant statistical
significance.
The comparison of the estimated and actual values of rice yield from 2013 to 2015 is shown in Table 1. As can be seen from Table 1, the relative error between the actual value and the error value is 0.007%, -0.05% and 0.01%, respectively, we can see that the prediction effect is good.
Table 1. Rice yield fitting degree analysis table.
Year Actual value (t) Estimated value (t) relative error (%) 2013 87419 87425 0.007 2014 86956 86912 -0.05
2015 90181 90190 0.01
Users can refer to the rice yield prediction model, adjust the production mode, guide the management of rice production, promote the increase of rice production, but also use the monitoring data to predict the rice yield.
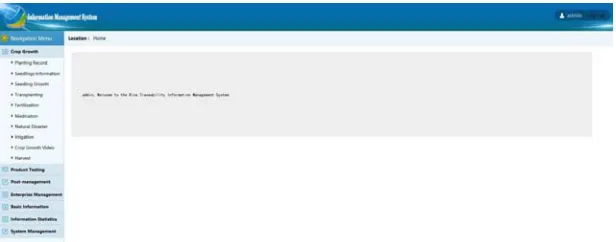
Web Terminal
Figure 4. Information management system home page.
Information management system is built with ASP.NET MVC4 framework, so you can use MVC4 new features, ASP.NET Web API. This system is the direct use of NuGet package manager to add the Web client library to the project, through the docking code directly in the system call API interface. Among them, the two-dimensional code is called the tops can API interface, the interface can not only pass Logo icon address, and if the content parameters to pass a simple http: // format link address, then the phone will automatically redirect to the scan Http: // link address; The graphical display is called the JavaScript diagram library echarts, echarts is a pure JavaScript graphical library that provides intuitive, vivid, interactive, customizable data visualization charts; The document editor is called the KindEditor API interface, KindEditor is based on the plug-in design, all the features are plug-ins, according to the needs of the increase or decrease function, the use of flexible, fast loading, and compatible with many browsers.
Mobile Terminal
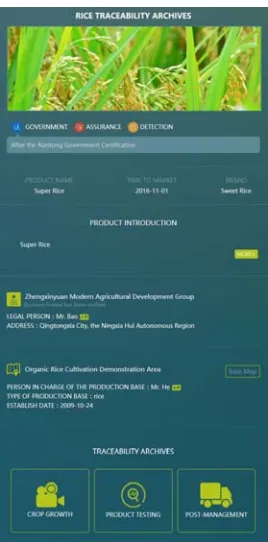
Mobile end traceability system is for consumers, consumers scan two-dimensional code on the packaging bag through the phone, view the product traceability files, as shown in Fig. 5. Nowadays, the rapid development of intelligent mobile phone market, consumers may have different models, so when develop the traceability system, we should pay attention to the size of the page, compatibility and other issues, system testing can use Chrome browser to simulate different types of mobile phone access to the page.
Conclusions
Figure 5. Traceability interface.
References
[1] Q.F. Xing, X. Wang. Study on Rice Planting Management Information System in Cold Region, Journal of Agricultural Mechanization Research. 6 (2015) 77-80.
[2] H.W. Bai, A.D. Sun, J. Chen. Traceability System of Quality and Safety of Agricultural Products Based on Internet of Things, Journal of Jiangsu Agricultural Sciences. 29 (2013) 415-420.
[3] B. Li. Design and Development of Traceability System of Agricultural Products - Taking Harbin Hami as an Example, Xinjiang Agricultural University, 2014.