SPECTRAL CHARACTERISATION OF THE NKPULSE POSITION
MODULATION FORMAT
Journal: Electronics Letters Manuscript ID: ELL-2005-3277 Manuscript Type: Letter
Date Submitted by the
Author: 13-Sep-2005
Complete List of Authors: Cryan, Bob; University of Northumbria
Menon, Mahesh; University of Northumbria, School of Computing, Engineering & Information Sciences
SPECTRAL CHARACTERISATION OF THE nk PULSE POSITION
MODULATION FORMAT
R. A. Cryan, M Menon
Indexing terms: nk-PPM, PSD, PPM
k
n pulse position modulation (PPM) is a new modulation format that has recently
been proposed for the optical wireless channel. This Letter considers, for the first
time, a full spectral characterisation of nk-PPM and presents original expressions, which are validated numerically, for predicting both the continuous and discrete
spectrum.
Introduction: Conventional n-ary pulse position modulation (PPM) has been
proposed for the optical fibre [1], optical wireless [2] and optical satellite [3] channels
due to its enhanced sensitivity performance. However, this is at the cost of significant
bandwidth expansion and so alternative, more bandwidth efficient schemes, have been
proposed such as multiple PPM [4,5] in which k-pulses are positioned within a time
frame containing S-slots leading to S
k symbols per frame. Unfortunately, S
k is
rarely a power of two, which leads to complex encoding and decoding circuitry. In
[6], a new format, termed as nk-PPM, was proposed for the optical wireless channel.
In nk-PPM, the information is conveyed by the position of k pulses, each within their
own frame of n-slots, giving nk-PPM symbols. By ensuring that n is a power of 2
This Letter evaluates, for the first time, the power spectral density (PSD) of nk-PPM.
By making use of the cyclostationary properties of the modulation format, original
expressions are derived for predicting both the continuous and discrete spectrum and
these are verified numerically by taking the Fast Fourier Transform of the nk-PPM
pulse stream.
Spectral Characterisation: Following the approach outlined in [7] the data pulse
stream can be represented as
( ) ( )
=
= q
q
m t a p t qT
where
{ }
aq is the nk-PPM sequence andp t( )is the pulse shape. To compute thediscrete PSD of m t( ), namely, Smd
( )
f , the statistical correlation function,( ; ) ( ) ( )
m
R t =m t m t+ , must first be averaged over t and then the Fourier transform
taken:
( )
{
( )
}
{ }
E
2 2 2
2
1
;
1 d
m m t
kn j lq kn q
l q
f f f
S f R t
l l
P a e f
T T T
+
= =
=
=
F
where Tf is the nk-PPM frame-time. The term E
{ }
2
1
kn j lq kn q q
a e+
=
represents the
characteristic function of the data distribution on the nk-PPM frame and so makes the
cyclostationary property explicit. Evaluating this and assuming a rectangular pulse of
( )
(
( )
)
2 2 sin 1 sinc sin / p p d ml f f f
t t l l
S f A l f
T T n l nk T
= (1)
where sinc( )x =sin
( ) ( )
x x .The continuous PSD can be determined by evaluating the Fourier transform of the
autocorrelation function of a zero-mean nk-PPM sequence. The autocorrelation
function is given by
( )
{
( ) ( )}
(
)
( )
( ) ( ) = = + + = + = × × E * ,* 2 2
2 2 ; ; M a y z n m
j ynT j zmT j y z t j z
R t M t M t
K n m n
P y P z e e
e e dydz
where K n m na
(
;)
=E{ }
a an m* E{ }
an E{ }
am* . Taking the Fourier transform ofthis gives
( )
{
( )
}
( )
( )
= =
=
= 2 2
1
;
1 1
;
c
M M t
N
j flT a
l n
S f R t
P f K n l e
T N
F
Which, through the contents of the square-brackets, makes the cyclostationary nature
of the sequence explicit. Evaluating this for nk-PPM gives
( )
( )
2
2 1 sin
sinc 1
sin
= f
c
M p p
f
f fT
k k
S f At ft
T n
fT nk
Results: In order to validate the analytic results of (1) and (2), the PSD of nk-PPM
was evaluated numerically using the Fast Fourier Transform. A sampling rate of
256 samples per nk-PPM slot duration was used and 50 FFT’s were averaged in order
to decrease the noise due to the randomness of the data sequence.
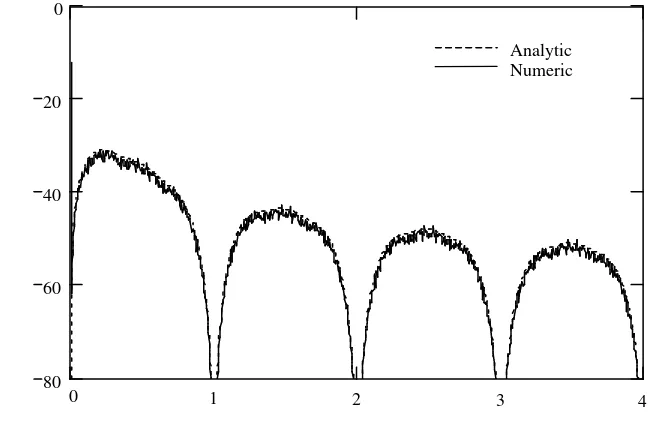
Fig. 1 shows the power spectral density, calculated both numerically and with the new
analytic expressions of (1) and (2), for a 42-PPM system with the pulse width set at
the slot duration, tp =Tf
( )
nk . Note that the frequency axis is normalised to the slotrepetition frequency. As can be seen, there are no discrete lines at the frame
repetition frequency nor the slot repetition frequency. The absence of the discrete
spectrum can be understood by consideration of the 2nd term in (1) which represents
the characteristic function of the probability density function (pdf) of the data
distribution on the frame. As the pdf is uniform there will be no component at the
frame repetition frequency and this is reflected in the sin
( )
l in the numerator of thesecond term of (1). At the slot repetition frequency (when l nk is an integer) the
second term becomes k2. However, for full-width pulses, the nulls of the
sinc-function in the first term occur at the slot repetition frequency and so this masks the
discrete spectrum. At f =0, (1) predicts -12 dB which is in exact agreement with the
numerical results. Fig. 1 also demonstrates that there is excellent agreement between
the numerical and analytical results for predicting the continuous spectrum so
validating the accuracy of expression (2).
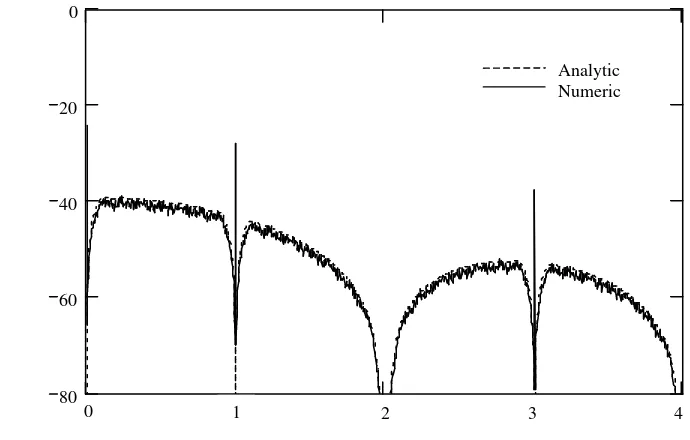
Fig. 2 shows the PSD, calculated both numerically and analytically, for an83-PPM
system with the pulse width set at half the slot duration (tp =Tf
( )
2nk ). Again, theof (1) and (2) for predicting the PSD of nk-PPM. The results demonstrate that there is
a strong discrete line at the nk-PPM slot-rate and so this can be extracted for
synchronisation purposes directly from the pulse stream. Again, due to the uniform
distribution of the data within the frame, no component is available at the frame
repetition frequency and so alternative methods of frame extraction are required. This
may be achieved by following the approach used in conventional PPM [8] through
tracking naturally occurring sequences within the nk-PPM data stream.
Conclusions: Consideration has been given to the spectral characterisation of the new
nk-PPM modulation format and original expressions, which have been validated
numerically using the FFT, presented for predicting both the continuous and discrete
spectrum. It is shown that, due to the uniform data distribution on the frame, there will
be no discrete component at the frame repetition frequency and that when full-width
rectangular pulses are deployed, there will be no discrete component at the
slot-repetition frequency. However, both slot and frame synchronisation can be facilitated
by careful choice of the pulse shape and by tracking naturally occurring sequences
References
1. CRYAN, R.A., UNWIN, R.T., GARRETT, I. SIBLEY, M.J.N., CALVERT,
N.M.: ‘Optical fibre digital pulse position modulation assuming a gaussian
pulse shape’, IEE Proc. J. Optoelectronics, 1990, 137, (4), pp. 89-96.
2. LEE, D.C., KAHN, J.M. ‘Coding and equalization for PPM on wireless
infrared channels”, GLOBECOM 98, 1998, Vol. 1, pp. 201-6.
3. CRYAN, R.A., PHILLIPS, A.J., SENIOR, J.M. ‘Novel laser intersatellite
system employing optically preamplified PPM receivers’, IEE Proc.
Communications, 1995, 142, (1), pp. 15-20.
4. SUGIYAMA, H., NOSU, K. ‘MPPM: A method for improving the
band-utilization efficiency in optical PPM’, J. Lightware Tech., 1989, 7, (3), pp.
465-72.
5. PARK, H., BARRY, J.R. ‘Trellis-coded multiple pulse position modulation
for wireless infrared communications’, IEEE. Trans. Commun., 2004, 52, (4),
pp. 643-51
7. CRYAN, R.A. ‘Spectral characterisation of dicode PPM format’, Electron.
Lett., 2005, 41, (3), pp. 149-51.
8. ELMIRGHANI, J.M.H., CRYAN, R.A., and CLAYTON, F.M.: ‘Theoretical
characterisation and practical implementation of optical fibre PPM self
synchronised sequences’, European. Trans. on Communications, 1994, 5, (3),
pp. 397-404
Author affiliation:
R.A. Cryan and M. Menon (School of Computing, Engineering and Information
Sciences, Northumbria University, Ellison Building, Newcastle-upon-Tyne, NE1 8ST,
United Kingdom)
Figure captions:
Fig. 1 Power spectral density of nk-PPM with n=4 and k =2
Figure 1
0 511.5 1023
80 60 40 20 0
Frequency (normalised to slot-rate)
P
o
w
er
S
p
ec
tra
l
D
en
si
ty
(d
B)
xm zm
m
1 2 3 4
Figure 2
0 511.5 1023
80 60 40 20 0
Frequency (normalised to slot-rate)
P
o
w
er
S
p
ec
tra
l
D
en
si
ty
(d
B)
zm ym
m
1 2 3 4