The London School of Economics and Political Science
Essays on Contract Design in
Behavioral and Development
Economics
Jonathan de Quidt
February 2014
Declaration
I certify that the thesis I have presented for examination for the PhD degree of the London School of Economics and Political Science is solely my own work other than where I have clearly indicated that it is the work of others (in which case the extent of any work carried out jointly by me and any other person is clearly identified in it).
The copyright of this thesis rests with the author. Quotation from it is permitted, provided that full acknowledgement is made. This thesis may not be reproduced without my prior written consent.
I warrant that this authorisation does not, to the best of my belief, infringe the rights of any third party.
I declare that my thesis consists of approximately 50,000 words.
Statement of Conjoint Work
Abstract
This thesis consists of three chapters that fall under the broad banner of contract theory, applied to topics in behavioral and development economics.
Empirically, labor contracts that financially penalize failure induce higher effort provision than economically identical contracts presented as paying a bonus for success. This is puzzling, as penalties are infrequently used in practice. The most obvious explanation is selection: loss averse agents are unwilling to accept such contracts. In the first chapter, I formalize and experimentally test this intuition. Sur-prisingly, I find that workers were 25 percentmorelikely to accept penalty contracts, with no evidence of adverse selection. Penalty contracts also increased performance on the job by 0.2 standard deviations. Finally, I outline extensions to the basic theory that are consistent with the main results.
The second chapter analyzes the effect of market structure in microfinance on borrower welfare and the types of contracts used. We find that market power can have severe implications for borrower welfare, while despite information frictions, competition delivers similar borrower welfare to non-profit lending. We also find that for-profit lenders are less likely to use joint liability than non-profits, which is consistent with some empirical stylized facts suggesting a decline in use of joint liability. We simulate the model to evaluate quantitatively the importance of market structure for borrower welfare.
Acknowledgements
The work contained in this thesis has benefited from the help and support of many people. I am immensely grateful to Maitreesh Ghatak, Greg Fischer and Gharad Bryan for their guidance and encouragement throughout, as well as to Oriana Bandiera, Tim Besley, Robin Burgess, Matthew Levy, and Gerard Padró i Miquel and many others for helpful comments and discussions.
I gratefully acknowledge financial support from the Economic and Social Re-search Council, and funding from STICERD for the experiment described in the first Chapter.
Thanks go to all my friends and colleagues, especially Michael Best, Konrad Burchardi, Can Celiktemur, Jonathan Colmer, Kara Contreary, Laura Derksen, Erika Deserranno, Thiemo Fetzer, Jason Garred, Selim Gulesci, Sam Marden, Luis Mar-tinez, Ana McDowall, Tara Mitchell, Fabio Pinna, Miriam Sinn, Munir Squires, Pe-dro Souza, and Dimitri Szerman.
This thesis would not exist without the support of my parents, Marion and Simon, and parents-in-law, Lois and Dave, especially in the last few months with childcare, moving home and country. And most of all I thank my beautiful wife and closest friend Nyree for her boundless patience, love and sense of fun.
Contents
1 Your Loss Is My Gain: A Recruitment Experiment With Framed Incentives 13
1.1 A simple model . . . 16
1.1.1 Effort choice . . . 19
1.1.2 Participation . . . 20
1.2 Experimental design . . . 21
1.2.1 Experimental Platform: Amazon Mechanical Turk (MTurk) . . 23
1.2.2 Effort task . . . 23
1.2.3 Design specifics . . . 24
1.2.4 Data . . . 24
1.2.5 Randomization . . . 26
1.3 Main Results . . . 27
1.3.1 Acceptance . . . 27
1.3.2 Selection . . . 29
1.3.3 Performance . . . 30
1.4 Secondary Results . . . 33
1.4.1 Does framing affect perceived task difficulty? . . . 33
1.4.2 Inattention: Comparing Sessions 1 and 2 . . . 34
1.4.3 Does the framing effect wear off? . . . 35
1.4.4 Standard Selection Effect . . . 35
1.5 Revised model . . . 36
1.5.1 Salience . . . 37
1.5.2 Penalties as a commitment device . . . 37
1.5.3 Discussion . . . 38
1.6 Conclusion . . . 39
1.7 Figures . . . 41
1.8 Tables . . . 49
1.A Model Setup . . . 60
1.B Additional Results . . . 60
1.B.1 Relation between stage 1 variables. . . 60
1.B.6 Comparing sessions 1 and 2 . . . 67
1.B.7 Does the framing effect wear off? . . . 68
1.B.8 Participant locations . . . 69
1.C Experimental details . . . 69
1.C.1 Rates of pay . . . 69
1.C.2 Accuracy report after first stage . . . 69
1.C.3 Invitation to second stage . . . 70
1.C.4 Informed consent . . . 71
1.C.5 Lottery Questions . . . 73
2 Market Structure and Borrower Welfare in Microfinance 74 2.1 The Model . . . 79
2.1.1 Intra-group contracting . . . 80
2.1.2 Social Sanctions . . . 81
2.1.3 Loan contracts . . . 82
2.1.4 Heterogeneity . . . 87
2.2 Competition . . . 90
2.2.1 Equilibrium . . . 93
2.2.2 Comparing market structures . . . 94
2.2.3 Credit Bureaus . . . 95
2.3 Simulation . . . 96
2.3.1 Group size and limited liability condition . . . 97
2.3.2 Data and Parameter values . . . 98
2.3.3 Results . . . 100
2.3.4 Sensitivity analysis . . . 102
2.3.5 Regional analysis . . . 103
2.3.6 Comparing competition and non-profit lending . . . 104
2.3.7 Discussion . . . 105
2.4 Conclusion . . . 106
2.A Proofs, Derivations and Simulation Results Omitted in the Paper . . . 107
2.A.1 Patient monopolist inefficiently under-uses JL . . . 107
2.A.2 Derivation of pooling contract under heterogeneity . . . 107
2.A.3 Derivation of separating contract under heterogeneity . . . 108
2.A.4 Equilibrium with heterogeneous social capital and p≤ δq . . . 109
2.A.5 Competition . . . 109
2.A.6 Mandating JL or IL . . . 112
2.A.7 Stochastic Renewal . . . 112
2.A.8 Group size and binding limited liability condition . . . 116
2.A.9 Regional welfare predictions . . . 117
2.B Simulation Methodology . . . 117
2.C Data Appendix . . . 120
3 Group Lending Without Joint Liability 124
3.1 Model . . . 128
3.1.1 Individual Liability . . . 132
3.1.2 Explicit Joint Liability . . . 133
3.1.3 Comparing contracts . . . 134
3.1.4 A remark on loan size . . . 136
3.1.5 Discussion . . . 137
3.2 Meeting Costs . . . 137
3.3 Social capital creation . . . 140
3.3.1 Meeting frequency and social capital creation . . . 143
3.4 Simulation . . . 144
3.4.1 Approach . . . 145
3.4.2 Results . . . 146
3.4.3 Correlated returns . . . 150
3.5 Conclusion . . . 150
3.A Mathematical appendix . . . 153
3.B Simulation approach . . . 158
List of Tables
1.1 Treatments . . . 49
1.2 Performance on effort tasks . . . 50
1.3 Summary Statistics from stage 1 Survey . . . 51
1.4 Balance Check . . . 52
1.5 Acceptance decision . . . 53
1.6 Acceptance: Interactions . . . 54
1.7 Selection . . . 55
1.8 Performance on stage 2 . . . 56
1.9 Performance/effort on stage 2, alternative measures . . . 57
1.10 Round 2 Performance: Interactions . . . 58
1.11 Round 2 Performance: Heterogeneous effects . . . 59
1.12 Correlation between key stage 1 variables . . . 62
1.13 Performance on stage 1 . . . 63
1.14 Selection: Robustness . . . 65
1.15 Participants’ Predictions of stage 1 Accuracy . . . 66
1.16 Comparing Sessions 1 and 2 . . . 67
1.17 Performance by item in effort task . . . 68
2.1 Summary Statistics and Parameter Estimates . . . 98
2.2 Lending methods andSthresholds across regions . . . 101
2.3 Interest Rates, Market Scale and Borrower Welfare . . . 101
List of Figures
1.1 Example screen from the typing task. . . 41
1.2 Experiment design flowchart. . . 41
1.3 Distributions of survey responses and task performance . . . 42
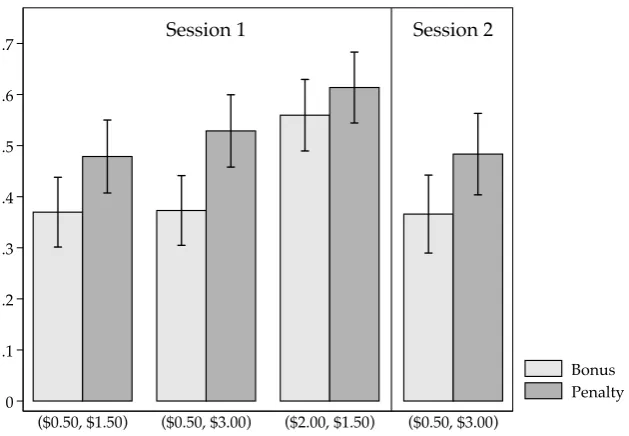
1.4 Acceptance Rates by treatment. . . 43
1.5 Comparing acceptors under Bonus and Penalty Frame . . . 44
1.6 Accuracy by treatment. . . 45
1.7 Performance and effort measures, comparing bonus vs penalty frame 45 1.8 Participants’ predictions of average task 1 accuracy by treatment. . . 46
1.9 Relationship between Rejected Lotteries and performance. . . 46
1.10 Comparing Acceptors vs Rejectors . . . 47
1.11 Performance by item/page on the effort task. . . 48
1.12 Balance between bonus and penalty treatments . . . 64
1.13 Comparing session 1 and 2 participants . . . 64
1.14 Participant locations by geocoded zipcodes . . . 69
1.15 Introduction and examples of lottery questions. . . 73
2.1 Market share of for-profit lenders . . . 77
2.2 Fraction of loans disbursed via solidarity groups . . . 78
2.3 Full Sample Welfare, Interest Rates and Market Scale. . . 100
2.4 Sensitivity Analysis . . . 103
2.5 Mandating contractual form . . . 113
2.6 Simulating the stochastic renewal contract . . . 116
2.7 Borrower Welfare: Regional Differences . . . 118
2.8 IL Share by Value and by Number . . . 122
3.1 Simulation results for uncorrelated borrower returns . . . 147
3.2 Combined simulation results for uncorrelated borrower returns . . . . 149
3.3 Combined simulation results for correlated borrower returns . . . 151
3.4 Simulation results for uncorrelated borrower returns . . . 152
Preface
This thesis consists of three chapters, each of which addresses a separate issue in ap-plied contract theory, and which reflect a common interest in how effective contract design can improve welfare.
In the first chapter I describe the results of a randomized experiment motivated by the question of why firms seem to prefer to present financial incentives to work-ers in terms of bonuses rather than penalties. This is somewhat puzzling given the empirical evidence that penalty contracts (contracts that offer a high base wage but deduct pay if a performance target is not met) are more effective at motivating workers than economically equivalent bonus contracts (with a low base wage and bonuses for meeting the target). This finding is usually attributed to loss aversion on the part of the worker. The low base pay in the bonus contract sets the worker’s reference point low, so the bonus payments fall in the gain domain, while the high base pay of the penalty contract sets a high reference point, such that the penalty falls in the loss domain. Since losses loom larger than gains, workers exert more effort to avoid a penalty than to achieve an equivalent bonus.
The most obvious explanation for why firms prefer bonus contracts is selec-tion: loss averse workers will be unwilling to accept penalty contracts. I formalize this intuition, then experimentally test it using a two-stage randomized experiment in which workers are recruited under economically equivalent contracts that are framed either in terms of penalties or bonuses. Surprisingly I find that workers were 25 percent more likely to accept the penalty framed contract. Despite this, I find no evidence of advantageous or adverse selection induced by the framing treat-ment, indeed the distributions of payoff-relevant characteristics, such as measures of ability, are essentially identical between those who accepted the bonus framed offer and those who accepted the penalty framed offer. Third, consistent with the exist-ing literature, the penalty contract improved on the job performance by 0.2 standard deviations.
The second and third chapters analyze a pair of related problems in the eco-nomics of microfinance, in particular related to group lending. Group lending refers to the common practice in microfinance of disbursing loans and collecting repay-ments at group meetings of several borrowers, rather than individually. It may go hand in hand with joint liability lending, in which case group members also act as guarantors for one another’s loans.
In chapter two, my coauthors and I explore the consequences for borrower wel-fare of different market structures in microfinance. The majority of theoretical work in microfinance assumes a single, benevolent non-profit lender, and studies how the lender is able to use innovative contract structures, such as group lending, to over-come asymmetric information or weak enforcement problems that otherwise lead to credit rationing. Joint liability lending can harness social capital, encouraging mu-tual insurance and increasing repayment rates. However, in the hands of a lender with market power these instruments may actually be harmful to the borrowers. We show that a lender with market power can leverage the joint liability mechanism to charge higher interest rates to borrowers with more social capital, making them worse off.
Next we ask to what extent competition solves this problem, under the real-istic assumption of weak information sharing between lenders. This information structure limits lenders’ ability to recover loans, because borrowers can simply de-fault and move to another lender. As a consequence, the competitive market is characterized by credit rationing. However, higher social capital relaxes the bor-rowers’ repayment constraints, enabling entry and moving welfare toward the first best. Nevertheless, the welfare ranking of competition and monopoly lending is ambiguous, depending on the relative severity of credit rationing and social capital exploitation.
Finally, we find that for over reasonable parameter ranges both monopolistic and competitive for-profit lenders are less likely to offer joint liability loan contracts than non-profits. This is consistent with empirical stylized facts: a recent decline in joint liability lending which goes hand-in hand with growth in commercialization of the microfinance industry.
To assess the empirical relevance of the mechanisms studied, we then simulate the model for estimated values of the key parameters. We confirm that welfare losses under monopoly are large, but find that welfare losses due to information frictions in competition are relatively modest. We also confirm that for the parameters we estimate, commercial lenders are indeed less likely to use joint liability than a non-profit lender.
borrowers have sufficient social capital, they are able to sustain what we call “im-plicit joint liability”, guaranteeing one another’s loans without a stipulation from the lender that they do so. Furthermore, implicit joint liability has the potential to improve on traditional joint liability, since it avoids one perverse effect of joint liability lending, namely that a borrower who cannot afford to guarantee her unsuc-cessful partner’s loan may default on her own loan as well; this does not happen under implicit joint liability. However, implicit joint liability is more demanding in terms of social capital, implying that abandoning explicit joint liability may be more successful in some contexts than others.
Chapter 1
Your Loss Is My Gain: A
Recruitment Experiment With
Framed Incentives
1
Consider two otherwise identical job offers, of which the first pays a base wage of $100, plus a bonus of $100 if a performance target is reached, while the second pays a base wage of $200, minus a penalty of $100 if the target is not reached. Rational agents will behave identically under either of these two contracts. However, a large body of empirical evidence suggests that behavior does respond to framing manip-ulations such as this. In particular several lab and field studies find that workers ex-ert higher effort under the penalty framed contract than the bonus framed one. The leading explanation for these findings is reference dependence and loss aversion (Kahneman and Tversky (1979)), where the frame influences the reference point. The low base pay of the bonus frame sets her reference point low, so bonuses are perceived as gains, while the high base pay of the penalty frame sets her reference point high, so penalties are perceived as losses. Since losses loom larger than gains, penalties are more motivational than bonuses.
This finding raises a puzzle. If penalties are more motivational than bonuses, why are they not more widely used?2 The most obvious explanation is that while penalties are effective motivators of existing workers, they unlikely to be accepted at the recruitment stage. I formalize this intuition in a simple model based on K˝oszegi and Rabin (2006, 2007), showing that a forward-looking loss averse agent who is subject to framing effects will be less willing to accept a penalty contract than an equivalent bonus contract, because penalties increase her reference point, reducing her utility in all states of the world. Under the bonus contract she feels elated when successful and not too disappointed when unsuccessful, while under
1I gratefully acknowledge financial support from STICERD for the experiment described in this
the penalty contract she feels only contented when successful and very disappointed when unsuccessful, hence the penalty contract is less attractive.3
The main contribution of this paper is a real-effort randomized experiment with 1,450 participants, designed to test this intuition. I use a two-stage design that sep-arates selection and incentive effects of penalty framing relative to bonus framing. It consists of a common first stage in which I measure workers’ types, followed by a second stage a few days later in which workers are offered framed incentive con-tracts and choose whether or not to accept. In each stage workers perform a data entry task and are assessed on their accuracy.
In contrast with the theoretical predictions, workers offered a penalty framed contract were 25 percentmorelikely to accept than those offered an equivalent bonus contract. Both the direction and magnitude of this effect are striking. By way of comparison, doubling the size of the contingent component of pay had a small and statistically insignificant effect on acceptance rates.
Second, despite the large effect on recruitment, the penalty contract did not lead to adverse or advantageous selection, indeed the distributions of the main payoff-relevant observables are essentially identical between those who accepted the bonus and those who accepted the penalty. Reported reservation wages are slightly higher on average among participants who accepted the penalty contract, consistent with the penalty frame relaxing participation constraints.
Third, consistent with the existing literature, performance on the incentivized task was significantly higher under the penalty treatment, around 6 percent higher accuracy on the data entry task (0.2 standard deviations). The coefficient estimate is unchanged when including controls, consistent with the absence of selection on ob-servables. The improvement in performance is observed across the whole distribu-tion, so is not driven by a small number of strongly affected individuals. Participants exerted more effort, measured as time spent, under the penalty frame, although this measure is very noisy so the coefficient estimates are not always statistically signifi-cant. Once again, it is striking that doubling the contingent component of pay had a smaller and statistically insignificant effect on performance.
While I cannot of course rule out selection on unobservables, the broad range of controls gives confidence that the observed effect is an incentive effect and not driven by selection. Further confidence is gained from the fact that I do observe significant selection on ability into the incentivized second stage of the experiment (low ability participants are less likely to accept the job offer under both frames), and that increasing the non-contingent component of pay in the second stage led to adverse selection, suggesting that the experimental design is able to detect selection effects where they are present.
In addition to controlling for selection, the experiment is designed to rule out two key confounds, that workers might infer something about the task from the
3More generally, in almost any model where she chooses her effort provision optimally, a
contract they are offered, and that inattention when reading the job offer might make the penalty contract seem relatively attractive. I also check for inference by testing whether workers perceived the task to be more or less difficult under the penalty frame, finding no difference.
Since the basic theory cannot explain the relative popularity of the penalty con-tract I outline two extensions that bring the model in line with the data. One possi-bility is that the high reference point under the penalty contract simply makes the job appear more lucrative, or makes the outside option appear less lucrative. Alter-natively, it could be that workers like penalty contracts because they enable them to overcome a self-control problem: the worker would like to exert more effort and the penalty motivates her to do so. The first extension suggests that workers are making a mistake, and may ultimately come to regret their choice, while in the second the penalty contract takes the form of a commitment device that can increase welfare.4
There are two possible responses to the results. It may indeed be that firms can gain by increasing their use of penalties, including pre-announcing them at the recruitment stage. This is most likely to be the case in contexts similar to the experimental environment, short-term recruitment of workers to perform routine tasks with minimal screening. For example, hiring one-off data entry workers, field officers, tradesmen, event or campaign staff.
The second response is to go back to the original question. The penalty con-tract recruited more workers, who then exerted greater effort, why then are they not more widely used? The results suggest that selection is not the answer. Perhaps the explanation lies in the fact that while most employment relationships are long-term, the effects of framing manipulations may be short-lived. Over time, workers’ reference points are likely to adjust, eroding the performance advantages and per-haps leading workers who were recruited under the penalty frame but would not have accepted the bonus frame to quit.5 It is possible too that actually incurring a penalty (as opposed to not receiving a bonus) is particularly discouraging, leading to lower effort and higher attrition in future periods.6 I show that the framing effect
did not wear off over the course of the one incentivized stage of effort provision, but more theoretical and empirical work on the long-term effects of incentive framing is needed to understand whether these conjectures are correct.
Turning to related literature, existing work on incentive framing focuses on in-centive effects, that is, its effect on effort provision among a sample of already-recruited workers or lab subjects.7 Hossain and List (2012) in the field, and
Ar-4Recent evidence suggests that workers may prefer financially dominated incentive schemes that
incorporate a similar form of commitment, see Kaur et al. (2013).
5Druckman (2001), Hossain and List (2012) and Jayaraman et al. (2014) discuss the issue of
short-lived “behavioral” effects.
mantier and Boly (2012), Hannan et al. (2005) and Church et al. (2008) in the lab consistently find higher effort provision under penalty incentives than equivalent bonus incentives.8 However, Fehr and Gächter (2002) find in a buyer-seller
experi-ment that penalty-framed performance incentives led to more shirking among sell-ers than equivalent bonus-framed offsell-ers.
The paper relates to the literature on behavioral contract design. For example, DellaVigna and Malmendier (2004) explore contract design for time-inconsistent agents, Von Thadden and Zhao (2012) for unaware agents and de Meza and Webb (2007) and Herweg et al. (2010) for loss-averse agents, the latter applying the model of K˝oszegi and Rabin (2006, 2007). Hilken et al. (2013) theoretically analyze an in-centive framing problem related to the one outlined in this paper. Empirical papers studying the effect of loss aversion on effort provision (without framing effects) in-clude Camerer et al. (1997), Farber (2005, 2008), Crawford and Meng (2011), Pope and Schweitzer (2011), Abeler et al. (2011) and Gill and Prowse (2012).
Finally, it fits into the smaller empirical literature on selection effects of em-ployment contracts. Lazear (2000), Eriksson and Villeval (2008) and Dohmen and Falk (2011) find that performance pay tends to select in high-ability types, a result that I also observe in my experiment, while Guiteras and Jack (2014) observe ad-verse selection. Propper and Van Reenen (2010) and Dal Bó et al. (2012) find that high (relative) wages attract higher quality employees, while I observe suggestive evidence that increasing the non-contingent component of pay in my experiment attracted lower ability workers. Deserranno (2014) studies the effect on worker se-lection of manipulating earning expectations by reporting different moments of the earning distribution.
The remainder of the paper is as follows. Section 1.1 sets up the basic theoretical framework and derives three testable predictions. Section 1.2 outlines the experi-ment design, the experiexperi-mental platform (Amazon Mechanical Turk), and the data collected. Section 1.3 describes the main results on acceptance rates, selection and performance. Section 1.4 presents secondary results including two tests of possi-ble mechanisms: inference and inattention. Section 1.5 discusses extensions to the model that bring it closer in line with the data, and areas where further theoretical and empirical work would be particularly valuable. Finally, Section 1.6 concludes. Two Appendices contain additional results and experimental details.
1.1
A simple model
Consider a standard moral hazard problem in which a principal (P) wants to hire an agent (A) to perform a task, the success of which depends on the agent’s effort.
incurred. They show that setting the target extremely high reduces acceptance of the job offer and performance.
8Fryer et al. (2012) test a closely related but stronger manipulation than pure framing on school
Effort is non-contractible so P must write a contract that incentivizes effort. How-ever, the agent’s utility is reference-dependent and loss-averse, and the principal can influence the agent’s reference point by altering how the contract is framed. Lastly, there is limited liability, such that the payment to the agent in any state must exceed some lower boundw, which I normalize to zero for convenience.
A chooses an effort level e ∈ [0, 1]which equals the probability that the task is successful. If successful, P earns a payoffv, otherwise he earns 0. In the absence of any framing effect, this implies that the optimal contract (ruling out contracts that pay lotteries) consists of a pair,(w,b), such thatwis a non-contingent payment, and
bis a bonus paid if the agent is successful. In addition, I assume that P can choose a frame, F, that influences A’s reference point under the contract. Thus, P offers A a triple, (w,b,F), A accepts or rejects the contract, then exerts effort if she accepted and is paid according to the outcome. P’s payoff is simply:
Π=e(v−b)−w.
I follow K˝oszegi and Rabin (2006, 2007) (henceforth, KR) in assuming that the agent’s utility function is a sum of a standard component, expected consumption utility, and a gain-loss component that values payoffs against a stochastic reference point, less an effort cost that is not reference-dependent for simplicity. In KR, the reference point is the expected distribution of outcomes. For example, an agent holding a lottery ticket that pays $50 with 50% probability has a stochastic reference point that equals $50 with probability one half and $0 with probability one half.
The most natural specification of the reference point in work on moral hazard under loss aversion applies K˝oszegi and Rabin (2007)’s concept of choice-acclimating personal equilibrium (CPE). Under CPE, the agent’s choices influence her reference point, and she takes account of this effect when making her decision, i.e. her ref-erence point and choices are simultaneously determined. For instance, under CPE, an agent knows that buying a lottery ticket will increase her expected winnings, which will be incorporated into her reference point. This creates the possibility of experiencing a loss when she does not win, which might ultimately lead her not to purchase a ticket. In the moral hazard context, higher effort leads to a higher chance of receivingb, which increases the reference point, and the agent anticipates this when choosing her effort level.
To focus the analysis, I impose a number of standard simplifying assumptions on the KR utility function, described in Appendix 1.A. The resulting basic framework is very similar to that used by Herweg et al. (2010) and Gill and Prowse (2012).9 A’s utility over consumptionc, which is distributed according to G(c|e), and reference
9In particular, I assume that the agent places equal weight on consumption and gain-loss utility,
pointr, distributed according to H(r|e,F), whereF represents the frame, is:
U(G|H,e,F) =E(c|e) +αe− e
2
2γ + [1+1{c≥r}(λ−1)]
Z Z
(c−r)dG(c|e)dH(r|e,F)
(1.1)
The first line, E(c|e) +αe− 2e2γ is standard expected consumption utility, plus a term representing intrinsic motivation, αe, less the cost of effort which I assume is quadratic and decreasing in an ability parameter γ > 0. I assume α ∈ [0, ¯α]. The second line is A’s gain-loss utility, depending on A’s coefficient of loss aversion, λ. If λ = 1 (no loss aversion), then gain-loss utility is simply the expected difference between consumption and the reference point. If λ > 1, then losses are weighted more heavily than gains, i.e. states in whichc<rare overweighted relative to states in whichc>r.
In the KR model,His the true distribution of outcomes, so framing has no effect. To allow for framing effects, I make a simple modification to the specification of the reference point. I assume that the reference point takes the form of a weighted sum of the KR reference point and the “base pay” supplied by P, which depends on the choice of frame. Formally, the marginal distribution ofr becomes:
h(x|e,F) =Pr(r =x|e,F) =
1−e x =φw+ (1−φ)(w+Fb)
e x =φ(w+b) + (1−φ)(w+Fb)
(1.2)
F∈[0, 1],φ∈ [0, 1).
w+Fbis the base pay supplied as a reference point by P, and Fcorresponds to the fraction of the bonus b that is presented as part of the base pay. F = 0 is a pure bonus frame with base pay w;F=1 is a pure penalty frame with base payw+b.10
The parameterφcaptures how susceptible the agent is to framing effects. φ=1 coincides with KR’s model, in which framing has no effect on behavior. Whenφ=0 the reference point is simply a choice variable for P. For intermediate values of φ increases, A’s reference point lies in betweenwandw+band she experiences mixed emotions whether she receives or does not receive the bonus.
Incorporating the above assumptions, A’s gain-loss utility sums over four states of the world. With probabilitye2, her consumption is w+band her reference point isφ(w+b) + (1−φ)(w+Fb)≤w+b, putting her in the gain domain. With proba-bilitye(1−e)her consumption isw+band her reference point isφw+ (1−φ)(w+
Fb) ≤ w+b, again putting her in the gain domain. With probability e(1−e) her
10The assumption thatF ∈[0, 1]rules out unrealistic expectations, that she might earn less thanw
consumption iswand her reference point isφ(w+b) + (1−φ)(w+Fb)≥w, putting her in the loss domain, and with probability (1−e)2her consumption iswand her reference point isφw+ (1−φ)(w+Fb)≥ w, again putting her in the loss domain. Plugging these into (1.1) and simplifying, I can write her utility as:
U(e,w,b,F) =e[α+b((2−λφ) + (λ−1)(1−φ)F)]−e2
1
2γ−(λ−1)φb
+w−λ(1−φ)Fb.
(1.3)
1.1.1 Effort choice
Suppose A accepts the contract. I impose two parameter restrictions that are suffi-cient for the optimal equilibrium effort choice to be interior (i.e. lie in the interval (0, 1)) and given by the first-order condition.
Assumption 1 No dominance of gain-loss utility: λ< 2φ ≡λˆ.
Assumption 2 No top-coding in effort: γ<γ¯ ≡ α¯+v[11+λ−φ].
Under Assumptions 1 and 2, A’s optimal effort choice is equal to:11
e∗(b,F) = γ[α+b((2−λφ) + (λ−1)(1−φ)F)]
1−2γ(λ−1)φb (1.4)
Assumption 1 ensures that A is not so strongly loss averse that she is discour-aged from exerting any effort at all. This can happen because her reference point is increasing in her effort choice, as higher effort increases her expected earnings. Intuitively, ifλis large, the increase in her disappointment when unsuccessful out-weighs the higher expected earnings, such that she prefers to not to exert any effort. Assumption 2 simply ensurese∗ <1.
Inspection of (1.4) immediately reveals the incentive effect of framing. The penalty frame increases F and thus A’s reference point. This in turn increases the magnitude of the loss that she experiences when unsuccessful. In response, she in-creases her effort provision to reduce the probability of experiencing the loss. The first testable prediction of the model is therefore:
Prediction 1 Suppose λ > 1 and φ < 1, so A is loss averse and susceptible to
fram-ing effects. Then, her effort provision is higher under a penalty framed contract than an economically equivalent bonus framed contract.
11To see that Assumptions 1 and 2 imply thate∗is the unique, interior maximizer of (1.3), first note
that the second order condition can be written as 2γ(λ−1)φb <1. Assuming this holds, we have e∗>0 for allF,αandb>0, provided 2−λφ>0, which is Assumption 1. Second,e∗<1 for allF,α
providedγb[(2−λφ) + (λ−1)(1−φ) +2(λ−1)φ]<1, which can be easily seen to imply the second
The second prediction relatese∗to A’s coefficient of loss aversion. Differentiating
e∗ with respect toλyields:
de∗ dλ
= γb[(1−φ)F−φ(1−2γ(α+b(2−φ)))]
(1−2γ(λ−1)φb)2 (1.5)
The sign of this expression is ambiguous. In particular, suppose F = 0. Then dedλ∗ is negative ifφ > 0 and 1> 2γ(α+b(2−φ)). However it is clear that provided A is susceptible to framing effects (φ<1), d2e
∗
dλdF >0.
Two opposing forces drive the ambiguity of the relationship between effort and loss aversion. On the one hand, more loss averse agents will work harder to avoid any given loss. On the other hand higher effort increases the probability of success, and therefore the reference point. This in turn increases the magnitude of the loss experienced when unsuccessful, discouraging higher effort provision. The net effect is ambiguous. However the intuition behind the effect of F on this relationship is clear: since more loss averse agents work harder to avoid any given loss, increasing the reference point by increasing Felicits a greater effort response the higher isλ.
Prediction 2 The relationship between effort and loss aversion (λ) can be positive or
nega-tive, but is more positive (less negative) under the penalty than the bonus frame.
1.1.2 Participation
Now consider A’s participation decision. Substituting for (1.4) yields A’s utility when she accepts the contract(w,b,F):
U∗(w,b,F) = γ[α+b((2−λφ) + (λ−1)(1−φ)F)]
2
2[1−2γ(λ−1)φb] +w−λ(1−φ)Fb. (1.6)
She accepts the job offer if her participation constraint is satisfied:
U∗(w,b,F)−u¯ ≥0 (1.7)
¯
uis a fixed amount given up when taking on the task, reflecting A’s outside option which may depend upon her type(α,φ,λ,γ). Note that in addition,γmay directly depend on her outside option if the cost of effort partly consists of foregone effort on other tasks.
Applying the envelope theorem to (1.3) it is clear that A’s utility is decreasing in
Fif φ< 1. This is because now, for any level of effort, her reference point is higher and therefore her elation when she receives b is reduced, and her disappointment when she does not receive it is increased. This delivers a third testable prediction of the model:
Prediction 3 Suppose A is susceptible to framing effects (φ <1). Then she is less willing
The implication of Prediction 3 for optimal contracts is given in the following Proposition:
Proposition 1 Suppose P wishes to recruit one agent of known type. P prefers bonus framing to penalty framing whenever A’s participation constraint is binding.
The proof of Proposition 1 simply uses the fact that when the participation con-straint is binding P is the residual claimant of any surplus generated by the relation-ship. Since by Prediction 3 A’s utility is decreasing inF, P will prefer bonus frames. A marginal decrease in F can be offset by a decrease inw. The complement of this proposition is that P will only use some form of penalty framing (F > 0) when the participation constraint is not binding, i.e. when the limited liability constraint (w≥0) is binding.
1.2
Experimental design
In order to identify the effect of incentive framing on selection and effort, the experi-ment needs to have three key features. First, we need to be able to observe the types of workers that select into each contract and compare these with the population of potential workers. Second, we need to observe their effort provision under the con-tract, controlling for selection. Third, we need as far as possible to shut down any channel through which the contract offered is interpreted as informative about the nature of the task or the type of the principal.
To separate selection and incentive effects I use a two-stage design similar to Dohmen and Falk (2011). In the first stage, workers are surveyed and perform a practice task under flat incentives, giving me an opportunity to measure their types, and giving them experience at the task. Flat incentives were used to avoid workers being exposed to more than one form of incentive pay during the experiment. In the second stage they are then offered an opportunity to perform the same task under randomly varied performance-related incentives, which they can accept or reject. Their outside option is simply determined by their value or leisure or alternative tasks available. Selection effects can be examined by comparing the types that ac-cept different offers, while incentive effects are estimated by comparing behavior conditional on acceptance and type.12
12A prominent alternative approach would be to use Karlan and Zinman (2009)’s methodology.
Turning to confounds, a concern in experiments on incentive pay is that agents may interpret the contract offered as informative about the task, or about charac-teristics of the principal that are relevant to their payoff. For example, Bénabou and Tirole (2003) analyze an asymmetric information context whereby if the prin-cipal offers a larger bonus for a task (in equilibrium), the agent will believe the task to be more difficult. Similarly, in my context it seems intuitive to think that agents might perceive a penalty as designed to punish failure at an easy task (or where shirking is easy to detect).13 In some contexts, participants might believe that the choice of bonus or penalty reflects the principal’s transaction costs, whereby a bonus (penalty) is chosen when bonuses will be paid (penalties deducted) infre-quently, to minimize the number of transactions conducted. Trust might also play an important role. It might plausibly be argued that agents could perceive a princi-pal offering a penalty-framed contract as more or less trustworthy than one offering a bonus-framed contract.
While it is probably not possible to eliminate these concerns completely, I believe that they are addressed at least in part by two features of the experiment design. Firstly, all participants have already interacted with me, the principal, through the first stage of the experiment. They have agreed to an informed consent form that states this is a research project from an internationally well-known university, gives my name and contact details. They were paid promptly after completing the first stage, and received a personalized email from me after completion. The invitations to the second stage were received 6 days later, again by personalized email. This should address the trust concerns.
To address concerns about inference, after the first stage of the experiment, work-ers were sent an email informing them of the percentage of strings that they typed correctly in the first stage, to ensure that they have a good sense of the task diffi-culty. In the second stage they are paid the bonus (avoid the penalty) if they entered a randomly selected item correctly, so a worker with a 60% accuracy rate knows that she has a 60% chance of receiving the bonus (avoiding the penalty) in stage 2 if she performs at the same level. As for transaction costs, workers knew that they would receive their full payment for the incentivized task in a single transaction. This should address concerns that bonuses and penalties are perceived as being enacted infrequently.14
To check whether workers beliefs about the task difficulty is affected by the frame, I ask them at the beginning of stage 2 to estimate the average accuracy rate
13Note that this argument is difficult to formalize in the context of choice of contract frame. The
reason is that in Bénabou and Tirole (2003), the choice of incentive plays the role of a costly signal from principal to agent, whereas a frame in my context is pure cheap talk. Therefore although it may be possible to construct equilibria in which bonuses are taken to signal harder tasks, it is equally possible to construct the reverse equilibrium, so the model is not predictive.
14An alternative way to address these concerns would be to make it explicit that incentives are
from stage 1. If workers who receive one contract perceive the task to be more difficult than those who receive a different one, they should estimate a lower mean performance from the first task.
1.2.1 Experimental Platform: Amazon Mechanical Turk (MTurk)
The experiment was run on the online platform Amazon Mechanical Turk (MTurk, for short). MTurk is an online labor market for “micro outsourcing”. For exam-ple, a “requester” that needs data entered, audio recordings transcribed, images categorized, proofreading, or many other possible types of tasks can post a Human Intelligence Task (HIT) on MTurk, and recruit “workers” to carry it out. The HIT terminology reflects that the purpose is typically to outsource to human workers tasks that are not currently suited to computerization. Workers are typically paid a flat fee for a task, with the potential to earn bonuses for good work, or to have their work rejected unpaid if it is poor quality.
MTurk has many attractive features for research. For example, a short survey can be prepared, posted and completed by hundreds of workers in a matter of hours, typically for much smaller incentives than might be used in a laboratory experiment. Bordalo et al. (2012) test their theory of salience using MTurk surveys. Barankay (2011) uses MTurk to study the effect on willingness to undertake more work of telling workers about their rank in an initial task. Horton et al. (2011) and Amir et al. (2012) replicate some classic experimental results with MTurk subjects. A good introduction to how to go about using MTurk for research is given by Paolacci et al. (2010) and Mason and Suri (2012). The demographics of MTurk workers are analyzed in Ipeirotis (2010).
1.2.2 Effort task
In each stage of the experiment, subjects were asked to transcribe 50 text strings, gradually increasing in length from 10 characters to 55 characters. The strings were generated using random combinations of upper and lower case letters, numbers and punctuation and distorted to give the appearance of having been scanned or photocopied.
The task was chosen to be implementable online, to be reasonably similar to the types of tasks that participants are used to doing in the course of their work on MTurk, and to be sufficiently difficult to generate variation in performance (accu-racy) without putting the workers under time pressure.15 Time pressure was not used to maintain similarity with other MTurk tasks which typically allow work-ers to work in their own time. In each stage there were 10 possible sets of strings
15The task closely resembles the kind of garbled text that individuals must type to solve a
puz-and participants were rpuz-andomly assigned to one of these.16 An example screen is reproduced in Figure 1.1.
1.2.3 Design specifics
A flowchart summarizing the design and timings is given in Figure 1.2. Two exper-imental sessions were conducted, each of which consisted of two stages. The first stage of the experiment recruited workers on MTurk for a “Typing task and survey” for a flat pay of $3. Recruitment was restricted to workers located in the US. Par-ticipants performed the typing task then filled out the survey, which is described below. Once all participants had been paid, they were sent an email informing them of their performance in the typing task, example text is given in Appendix 1.C.2.
Six days later, all participants from were sent a second email, inviting them to perform a new typing task, this time under experimentally varied incentives. Each contract has three components: a fixed pay component that does not depend on performance, a variable pay component that does depend on performance, and a frame that is either “bonus” or “penalty”. Participants were told that the task would remain open for four days, and that they could only attempt the task once.
Participants were randomized into one of three possible financial incentives, and either bonus or penalty frame. The treatments are detailed in Table 1.1, and consist of either low fixed and variable pay, low fixed and high variable pay or high fixed and low variable pay. The reasoning behind the particular rates of pay used is discussed in Appendix 1.C.1.
Participants were told that after completion of the task I would select, using a random number generator, one of the 50 strings that they had been assigned to type, and that they would receive the bonus (avoid the penalty) conditional on that item being entered correctly. I avoided using emotive terms like “bonus” and “penalty”. For example, a penalty framed offer in experimental session 1 was worded as fol-lows: “The basic pay for the task is $3.50. We will then randomly select one of the 50 items for checking. If you entered it incorrectly, the pay will be reduced by $1.50.” Examples of the full email text are given in appendix 1.C.3. Experimental sessions 1 and 2 differed in the exact phrasing of the email, in order to check whether the results from Session 1 were driven by inattention.
1.2.4 Data
This section describes the key variables collected in the survey and effort tasks. Summary statistics are given in Tables 1.2 and 1.3 and summary distributions of key variables plotted in Figure 1.3. I describe the main variables below.
$0 to $11. For each lottery, they are asked whether or not they would be willing to play this lottery if offered to them by someone “trustworthy”. The main measure of loss aversion is the number of rejected lotteries.17 I also record whether participants
made inconsistent choices, accepting a lottery that is dominated by one they rejected. A screenshot of the lottery questions is given in Appendix 1.C.5.18
Two other key variables that I attempt to measure are participants’ reservation wages and their perceptions of what constitutes a “fair” wage (see e.g. Fehr et al. (2009)). A measure of reservation wages is useful in considering how the framed incentives affect willingness to accept a job offer. All else equal (in particular, con-trolling for ability), if one contract is perceived as less attractive it should particularly discourage those with a higher reservation wage. To elicit reservation wages I ask participants what is the minimum hourly wage at which they are willing to work on MTurk. This is a meaningful concept in the MTurk context because at any point in time there are typically many HITs that a worker could perform, with varying rates of pay. Moreover, 93% of participants stated that their main reason for working on MTurk is to earn money, suggesting that reservation wages should be important.
Fehr and Gächter (2002) find in a buyer-seller experiment that penalty-framed performance incentives led to more shirking among sellers than equivalent bonus-framed offers, and argue that this is because the penalty contracts are perceived as less fair. I ask participants what they think is the minimum fair wage that requesters “should” pay on MTurk, and use this measure to proxy for fairness concerns. Reser-vation wages are typically lower than fair wages.
Participants were also asked to report the zipcode of their current location, which I map in Appendix 1.B.8. The distribution of participant locations closely resembles the population distribution across the US.
Now I turn to measuring effort and performance on the effort task. The main performance measure is “Accuracy Task X”, the fraction of text strings that par-ticipants entered correctly in stage X. I also construct a second accuracy measure, “Scaled Distance Task X”, which can be thought of as the error rate per character typed.19 In the regressions I use the natural log of this measure since it is is
heav-17Note that by Rabin (2000) aversion to risk in small stakes lotteries is better explained by loss
aversion than standard concave utility.
18The lottery choices were not incentivized because of concerns that this would interfere with
study-ing selection effects and willstudy-ingness to accept job offers for the effort task alone. Offerstudy-ing financial incentives large enough for participants to potentially lose $10 is problematic because it would inter-fere with the selection effects I am trying to measure: if the incentives were advertised upfront they might attract high reservation wage participants who would not participate in the stage 2 effort task; if they were not pre-announced, subsequently revealing them might lead the participants to expect unannounced rewards in stage 2 and thus be more likely to accept in stage 2. Camerer and Hogarth (1999) argue that: “In the kinds of tasks economists are most interested in, like trading in markets, bar-gaining in games and choosing among gambles, the overwhelming finding is that increased incentives do not change average behavior substantively.”
19For each text string I compute the Levenshtein distance between the participant’s response and the
ily skewed by a small number of participants who performed poorly (per-string accuracy rates are sensitive to small differences in per-character error rates).
I also attempt to measure how much time participants spent on their responses. This measure is imperfect as I cannot observe how long participants were actually working on their responses, only how long the web pages were open for, and par-ticipants may leave the page open while performing other tasks. As previously discussed this is a common feature of how workers work on MTurk HITs and I did not want to introduce artificial time pressure. To deal with this issue, I take the median time spent on a page of the typing task (there are 10 pages of 5 items each), multiplied by 10. This measure is still heavily skewed, however.
Finally, participants were asked at the beginning of stage 2 to estimate the mean accuracy rate (across all participants) from stage 1, which I use to test whether the frame changed their perceptions of the task, a variable I label “Predicted Accuracy”. In total 1,465 participants were recruited, of which 693 returned for stage 2. 15 participants are dropped from all of the analysis, six because I have strong reasons to suspect that the same person is using two MTurk accounts and participated twice and nine because they scored zero percent accuracy in the stage 1 typing task, sug-gesting that they did not take the task seriously (of the six of these who returned for stage 2, five scored zero percent again).
1.2.5 Randomization
To test for selection effects it is important to have good balance on the variables for which selection might be a concern. In this context, the obvious candidates are the participants’ performance in stage 1, measured loss aversion and reservation wage, so I stratify on these variables. I was slightly concerned that some participants might know one another (for example, a couple who both work on MTurk), so the treatments were randomized and standard errors clustered at the zipcode-session level.20 In regressions that drop participants who share a zipcode this is equivalent to using robust standard errors, since then each cluster is of size one.
As a graphical check of balance, Appendix 1.B.2 plots the CDFs for task 1 ac-curacy, reservation wage, fair wage and rejected lotteries, separately for the bonus and penalty treatments, confirming near-perfect balance on these variables. Also, Appendix 1.B.3 plots the distributions of these variables by experimental session.
Table 1.4 gives the results of the statistical balance tests. I perform two exercises. The first tests the joint significance of the full set of treatment dummies in explaining each baseline characteristic. The second performs a t-test for comparison of means between pairs of treatments, where each pair considered differs only in terms of its bonus/penalty frame (groups (0,1), (2,3), (4,5) and (6,7) as labeled in Table 1.1). Both exercises confirm good mean balance on all characteristics with the exception of the minimum fair wage (F-statistic p-value 0.01), which is driven by differences between
sessions 1 and 2, and the number of MTurk HITs completed (p-value 0.07), driven by a small number of participants with very large numbers of HITs completed. In addition, I run Kolmogorov-Smirnov or Mann-Whitney equality of distributions tests between bonus and penalty frames for stage 1 performance time spent on stage 1, loss aversion, reservation wage and fair wage, none of which reject the null of equal distributions.
1.3
Main Results
In this section I describe the main results of the experiment. The key results of interest are the effect of the penalty frame on participants’ willingness to accept the contract, the effect of the frame on the types of participants who select into the contract, and the effect on performance on the job. I discuss the relation between the key observable characteristics, and between characteristics and performance, in Appendix 1.B.1.
1.3.1 Acceptance
First I consider participants’ decision whether or not to accept the stage 2 job offer. Figure 1.4 graphs acceptance rates by treatment. The striking pattern in these data is that penalty framed contracts were much more likely to be accepted than equivalent bonus framed contracts. The relationship is pronounced for the four groups with fixed pay of $0.50, and weaker for the two groups with fixed pay equal to $2. In ad-dition, acceptance is substantially higher under higher fixed pay, while the relation between variable pay and acceptance appears weak at best.
This result is particularly striking because it directly contradicts model Predic-tion 3. The simple loss aversion model implies that penalty contracts should be relatively unattractive compared with equivalent bonus contracts. I discuss this finding in relation to the theory in section 1.5.
Moving on to the regression results, the basic regression specification is a linear probability model with dependent variable Accepti ∈ {0, 1}, individuals indexed by i:
Accepti =β0+β1∗Penaltyi+β2∗HighFixedPayi+β3∗HighVariablePayi+β4∗Xi+ei
(1.8)
and time spent on the stage 1 effort task, to jointly proxy for ability and intrinsic motivation. All results are robust to additionally including the ratio of accuracy to time spent (not reported). Xi also includes dummies for the set of items assigned
to be typed by that participant (10 possible sets). Note that the main specifications pool the effects of each component of the contract to increase power. I break down the treatment effects below.
Table 1.5 presents the main results. I find that a penalty framed contract increases acceptance rates by approximately 10 percentage points over the equivalent bonus frame. This implies a 25 percent higher acceptance rate under the penalty frame than (the mean acceptance rate under the bonus frame was 42 percent), a large effect for a simple framing manipulation. High fixed pay increases acceptance by around 15-16 percentage points, or around 10 percentage points per dollar. Surprisingly, the effect of high variable pay is positive but much smaller at around 3 percentage points greater take-up (around 2 percentage points per dollar), and not statistically significant. The results are robust to dropping participants who made inconsistent choices in stage 1, who spent a very long time on the first task, have very high reservation or fair wages, or are from zipcodes with more than one respondent. Near-identical average marginal effects are obtained using logistic instead of linear regression.
Participants who performed better on the unincentivized stage 1 were signif-icantly more likely to accept the stage 2 job offer, as is clear from Table 1.2 and Figure 1.10. This is consistent with the common finding that performance pay dif-ferentially selects more able or motivated workers, and which I discuss further in Section 1.4.4. Participants with a higher reservation wage were significantly less likely to accept the offer, suggesting that this measure is informative. Interestingly, when controlling for this measure, the coefficient on “minimum fair wage” is not statistically significant, suggesting that fairness concerns (as measured by this vari-able) were not of primary importance for willingness to accept the contract.
The number of hypothetical lotteries rejected by participants is not predictive of acceptance, whether or not I drop participants who made inconsistent choices in the lottery questions. This is surprising as the stage 2 contract is risky, so one would expect more risk/loss averse participants to be less willing to accept it. Fig-ure 1.10 shows that the distributions of rejected lotteries are essentially identical for participants who did and did not accept the stage 2 job offer. This could be because the measure is poorly capturing loss aversion, although similar unincentivized mea-sures have been successful in other studies (see e.g. Camerer and Hogarth (1999)).
statisti-cally significant when estimated separately or simultaneously. In addition, the point estimate on “high variable pay” is essentially zero for participants under the bonus frame, implying that the potential for a $3 bonus as opposed to a $1.50 bonus did not make the job offer significantly more attractive.
1.3.2 Selection
Now I turn to the effect of the penalty frame on the types of workers that select into the contract. Figure 1.5 plots CDFs of stage 1 task performance, time spent on stage 1 task, rejected lotteries, reservation wage and fair wage, comparing those who accepted the bonus frame with those who accepted the penalty frame. Surprisingly, the distributions are essentially overlapping for all variables except for reservation wages, implying no differential selection on these variables. The lack of selection on fair wages suggests that fairness concerns do not drive the difference in acceptance rates between contracts.
I do observe suggestive evidence that the penalty contract attracted workers with higher reservation wages. This is consistent with either of the mechanisms proposed in section 1.5. Note that selecting in workers with higher reservation wages is not inconsistent with no selection on other characteristics, since as shown in Appendix 1.B.1, the correlation between reservation wages and other characteristics is small.
Table 1.7 tests for selection effects of penalty framing by interacting the penalty frame with the key observables in acceptance regressions. The interaction coef-ficients estimate the extent to which a given characteristic more or less strongly predicts acceptance under the penalty frame. In each case the interaction terms are not statistically significant, whether estimated separately or jointly. A joint test fails to reject the null that all interaction coefficients are equal to zero (p-value 0.90).
the evidence presented in the next section.
It is quite surprising that there seems to be no selection effect of penalty framing. One possibility is that selection is hard to detect in this context. If workers could choose between the bonus and penalty framed job, assuming this did not undo the framing effect, they should select into the job they preferred. However in this ex-periment, workers cannot choose jobs, only whether to accept the one that they are offered. As a result there will be many participants in each pool whose participation constraints would be satisfied under either contract: any selection effect would have to be driven by the fraction of participants whose participation constraints are sat-isfied under one but violated under the other. However, given the large difference in acceptance rates between contracts it seems unlikely that this is what is driving the lack of detectable selection. In addition, as documented in Section 1.4.4, I am able to observe the more standard result of differential selection by type into the incentivized task: workers with high performance in the first stage are more likely to accept the job in the second stage.
1.3.3 Performance
Now I turn to the incentive effects of contract framing on worker effort and per-formance. This section directly relates to the existing literature on framed contracts which considers incentive effects for an already recruited sample of workers or par-ticipants.
The basic regression equation is:
Yi =δ0+δ1∗Penaltyi+δ2∗HighFixedPayi+δ3∗HighVariablePayi+δ4∗Xi+ei
(1.9) WhereYi is a measure of effort or performance. The key measures are summarized
in Table 1.2 and distributions plotted in Figure 1.3. As before, Xi is a vector of
variables measured in stage 1, including accuracy and time spent to jointly proxy for ability and intrinsic motivation (results are robust to also including the ratio of these variables).
In general one would expect the estimates of δ1,δ2 andδ3 to be biased by
selec-tion: if the workers that accept one type of contract are different from those that ac-cept another, then performance differences may simply reflect different types rather than different effort responses to incentives. However as already documented, I do not observe differential selection between frames, which would bias the estimate of the key coefficient of interest, δ1. Moreover, since I have stage 1 measures of
per-formance and characteristics, I can control for selection on observables by including these. The estimates are very stable with respect to inclusion of controls, giving confidence that selection effects are not driving the results.
correctly. Figure 1.6 presents the mean performance on the stage 2 task by treat-ment group. As with acceptance rates, a clear pattern is visible: performance is always higher in the penalty framed than in the bonus framed treatments. Figure 1.7 plots CDFs of accuracy, the log distance measure (recall that this is interpreted as the log of the per-character error rate) and time spent on stage 2, each of which demonstrate a small increase in performance and effort between frames consistent with performance or effort first-order stochastic dominating that under the bonus frame. These results are consistent with the existing experimental studies of framed incentives in both direction and magnitude.
The main regression results are given in Table 1.8. I find that accuracy under the penalty frame is around 3.6 percentage points (around 0.18 standard deviations or 6 percent of the mean accuracy of 0.59) higher than under the bonus frame, sta-tistically significant at 5 percent without/1 percent with controls. The coefficient estimate is robust to dropping participants who made inconsistent lottery choices, participants from zipcodes with multiple respondents, and outliers on the reserva-tion and fair wage quesreserva-tions (although a little smaller and only significant at 10 percent). Crucially, the estimated penalty effect is unaffected by the inclusion or exclusion of controls, consistent with the contract frame not inducing significant outcome-relevant selection, at least on observables. For selection to explain the re-sults, there would have to be a substantial unobserved driver of performance that differentially selected under the penalty frame and orthogonal to the wide range of controls included in the regressions.
In addition, high fixed pay increases accuracy by around 2-4 percentage points, significant at 5 percent when controls are included. The point estimate doubles when controls are included, suggesting there may be adverse selection induced by the higher fixed pay. If anything, the fact that a selection effect is observed here gives comfort that the lack of observed selection between bonus and penalty reflects a true lack of selection in the data. Lastly, high variable pay increases accuracy by around 1.4-2.5 percentage points, although this is never significant at conventional levels.
As for the other key variables, performance in the first stage very strongly pre-dicts performance in the second stage, while the coefficient on time spent in the previous task is negative, small in magnitude and not significant. As in stage 1, a higher reservation wage is associated with poorer performance. Controlling for the reservation wage, the reported minimum fair wage has no effect on performance, again consistent with fairness concerns not being of primary import.
In table 1.9 I regress the distance measure of accuracy (log errors per character typed) and time spent on treatment dummies and covariates. The estimates imply that the penalty frame led to participants committing 20 percent fewer errors per character (from a mean of 0.066), and spending around two to three minutes longer on the task (mean 41 minutes), although the latter is not significant when controls are included. The point estimates on fixed and variable pay mirror their counter-parts in the main regressions, and once again there is evidence of adverse selection induced by the higher fixed pay.
Next I break down the differential effects between bonus and penalty frames of varying fixed and variable pay, interacting the penalty dummy with the high fixed/high variable pay dummies. Regressions are reported in Table 1.10. Increasing the fixed pay seems to have the same effect under both bonus and penalty contracts (the interaction effect is an imprecisely estimated zero). Increasing the size of the variable pay is associated with higher effort under both frames, with a smaller effect under the penalty frame. However neither estimate is statistically significant.
Table 1.11 reports estimates of heterogeneous effects of the penalty treatment by the main variables. In each case the individually estimated interaction effect is not statistically significant: there is little evidence of strong heterogeneous effects. Including all of the interaction effects estimated together gives one unexpected and difficult to interpret result: a negative interaction effect for reservation wages and a positive one for minimum fair wages.21
Focusing on the coefficient on rejected lotteries, I note that although neither the main effect nor interaction coefficient are statistically significant. Nevertheless it is striking that the implied coefficient on rejected lotteries is close to zero under the bonus frame, and negative under the penalty frame (the combined effect under the penalty frame is statistically significant at the 5 percent level), while the model Prediction 2 implies that the coefficient should be more positive under the penalty frame.
Clearly I lack power to dig into this relation in depth. I do however perform one simple exercise. In Figure 1.9 I non-parametrically (LOWESS) plot accuracy against rejected lotteries separately under bonus and penalty frame, after partialling out the other variables, dropping participants with inconsistent choices and those who rejected or accepted all lotteries. The slopes are approximately equal over much of the range of values for rejected lotteries, but flattening out for high values under the bonus frame while becoming strongly negative under the penalty frame, which is what is driving the difference in the regression coefficients. For most participants the relationship between performance and loss aversion is similar between frames, but penalties seem to stronglydiscouragethe most loss averse participants, an effect which is not in the model.22
21Dropping participants above the 99th percentile for reservation or fair wages, the p-value on the
reservation wage interaction increases to 0.09 and that on the fair wage interaction increases to 0.14.
Summing up, I find strong and robust evidence that the penalty frame caused more participants to accept the stage 2 job offer, and performed better under penalty framed contracts. However I find no evidence of adverse or advantageous selection into the penalty contract, either directly from comparing distributions of character-istics, or indirectly by observing that the treatment effects are robust to inclusion of controls for participant type.
In addition, I find that higher fixed pay robustly leads to higher acceptance of the job offer, and to higher performance, with some evidence of adverse selection. I find a positive relationship between higher variable pay and acceptance and perfor-mance, but surprisingly this is never statistically significant.
The most surprising implication is that a simple switch from bonus to penalty framing is highly lucrative from the principal’s perspective. My estimates suggest that recruitment and performance would be similar under a contract that pays $0.50 fixed pay with $1.50 variable pay framed as a penalty, as with $1.50 fixed pay and $1.50 variable pay, framed as a bonus.
1.4
Secondary Results
In this section I outline secondary results aimed at partly unpacking the mechanism behind the main results. First, I demonstrate that the penalty frame did not ap-pear to change participants’ perceptions of the task difficulty. Second, I argue that inattention is unlikely to explain the higher acceptance rate of the penalty contract. Third, I document that a standard selection result is present in my data: perfor-mance pay attracted more able workers, giving confidence that the no-selection result between frames is not driven by, for example, MTurk workers being atypi-cal experimental subjects. Last, I briefly discuss persistence of the framing effect, exploring whether effort under the penalty remained high throughout the task, or whether participants quickly realize the equivalence of the two contracts.
1.4.1 Does framing affect perceived task difficulty?
Subjects were asked to predict the mean accuracy rating on the first stage at the beginning of the stage 2 task. If the frame influenced their beliefs about the task difficulty, it should also influence their belief about mean performance in the first stage. Figure 1.8 graphs the mean of these predictions by treatment group. There is no systematic relationship between the framing treatment and the predictions, but it seems that predictions were higher for the groups with high variable pay than with low variable pay.
Figure


Related documents
The Seismic Provisions for Structural Steel Buildings, ANSI/AISC 341-05 [AISC, 2005c], which apply when the seismic response modification coefficient, R, (as specified in the
Rotating inside knob/ lever simultaneously retracts latchbolt and unlocks outside knob/lever.. Auxiliary latch deadlocks latchbolt when door
Valve spring seat: asiento de muelle de válvula. Valve stem: cola de
Keywords: diesel generator; wind turbine generator; isolated microgrid; flywheel energy storage; dump load; power systems simulation; power systems
Year 5 Figure 2.1 Construction project lifecycle 12 Figure 2.2 Risk Management Planning Process 14 Figure 2.3 Probability-impact grid 18 Figure 2.4 Probability and Impacts of Risk
When one is abusive, when one is hurting so much on the inside that it feels like the only way to make it stop is to hurt other people, it can be terrifying to face the hard truth
• If possible…Do not lead OSHA Inspector past or through a work area that may be out of compliance with OSHA regulations that day..
non-farm functions.. • Enhanced Access to Broadband Service to Rural Areas provided $10 million-$20 million per year, FY2002-FY2007, in grants and loans. • Rural Local
