The London School of Economics and Political Science
Essays in Public Economics
Mohammad Vesal
A thesis submitted to the Department of Economics of the London
School of Economics and Political Science for the degree of Doctor of
Declaration
I certify that the thesis I have presented for examination for the PhD degree of the London School of Economics and Political Science is solely my own work other than where I have clearly indicated that it is the work of others (in which case the extent of any work carried out jointly by me and any other person is clearly identied in it).
The copyright of this thesis rests with the author. Quotation from it is permitted, provided that full acknowledgement is made. This thesis may not be reproduced without my prior written consent.
I warrant that this authorisation does not, to the best of my belief, infringe the rights of any third party.
The following disclimar applies to chapters 1 and 2 of the thesis that are based on HMRC data: This work contains statistical data from HMRC which is Crown Copyright. The research datasets used may not exactly reproduce HMRC aggregates. The use of HMRC statistical data in this work does not imply the endorsement of HMRC in relation to the interpretation or analysis of the information.
I declare that my thesis consists of 44206 words in total.
Abstract
Acknowledgments
I am extremely grateful to my supervisors Tim Besley, Henrik Kleven, and Johannes Spinnewijn for all their support and encouragement through my PhD. Without their help and guidance the chapters of this thesis would not have been possible.
Chapters of this thesis have beneted from presentations at HMRC, RES Annual Conference 2014, PEUK Residential Conference 2014, Oxford CBT doctoral meet-ing 2013, LSE Public Economics, and Development Economics work in progress seminar series. I have also beneted from numerous discussions with colleagues at LSE and elsewhere. I especially would like to thank Michael Best, Florian Blum, Steve Bond, Shawn Chen, Frank Cowell, Michael Devereux, Jason Garred, Camille Landais, Li Liu, Ben Lockwood, Daniel Osorio Rodriguez, and Mazhar Waseem for great comments on various parts of the thesis.
I am also indebted to the HMRC datalab sta, especially Lucy Nicholson, Daniele Bega, Chioma Anaba, and John Haynes, for providing the data for chapters 1 and 2 and dealing with my numerous data requests.
Contents
Declaration 1
Abstract 2
Acknowledgments 3
List of Figures 6
List of Tables 8
1 Optimization Frictions in the Choice of the UK Flat Rate Scheme
of VAT 10
1.1 Introduction 10
1.2 Flat Rate Scheme 15
1.3 Data 19
1.4 FRS gainers 24
1.4.1 Calculation of FRS gains 24
1.4.2 FRS gainers characteristics 25
1.5 Uncertainty 40
1.6 Evidence on type of frictions 46
1.6.1 Non-parametric estimation 49
1.6.2 Semi-parametric estimation 51
1.7 Conclusions 56
2 Stimulus eect of the UK 2008 VAT rate cut 57
2.1 Introduction 57
2.2 Context 63
2.2.1 Standard rate cut 64
2.2.2 Assessments of the cut impact 66
2.4 Empirical Strategy 78
2.5 Results 80
2.5.1 Graphical evidence 81
2.5.2 Regression evidence 89
2.6 Conclusions 94
3 Educational Impact of Iran Iraq War 95
3.1 Introduction 95
3.2 Context 99
3.2.1 Education system in Iran 99
3.2.2 Iran Iraq War (IIW) 100
3.3 Data 102
3.4 Empirical Strategy 105
3.5 Results 108
3.5.1 Graphical evidence 109
3.5.2 Regression results 109
3.6 Alternative Explanations 113
3.6.1 Sample selection 117
3.6.2 Baby boom 123
3.6.3 Ethnic rebellions 124
3.6.4 Other confounding events 124
3.7 Conclusions 127
References 129
A Flat rates for FRS categories 136
B Calculation of FRS gains 138
B.1 Assigning at rates to traders 139
B.2 Assignment Reliability 141
B.3 Complications in calculation of gains 143
C Data cleaning procedures for chapter 1 145
C.1 SIC2007 corrections 145
List of Figures
1.1 Probability of joining FRS on or before analysis time 21
1.2 Composition of FRS inow and outow 22
1.3 Sales distribution for FRS traders and FRS gainers 27 1.4 Probability of joining FRS versus months since rst gained 29 1.5 Fraction of traders eventually joining FRS after x years of gaining 31 1.6 Unconditional and conditional probability of FRS gains 32 1.7 Distribution of number of years gaining conditional on gaining once 33
1.8 Distribution of FRS tax gains for gainers 35
1.9 Medians of FRS gains as a percentage of VAT liability 36 1.10 Distribution of FRS traders, FRS gainers, and eligible VAT traders
across at rate categories 39
1.11 Probability of joining FRS conditional on last year gains 41 1.12 Impact of last year FRS gains on current gains 43 1.13 Percentiles of FRS gains as a percentage of VAT liability in t for
traders observed to gain in t−1 45
1.14 Probability of joining FRS for dierent VAT registration periods 52 1.15 Probability of joining FRS for deciles of initial FRS density 53
2.1 Total VAT receipts 58
2.2 VAT rates over time 66
2.3 Change in value added and consumption (% on quarter a year earlier) 70 2.4 Distribution of eective output and input tax rates before and during
the VAT cut 76
2.5 Change in log sales, purchases, and value added for standard and
zero-rated traders 84
2.6 Change in log sales, purchases, value added (restrict to traders with
standard-rated purchases) 85
2.7 Change in log sales, purchases, and value added (restrict to traders
2.8 Change in log sales, purchases, and value added (restrict to retail sector) 87 2.9 Change in log sales, purchases, and value added (Large vs. small
traders) 88
3.1 Expansion of modern education in Iran 101
3.2 War hit provinces 103
3.3 Average high school graduation rate for birth cohorts 111 3.4 Coecients estimates for interactions of cohort by war province 115 3.5 Net in-migration into provinces during and after war period 120 3.6 Impact of non-migrants restriction on war and non-war provinces 121
3.7 Number of registered births over time 125
List of Tables
1.1 FRS turnover eligibility criteria 18
1.2 Number of VAT and FRS traders 20
1.3 Summary statistics 23
1.4 FRS gainers studied 25
1.5 FRS gainers among eligible VAT traders 26
1.6 Ten sectors with highest number of FRS gainers 38
1.7 Linear probability model of FRS gains 42
1.8 Estimates of hazard ratios (Cox proportional hazards model) 55
2.1 Activities under dierent VAT categories 64
2.2 Summary statistics 73
2.3 Transition probabilities between bands of τo prior to VAT cut 77
2.4 Joint density of eective output and input tax rates before cut period 78
2.5 Regression results for the whole sample 91
2.6 Coecients and standard errors for DD estimate of the cut impact 92
3.1 Evolution of education system in Iran 100
3.2 Summary Statistics 106
3.3 Average rate of nishing high school 110
3.4 Main regression results 114
3.5 Robustness regressions 115
3.6 Regression results for redened treatment groups 116
3.7 War migrants as of June 1982 118
3.8 Regression results for probability of living in birth place 122 3.9 Regressions for ruling out alternative stories 126
B.1 Main sectors that are not assigned a at rate 140 B.2 Weights used for assignment of at rates during the change years 141 B.3 Sectoral average absolute dierence between assigned and observed
C.1 Mis-matches in SIC codes 146
C.2 Change of SIC2007 codes across years 147
Chapter 1
Optimization Frictions in the Choice
of the UK Flat Rate Scheme of VAT
1.1 Introduction
There is growing evidence in public economics that optimization frictions play an important role in shaping individual behavior. Whether small businesses are subject to similar frictions has not received much attention. An individual owner-manager is often responsible for business decision making but theoretically, one cannot gener-alize the individual-based evidence to small businesses. Business owners have shown particular skills (e.g. started a business) that might reduce the eect of frictions. Understanding role of optimization frictions in the business environment is important from two perspectives. Conceptually, it aects the way economists think about prot maximization. From a policy perspective, it is important to understand frictions in business decision making to design eective support schemes.
percentage of gross sales, relieving traders of the need to account for various rates separately. In order to compensate for the inability of FRS traders to reclaim pur-chases VAT, HMRC sets sector specic at rates so that on average FRS and VAT liabilities are equalized.
In order to join the scheme, traders need to ll out a one-page form telling HMRC of their main activity (and hence at rate) and declaring their eligibility. In the absence of optimization frictions, eligible traders should join FRS when expected net benets are positive. While the scheme could potentially benet traders via reduced tax payments and lower compliance cost, I focus on pure tax savings for two reasons. First, anecdotal evidence suggests tax savings play a key role in the FRS joining decision. For example, an HMRC study of compliance cost of VAT conducted by KPMG reports the predominant theme ... is that [traders] enter into the FRS to save them money in terms of the amount of VAT paid to HMRC (KPMG (2006)). Second, returns data does not provide any information on the amount of time businesses spend on preparing their VAT returns or whether they use tax preparators.
I dene FRS gainers as eligible VAT traders with observed FRS liability less than or equal to the reported VAT liability. I show that between 2004-05 and 2010-11, 26 percent of eligible traders are FRS gainers. Following FRS gainers over time reveals little responsiveness. The estimated probability of joining within one year of gaining is 3 percent and increases to 10 percent after six years. This is despite the fact that gains are persistent and not very small. On average 70 percent of FRS gainers in a given year remain a gainer in the following year and the median FRS gainer would save about 12 percent on VAT payments upon joining the scheme.
Since FRS joining decision is made ex ante, inaction of gainers is not necessarily a sign of sub-optimal choices. Risk neutral traders would join the scheme when expected benets are positive. Presence of uncertainty could result in observed gains even if expected gains are negative. Two pieces of evidence, however, go against this explanation. First, I show the probability of joining FRS rises sharply as traders get slightly positive gains. This suggests that at least for a sub-sample of traders, observed gains could be interpreted as expected gains2. The caveat here is that the sub-sample of responsive traders might have dierent risk preferences or face a
liability from HMRC's perspective. Similarly I refer to tax liability under normal VAT accounting as VAT liability.
2This requires the assumption that traders joining the scheme are not making a mistake
dierent level of uncertainty.
The second piece of evidence against uncertainty is the fact that FRS gains are highly persistent. Even after controlling for sector and year dummies, last year gainers are on average 62 percentage points more likely to gain in the following year. Furthermore, the probability of gaining in future rises very sharply right at zero past gains and goes beyond 80 percent for traders with gains above ¿1000 during last year. The distribution of current FRS gains conditional on gaining in the last year shows a median tax saving of 10 percent of VAT liability and a mean of just above zero for large enough traders3.
After discussing that uncertainty cannot fully explain inaction of FRS gainers, I move to characterize the frictions that prevent traders from joining using temporal and spatial correlations. Here, the FRS joining patterns support a combination of broadly dened information frictions and learning as key drivers of inaction. I dene information frictions to include both lack of knowledge about FRS rules and unawareness of its existence. I use learning to refer to a case where traders know about the scheme but are not certain about its benets. This could be a result of uncertainty or a consequence of incorrect prior beliefs about suitability of FRS. First, I conjecture that VAT registration is a period of intense learning about VAT rules. Therefore the chance of coming across FRS is the highest during this time. I split the sample into three groups based on the date of VAT registration: a) pre-FRS traders who registered before introduction of pre-FRS, b) early-pre-FRS traders who registered after introduction of FRS but before major reforms in 2004, and c) late-FRS traders who registered after favorable late-FRS reforms in 20044. Late-FRS traders could learn about the reformed FRS and are expected to have the highest chances of joining the scheme. On the other hand, pre-FRS traders registered when FRS was not in place and should have least awareness of the scheme. Consistent with this reasoning, non-parametric estimates of joining probabilities are always signicantly higher for late-FRS compared to early-FRS traders. Similarly early-FRS traders show higher joining probabilities relative to pre-FRS traders. Restricting the sample to FRS gainers conrms a similar pattern: late-FRS gainers are signicantly more likely to join FRS with early and pre-FRS groups lagging behind.
3With risk averse preferences, positive expected FRS gains may not justify optimality of uptake.
In section 1.5 I discuss some features of the scheme to argue that even gainers with risk averse preferences might benet from the scheme.
4In 2004 FRS rates were reduced and a temporary 1 percentage point discount was applied to
Second, I argue that traders registering in postcode districts (outcodes) with a higher density of FRS traders are expected to have higher FRS awareness (e.g. through peer groups). I look at joining probabilities for traders registering in high and low FRS density outcodes. The non-parametric estimates show, traders registering in the highest decile of FRS density are signicantly more likely to join the scheme compared to those in the lowest decile. Furthermore, FRS gainers registered in outcodes with higher FRS densities are signicantly more likely to join the scheme later on.
For both temporal and spatial correlations, I observe that joining probabilities in-crease over time. In other words, it seems that some FRS gainers realize that they could gain from FRS and join the scheme later on. While this pattern could be consis-tent with inertia (sluggish responsiveness), learning, or gradual spread of information about the scheme, I argue that the spatial correlations are not fully consistent with inertia. For example, inertia cannot explain the higher joining probabilities for high FRS density outcodes unless a disproportionate number of more active traders are registered in these places.
To look at the relative importance of these explanations and to rule out inertia I estimate Cox proportional hazard (CPH) models. After controlling for 5-digit sectors and FRS density deciles (stratied CPH), I still nd traders registering later are more likely to join the scheme. Furthermore, I nd support for learning. An additional year of gaining leads to higher likelihood of joining even after controlling for period of registration. Including a continuous variable for FRS density (instead of stratication on decile dummies) shows traders in outcodes with higher FRS densities are more likely to join the scheme.
The conclusion that small traders are susceptible to optimization frictions resonates with the results of Devereux et al. (2014) who nd small incorporated businesses are not completely shifting their incomes to the corporate base while in a frictionless world it is optimal to do so. Their preferred explanation is illiquidity of corporate prots and the need for having a stable ow of income (e.g. in the form of personal income). In this paper, however, I argued for presence of information frictions which implies gainers would join FRS if they get the right information. My results suggest small businesses might be subject to optimization frictions similar to those observed in the context of individual decision making. Accepting this view in the case of FRS, calls for a more eective role of the government in publicizing the scheme.
of frictions in the process of individual decision making. Chetty et al. (2011) nd that presence of search costs and hours constraints imply individuals re-optimize only when the tax gains are suciently high. This is consistent with an observed positive correlation between estimated labor supply elasticities and size of tax variations in Denmark. Kleven and Waseem (2013) nd a signicant mass of individual tax lers in Pakistan locate in strictly dominated regions above tax notches. They provide evidence that 90% of wage earners and 50-80% of self-employed in these areas are not responsive to tax incentives potentially due to frictions. Jones (2012) provides evidence that inertia could explain why so many income tax lers receive a tax refund although it might be optimal to adjust tax payments and not pay the money in the rst place.
Bhargava and Manoli (2013), Chetty et al. (2013), Liebman and Luttmer (2011), Saez (2009) nd direct evidence that provision of information changes individual decisions. Bhargava and Manoli (2013) design a randomized experiment to understand high non take-up of EITC benets. They nd re-sending a reminder letter for potential EITC benets is most eective in increasing take-up when the information is simplied and the size of potential benets is displayed. Chetty et al. (2013) show neighborhoods with higher EITC information are more responsive to the incentives created by the program and households moving into high information areas start to optimize their EITC soon after. In the context of social security Liebman and Luttmer (2011) nd an information brochure and an invitation for a web based tutorial increases labor force participation by 4 percentage points one year later. Saez (2009) shows both explaining incentives and presentation details matter for take-up of retirement savings subsidies.
Some other studies however nd a minimal role for information indirectly pointing to signicance of other frictions. Chetty and Saez (2013) show there is a limited eect of providing information on take-up of EITC in a randomized setting. Jones (2010) nds providing information about advance EITC, an add-on feature paying interim installments, does not change take-up of the program signicantly. Inves-tigating retirement saving decisions Choi et al. (2011) nd providing information to 401(k) participants with strictly dominated contribution rates does not change their behavior signicantly. They conjecture presence of biased preferences might be responsible for unresponsiveness.
of VAT traders benet from FRS but fail to join the scheme. In section ve I discuss why uncertainty cannot fully explain inaction of FRS gainers. Section six presents temporal and spatial correlations that suggest information frictions and learning are potential explanations for low uptake. The last section concludes.
1.2 Flat Rate Scheme
HMRC rst announced the Flat Rate Scheme of VAT for small businesses (FRS) with a consultation in June 2001. The scheme came to force from 24 April 2002 as part of the Finance Act 2002 with the stated purpose of reducing compliance burden of VAT on small businesses. Businesses in the UK must register for VAT when their annual turnover goes beyond a registration threshold (¿67,000 during 2008). VAT features three dierent rates (standard, reduced, and zero) and a set of exempt activities. Normal VAT liability is the dierence between VAT on sales and purchases while VAT liability under FRS is the multiplication of a sector specic tax rate and total turnover. As a result FRS requires businesses to keep track of total turnover rather than separate record of transactions under each of the various VAT rates and therefore it is thought to simplify compliance. Eectively VAT is a tax on value added while FRS liability is a tax on gross sales as shown below:
TV = τVvSg (1.1)
TF = τFSg (1.2)
whereTV andTF respectively represent VAT and FRS liability, Sg is gross sales,v is
share of value added (dened as Sg−Pg
Sg , withPg being gross purchases),τV is eective
VAT rate (dened as TS−TP
vSg , withTs andTp respectively showing sales and purchases
VAT), and τF is the at rate percentage. Eligible traders decide ex ante to be liable
either forTV orTF over an accounting period. HMRC sets at rates by sector so the
average traders within sectors are indierent between FRS and VAT: We calculate the at rate percentages from the net tax paid by all the businesses that are currently registered for VAT and eligible for the scheme. The net tax paid varies with dierent trade sectors and so there are a variety of at rate percentages5. Nevertheless traders with lower than average purchases VAT would get substantial gains from FRS. For example, a management consultant with no purchases VAT could save 16 percent
on VAT payment by joining FRS during 2004-76. There are around 16 distinct at rates ranging from 2 to 14.5 percent (appendix A). On January 2004, HMRC lowered all but one at rate, increased eligibility thresholds, and incentivized new VAT registrations to join FRS by oering a 1 percentage point discount on at rates within the rst 12 months of registration. To maintain the attractiveness of FRS when standard VAT rate changed, HMRC revised the at rates on 1 December 2008, 1 January 2010, and 4 January 2011.
While FRS is advertised as a compliance cost saving scheme7, anecdotal evidence sug-gests most businesses view the scheme as a tax saving opportunity. An HMRC study of VAT compliance cost reports that the predominant theme ... is that [traders] en-ter into the FRS to save them money in en-terms of the amount of VAT paid to HMRC (KPMG (2006)). Same study states that businesses spend resources to determine whether FRS is suitable for them, which suggests information about FRS gains is not readily available. In addition, in the initial FRS consultation, accountancy rms argued the scheme would not generate any of the intended savings and opposed the scheme as undermining VAT accounting discipline (HM Customs and Excise (2002)). Presence of any compliance cost savings would strengthen the evidence on the sub-optimality of the inaction of FRS gainers. But I ignore compliance cost savings in what follows because returns data does not provide any information on the amount of time businesses spend on preparing their VAT returns or whether they use tax preparators8.
Eligible VAT traders could easily and quickly join or leave FRS. Traders wishing to join, ll in a one-page application form declaring main activity from the list in appendix A, the corresponding at rate, and sign that they are eligible. FRS start
6τ
F for management consultants is 12.5 percent. With a standard-rate of VAT equal to 17.5 percent, the VAT rate on gross sales is τV = 1+00.175.175 = 14.9 percent. Therefore, when the trader does not use any tax-refundable inputs (i.e. v = 1) the FRS gain as a percentage of current VAT
liability is1−TF/TV = 1−12.5/14.9= 16.1percent.
7Initially FRS was claimed to save on average about ¿750 (HM Customs and Excise (2002)) but
later an impact assessment puts the average compliance savings at ¿45 (HMRC (2009)). The rst estimate is based on saving 45 minutes of clerical time at an hourly wage of ¿16 over the course of 52 weeks plus ¿100 saving on accountants' fees. The second estimate uses a Standard Cost Model but details of calculations are not disclosed.
8There is some evidence that a move to FRS might actually increase compliance costs.
date is normally the beginning of next VAT period (a quarter for most of traders) and backdating is not normally allowed. Businesses wishing to leave the scheme write to HMRC of their decision and normally stop FRS at the end of current VAT period. Again retrospective departure is usually not allowed. There is no statutory minimum term for being on FRS but once left FRS, the trader cannot rejoin within the following 12 months. As a measure of revenue protection HMRC reserves the right to withdraw the scheme (even back date the withdrawal) in fraudulent cases. FRS eligibility is based on turnover and non-turnover criteria. Table 1.1 shows turnover eligibility rules. Joining eligibility is based on two tests. Expected taxable turnover should be below a threshold (¿150,000 during 2004-10) and expected total turnover should be less than a second threshold (¿187,500 until December 2010). Once on the scheme, traders remain eligible until their FRS turnover crosses the continuation threshold (¿225,000 during 2004-10). The joining tests are based on forecasts of turnover. Instead, I use actual turnover to determine eligibility. This should do no harm because HMRC suggests traders could use last year turnover as a benchmark for their forecasts and also there is no penalty for falling above the joining threshold once on the scheme. Furthermore, during my sample, a small fraction of eligible traders become ineligible in the following year (8 and 10 percent of FRS gainers and losers respectively).
There are ve mostly unobservable non-turnover eligibility criteria that apply at all times9. Since the main claim in this paper is that some eligible traders are missing out on tax saving opportunities, it is important to rule out unobserved ineligibility of gainers as a potential explanation. First, traders who were on FRS during the past 12 months cannot rejoin the scheme. Second, rms registered or eligible to be registered as a VAT group in the past 24 months are ineligible. While I observe traders registered as groups during the sample, I do not have information on those eligible for group treatment or prior group registrations. It is, however, encouraging to note that only 0.3 percent of VAT traders below FRS continuation threshold are registered as a group.
Third, FRS cannot be combined with certain VAT schemes (capital goods10, cash accounting, retail, tour operators, margin and auctioneer's schemes). I do not have reliable information on take-up of these schemes but several observations justify 9Unfortunately, ocial data on the number of ineligible traders or applications ruled out as
ineligible is not available.
10Traders purchasing property or doing refurbishment with a value greater than ¿250,000 or
Table 1.1: FRS turnover eligibility criteria
Dates Joining eligibility Continuationeligibility
FRS turnover (incl. VAT) Test 1
Taxable turnover (excl. VAT)
Test 2 Total turnover
(excl. VAT)
April 02 - December 03 <100k <125k <150k
January 04 - February 07
<150k
<187.5k
<225k
March 07 - December 10 <187.5k
January 11 - now - <230k
Notes: Taxable turnover (test 1) is the sum of zero, reduced and standard rated supplies excluding any VAT. It excludes exempt supplies and non-business income like charitable or educational activities. Total turnover (test 2) is taxable turnover plus exempt supplies, and non business income such as charitable and educational activities. During March 2007 until December 2010, total turnover for test 2 includes VAT. FRS turnover is VAT inclusive total turnover (e.g. includes exempt, zero, reduced, and standard rated supplies plus any VAT but exclude non business income). Non turnover eligibility criteria are the same across the years. Sources: FRS notices dated February 2004, March 2007, January 2010, April 2011, August 2011, October 2012.
ignoring them. FRS provides an alternative to cash accounting and retail schemes. Furthermore, it is unlikely that traders on margin and tour operator schemes benet from FRS because of the high level of VAT refunds they receive with these schemes. Therefore, remaining on another scheme is unlikely to be an important factor in analysis of FRS gains.
Fourth, any VAT conviction or dishonesty in the past 12 months disqualies the rm. Data on VAT dishonesties and convictions is not available. It is, however, unlikely that a big part of FRS gainers fall in this category. National Audit Oce reports that out of 196,000 investigations during 2002-03 nancial year around 30% of cases had VAT under-declaration but only 4% received a penalty (National Audit Oce (2004)). Furthermore, traders with negative VAT liability are under greater scrutiny and a disproportionate number of them are caught in fraudulent activities (National Audit Oce (2006)). But traders receiving a net VAT refund would not gain from FRS since my calculated FRS liability is always positive.
under FRS running entity but report purchases under the one using normal VAT. While HMRC collects data on connections to other businesses from VAT registration form, this data is not available for the current paper. Given the large number of gainers and the small size of traders involved it seems unlikely this criterion creates a major problem.
1.3 Data
Data used in this paper is the annualized version of all VAT returns submitted to HMRC between 2004-5 and 2010-11 nancial years. This data has become available recently and this is the rst paper analyzing FRS using this data. VAT returns include information on sales, purchases, and corresponding VAT on each but does not provide separate account of transactions under each VAT rate. The returns data is merged with part of HMRC's trader characteristics dataset which provides information on date of registration, date of deregistration, date of joining/leaving FRS, sector of activity, frequency of submitting returns, ownership form, and a few other variables. I refer to this dataset as returns-level data as it includes all returns submitted by traders. From this, I also construct a trader-level dataset which has one observation per trader and records the date of certain events of interest (e.g. VAT registration, joining FRS, etc.). The trader-level dataset only contains traders who are observed to be eligible at least once during the sample (includes FRS traders as well).
Table 1.2 shows the total number of available observations before and after cleaning, and the number of returns submitted by VAT and FRS traders during each nancial year. There are around 2 million VAT registered traders in each year (column (1)). Dropping inactive traders, returns reporting zero sales, and other anomalies (see table notes and appendix C for more detail) result in around 1.5 million returns per year (column (2)) . This constitutes the working sample for the analysis in the paper. Based on observable eligibility criteria (see section 1.2) on average 54 percent of VAT traders are FRS eligible (column (4)). Column (5) reports the number of returns submitted by FRS traders which is a relatively small fraction of total returns (column (6)). The fraction of FRS returns increases from 9 to 21 percent of all eligible traders between 2004 and 2010 (column (6))12. The increase in share of FRS traders during 12Eligible traders is used to refer to VAT traders who are eligible for FRS. All eligible traders
Table 1.2: Number of VAT and FRS traders Financial year All obser-vations Workable Sample VAT traders % FRS eligible FRS traders
FRS % of eligible
(1) (2) (3) (4) (5) (6)
2004-5 1,894,281 1,472,918 1,398,324 56% 74,594 9%
2005-6 2,177,146 1,512,156 1,413,470 57% 98,686 11%
2006-7 2,221,095 1,529,537 1,404,911 54% 124,626 14%
2007-8 2,118,562 1,575,018 1,420,959 54% 154,059 17%
2008-9 2,173,977 1,422,206 1,256,822 51% 165,384 21%
2009-10 2,123,413 1,448,423 1,280,881 52% 167,542 20%
2010-11 2,120,552 1,499,923 1,320,226 52% 179,697 21%
Total 14,829,026 10,460,181 9,495,593 54% 964,588 16%
Notes: Column (1) is number of all available returns. Column (2) shows the cleaned data used for all subsequent analysis and restricts the sample to a) live traders (not reported to be deregistered and identied as live trader at the end of scal year by HMRC), b) observations with positive and non missing sales, c) observations with outputs and inputs less than the 99th percentile of the respective distributions, d) observations implying an eective output and input tax rate less than the standard rate plus half a percentage point, e) rms listed as sole proprietors, partnerships, and incorporations, and f) traders with monthly or quarterly VAT returns. Column (3) shows number of VAT returns on normal VAT accounting. Column (4) demonstrates the fraction of VAT traders eligible for FRS based on all observable eligibility criteria (see text for details). Column (5) shows the number of FRS traders and column (6) present FRS traders as a fraction of all eligible traders (actual FRS and FRS eligible traders).
the sample period suggests FRS awareness is increasing but this pattern could be a result of sluggish responsiveness (inertia) or experimenting with VAT (learning). Many of the traders joining FRS are doing so right at the time of VAT registration. Figure 1.1 shows Kaplan-Meier nonparametric estimate of probability of joining FRS over time13. The analysis time reects the months FRS option was available to the trader. 9 percent of traders join FRS as soon as they have the option to do so. While in principle this jump could be a result of existing VAT traders joining when FRS was introduced, evidence shows this is due to a large number of new traders joining FRS at the time of VAT registration (gure 1.14). After the initial jump, the joining probability continues to rise and by the end of 9 years of exposure to FRS it reaches 18 percent14.
13See section 1.6 for a discussion of Kaplan-Meier method.
14The end point estimate of probability of joining FRS is smaller than the fraction of FRS traders
Figure 1.1: Probability of joining FRS on or before analysis time
Notes: Figure shows Kaplan-Meier nonparametric estimate of probability of joining FRS on or before analysis time. Analysis time measures the time since traders had the option of joining FRS. The zero corresponds to date of VAT registration for traders registering after April 2002, when FRS is available, but is xed at April 2002 for those already registered when FRS was introduced. Traders who were VAT registered at the time of FRS introduction in April 2002 had the option of joining FRS for 109 months at the end of sample on April 2011. Figure uses trader-level dataset with 1,803,179 traders. 165,967 join FRS as soon as they have the option to do so (t= 1) and 129,318 join
FRS traders in t 71%
23% 6% VAT in t-1
FRS in t-1
New VAT reg
3% 81%
16%
VAT in t+1
FRS in t+1
Exit in t+1
Figure 1.2: Composition of FRS inow and outow
Notes: Figure uses returns-level dataset and follows traders overtime. The inow gures are based on last year status of traders observed on FRS during 2005-2010 nancial years (148,332 average number of traders on FRS in this period). The outow gures are based on what happens to traders on FRS during 2004-2009 nancial years in the next year (130,815 is the average number of FRS traders during this time). New VAT registrations are traders within the rst twelve months of VAT registration.
Figure 1.2 shows composition of traders joining and leaving FRS. On average 81 percent of current FRS traders remain on FRS and only 3 percent revert to normal VAT in the next year. 16 percent of current FRS traders also exit data which seems normal given the small size of eligible traders. On the inow side, new VAT registrations comprise a signicant addition to FRS. While 71 percent of current FRS traders were on FRS in the last year, 23 percent are coming from new registrations as opposed to 6 percent from existing VAT traders. In summary, gure 1.2 shows FRS is close to an absorbing state and most of the additions are from newly registered traders.
Table 1.3 shows summary statistics for three sub-samples: a) VAT traders below FRS continuation threshold of ¿225,000, b) FRS traders, and c) eligible VAT traders with gains from FRS (next section). The top panel lists tax variables while the bottom panel shows indicator variables. Average FRS trader has a similar turnover to average eligible gainer but they are smaller than average VAT trader. FRS traders pay higher net VAT compared to VAT traders but slightly less than eligible gainers. Eligible gainers also have much lower average inputs and input VAT compared to VAT traders. This is consistent with the intuition that FRS is benecial for rms using fewer inputs. FRS traders report inputs only if they purchase capital goods with a value greater than ¿2000 or under special circumstances. This pulls down average inputs and input VAT for FRS traders.
Incorporated businesses, with a share of 70%, dominate the population of FRS traders. They have a more balanced share among VAT traders and FRS gainers (43 and 48 percent respectively). Both sole proprietors and partnerships are under-represented in FRS. This suggests that sole proprietors and partnerships are less
Table 1.3: Summary statistics
Variables A. VAT traders (sales≤225k)
B. FRS traders C. eligible FRS gainers
Mean S. Dev. Median Mean S. Dev. Median Mean S. Dev. Median Gross Outputs 82,543 61,268 71,711 76,197 82,671 68,393 75,548 45,913 70,916 Output VAT 9,463 8,715 7,306 8,758 9,592 7,809 10,903 6,679 10,211 Gross inputs 62,746 161,909 37,836 4,805 32,542 0 25,068 46,783 12,967 Input VAT 6,335 18,303 3,464 360 2,559 0 2,161 2,889 1,119 Net VAT 3,190 18,837 2,818 8,407 9,323 7,545 8,821 5,672 8,045 % sole
proprietor
37.8 23.8 35.7
% incorporated 43.4 69.8 48.1
% partnership 18.9 6.4 16.2
% EC Trader 21.7 9.6 20.6
%Group registrations
0.3 0 0
% Partial Exempt
1.4 0.2 0.91
Notes: Based on 2004-10 data and the working sample shown in 1.2. The number of observations are 5,822,956 for VAT traders, 964,588 for FRS traders, and 1,049,218 for eligible gainers. 255,215 of FRS returns show non zero input and input VAT but some of these relate to traders who are submitting a mix of FRS and VAT return. There are 720,856 pure FRS returns (12 months on FRS) and 85,476 of these report a non-zero input VAT (12 percent) with an average input VAT of ¿2,125. EC Trader counts both former and present traders with EU transactions. Partial exempt counts all traders with some form of partially exempt supplies. Group registration shows fraction of divisional and representative registration.
likely to utilize FRS opportunity15. The last two rows show the fraction of group registrations and partially exempt traders are very small among VAT businesses. Group registrations are ineligible for FRS and hence the zeros under panel B and C. It is also less likely that partially exempt traders benet from FRS justifying smaller numbers under panel B and C.
15One likely reason for this could be the fact that a higher proportion of incorporated businesses
1.4 FRS gainers
1.4.1 Calculation of FRS gains
In order to assess whether traders are choosing the minimum tax scheme I need to calculate tax liability under the alternative scenario. VAT traders report VAT liability (TV in (1.1)). In order to calculate counterfactual FRS liability (TF in
(1.2)), I use traders' reported Standard Industry Classication 2007 (SIC2007) codes to determine the appropriate at rate (τF) which is then multiplied by the sum of
reported net sales and corresponding VAT. FRS gains are dened to be TV −TF.
Similarly an eligible VAT trader is an FRS gainer ifTV −TF ≥0.
I give a brief overview of determination of at rates and leave further discussions to appendix B where I also explain some complications in calculation of FRS gains. HMRC publishes applicable at rates for 56 categories of business together with the list of associated trade names. I match trade names to SIC2007 code descriptions from the Oce of National Statistics (ONS) to form a mapping between reported SIC2007 codes and published at rates. For example, ONS describes SIC2007 code of 70229 as management consultancy activities (other than nancial management). This description matches with the FRS category for management consultancy with
τF = 12.5percent during 2004-07. Using this manual matching, I assign at rates to
78 percent of eligible traders. The largest sectors left out are construction and some retail sectors because reported SIC2007 codes map to several at rates.
FRS traders make an active decision when joining FRS; therefore it is unlikely that they lose out from the scheme. Comparing FRS and VAT liabilities for FRS traders could shed light on importance of other issues (e.g. compliance cost savings) that might inuence the joining decision. For example, observing some traders remain on FRS despite having a lower VAT liability suggests that they get compliance cost reductions under FRS. Unfortunately, FRS traders only report gross sales (Sg), and
corresponding FRS liability (TF), making it impossible to calculate counterfactual
VAT liability (TV)16. I must estimate VAT liability for FRS traders which requires
estimation ofτV andv in (1.1). Absence of enough observable characteristics renders
regression based estimation of gains ineective and therefore, I exclude FRS traders. Table 1.4 summarizes the focus of this paper. FRS traders are left out but VAT 16To be more precise FRS traders report FRS turnover which in some cases might dier from
Table 1.4: FRS gainers studied
FRS gainer FRS loser FRS traders TˆV −TF ≥0
Left out
ˆ
TV −TF <0
Left out
VAT traders TV −TF ≥0
Focus of paper
TV −TF <0
Analyzed
traders are analyzed. The main message of the paper is, however, about the group of VAT traders who are observed to gain from FRS.
1.4.2 FRS gainers characteristics
Table 1.5 shows aggregate number of FRS gainers. Column (1) reports the number of eligible VAT traders under investigation (assigned τF). On average 26 percent of
573,347 eligible traders are FRS gainers but the percentage of gainers drops from 28 to 23 percent during the sample (column (2))17. Columns (4) shows percentage of FRS gainers who join FRS in the following year. On average only 3 percent of FRS gainers join the scheme in the following year and there does not seem to be a clear time trend. However, 70 percent of gainers remaining on VAT (do not exit or join FRS) still gain from the scheme in a consecutive year (column (5)). Column (6) checks the robustness of fraction of gainers by settingτF to the maximum applicable
rate in each nancial year. Even using this conservative approach 12 percent of eligible traders are observed to gain from FRS. This, to some extent, alleviates concerns about errors in assignment of at rates. Therefore, FRS gains seem to be persistent but majority of gainers are not responsive and remain on normal VAT. To compare size of gainers and current FRS traders gure 1.3 plots sales distribution (frequency) for the two groups. Both distributions are right-skewed suggesting FRS is suitable for small businesses and is inline with HMRC's design of the scheme as a small business program. The number of FRS gainers is almost similar to FRS traders for low levels of sales, but the ratio of gainers to FRS traders increases after ¿100,000 annual sales. Around the joining threshold (rst vertical line) there are three gainers for each FRS trader. Figure 1.3 also sheds light on gainers beyond 17The decline in the fraction of FRS gainers could be a result of information diusion over time
Table 1.5: FRS gainers among eligible VAT traders
year FRS eligible (assignedτF)
% FRS gainer
# FRS gainer
% Joined FRS
% FRS gainer next
year
% gainer (maxτF)
(1) (2) (3) (4) (5) (6)
2004 618,810 28% 172,421 3.5% 72.0% 14%
2005 635,295 27% 174,639 3.9% 69.0% 14%
2006 596,803 27% 161,942 2.8% 71.0% 14%
2007 602,626 27% 165,170 3.6% 69.9% 12%
2008 503,013 25% 125,155 1.9% 68.0% 11%
2009 523,772 24% 124,967 2.8% 68.5% 7%
2010 533,107 23% 124,924 - - 9%
Average 573,347 26% 149,888 3.1% 69.7% 12%
Figure 1.3: Sales distribution for FRS traders and FRS gainers
Notes: Figure shows number of traders within bins of gross output for FRS gainers and FRS traders. The sample is the returns-level dataset and includes all VAT returns submitted while traders are observed on FRS and all returns for FRS gainers during 2004 - 2010 nancial years. The sample here is bigger than the one reported in the tables because it includes traders above the FRS eligibility thresholds depicted by the vertical lines. I, however, exclude traders who are ineligible based on observable non-turnover criteria. The rst vertical line shows FRS joining eligibility threshold (150,000×(1+0.175) =£176,250during 2004-2010) while the second vertical line shows FRS continuation eligibility
threshold (£225,000during January 2004 until January 2011).
the joining eligibility. As we have seen in section 1.2 the joining threshold is not binding and traders above this threshold could in eect join the scheme. I ignore this possibility in table 1.5 but gure 1.3 shows there is a signicant mass of traders who could potentially gain in this region.
In the remaining part of this section I establish four empirical facts about the pop-ulation of FRS gainers:
Fact 1 Very few FRS gainers join FRS over time. 3 percent join in the following year and the estimated joining probability 6 years after gaining is 10 percent.
Fact 3 Size of FRS gains are not small. Median gainer could save 12 percent on VAT liability by joining FRS. 92 percent of gainers have a gain of ¿100 or more and 46 percent gain ¿1000 or more.
Fact 4 Gainers are concentrated in a few services sectors (consultancy and personal services)18.
Fact 1: Few gainers join the scheme
Figure 1.4 plots Kaplan-Meier non-parametric estimate of (cumulative) probability of joining FRS on or before the indicated number of months since traders are rst observed to gain. Similar to table 1.5, 12 months after gaining, probability of joining is about 3 percent. Interestingly, the likelihood of joining FRS shows a very gentle increase over time and reaches 10 percent after 6 years (72 months). The gradual increase in uptake of FRS suggests a potential role for learning and inertia which I discuss in more detail in section 1.6.
Figure 1.5 looks at the percentage of gainers eventually joining FRS. X-axis shows the number of years traders are observed to gain. Figure 1.5a considers all eligible traders and plots the fraction of traders in each x-axis category that are observed on FRS at any time during the sample. 13 percent of one-year gainers and 12 percent of two year gainers are ever observed on FRS while only 8 percent of traders gaining for more than two years join the scheme. Interestingly, 4 percent of traders who never gain join the scheme. While this is one third of the fraction of two year gainers who join the scheme, it suggests my calculations are unable to uncover gains for these traders.
Splitting the data into traders with dierent lifespans19 in gure 1.5b conrms the same pattern but also shows the percentage of gainers joining FRS is the highest among traders who are present in the full 7 years of my sample: almost 20 percent of one and two year gainers join FRS. In contrast, around 15 percent of one and two year gainers from 5 and 6-year traders join the scheme. The patterns observed in this gure could be consistent with inertia (sluggish responsiveness) and learning. 18I believe unobserved ineligibility is unlikely to overturn any of these facts. As discussed under
Observing one and two year gainers for longer (higher lifespan traders) increases the joining probability. Gaining for second years rather than one year also increases joining probability for 7-year traders (but not for traders with shorter lifespans).
Fact 2: Gains are persistent
Figure 1.6 looks at the persistence of FRS gains across sales levels. The solid line shows the unconditional probability of being an FRS gainer is rst increasing but quickly reaches a plateau after around ¿30,000 annual sales. The dashed line shows the probability of remaining a gainer conditional on being a gainer in the previous year. While this gure conrms the earlier fact that the conditional probability is much higher than the unconditional one (table 1.5), it reveals lower persistence of gains for very small traders and slightly higher than 70 percent conditional probabil-ity of gains for larger traders. Interestingly the conditional probabilprobabil-ity also reaches a plateau after ¿30,000 annual sales and there is little change in persistence of gains across sales levels after this point.
Figure 1.7 plots distribution of number of years gaining conditional on gaining once. Figure 1.7a shows the fraction of gainers that gained for less than 50 percent, exactly 50 percent, more than 50 percent and exactly 100 percent of the times they submitted returns. 34 percent of FRS gainers gain for all years while only 30 percent gain less than 50 percent of the times20. Figure 1.7b shows separate histograms for traders with dierent lifespans. For almost all lifespans the highest share is for traders gaining during their entire lifespan (far right dots for each curve). In summary these gures show a considerable share of traders gain during all years in the data, while many others have multiple years of gaining.
Fact 3: Gains are not small
Figure 1.8 plots the distribution of FRS tax gains for eligible VAT traders. The gains distribution has a mode at zero with 4.8 percent of the mass falling between ¿-100 and ¿100 FRS gains. This is due to HMRC's targeting of at rates to make the average traders indierent between FRS and VAT. A closer look at FRS gainers, 20In this gure, I have assumed traders who join FRS after x-year of gaining continue to gain
4% 13% 12% 8% 0% 5% 10% 15%
0-year 1-year 2-year >2-year
Fr a ctio n e v e n tu a lly jo ine d FRS
Number of years trader observed to gain
(a) Combined all lifespans
0% 5% 10% 15% 20% 25%
0 1 2 3 4 5 6
P e rcen ta g e o f trad e rs e v e n tu a lly jo inin g FRS
Years observed to gain
7-years in data 6-years in data
5-years in data 4-years in data
3-years in data 2-years in data
[image:32.612.139.513.80.605.2](b) Separately for dierent lifespans
Figure 1.6: Unconditional and conditional probability of FRS gains
Notes: The solid line shows unconditional probability of being an FRS gainer within bins of gross output, i.e. the ratio of gainers to FRS eligible traders within bins. Dashed line shows the probability of gaining from FRS conditional on being a gainer last year, i.e. the ratio of traders gaining for a second year among last year gainers who remain on VAT (do not join FRS or exit). The sample here is bigger than the one reported in the tables because it includes traders above the FRS eligibility thresholds depicted by the vertical lines. I, however, exclude traders who are ineligible based on observable non-turnover criteria. The rst line shows FRS joining eligibility threshold (150,000×(1 + 0.175) =£176,250). The second line shows FRS continuation eligibility threshold (£225,000).
30% 13% 23% 34% 0% 10% 20% 30% 40%
less than 50% Exactly 50% More than 50% 100%
Fr a ctio n o f g a ine rs
Probability of gaining during the years observed
(a) Combined histogram
0% 10% 20% 30% 40% 50%
1 2 3 4 5 6 7
Fr a ctio n o f g a ine rs
Number of years gained
7-year 6-year
5-year 4-year
3-year 2-year
(b) Separate histograms for dierent lifespans
i.e. the positive tail, reveals 92 percent of gainers have a gain of ¿100 or more and 46 percent gain ¿1000 or more.
Gains distribution reveals great asymmetry between gains and losses. Size of losses could potentially be much larger than gains: the rst percentile of gains distribution shows a loss of ¿27,800 while the ninety ninth percentile shows a modest gain of ¿4,800. This is also in line with a high proportion of FRS losers (table 1.5 reports 74 percent of eligible traders lose out from the scheme). One might expect that given the way HMRC sets at rates, this ratio should be closers to 50 percent21. But it should be noted that the gains distribution excludes the traders currently on FRS and includes eligible zero (and reduced) rated traders who would incur huge losses under FRS. I have no reliable information about how exactly at rates were calculated but it seems HMRC excluded zero-rated traders from this calculation (see discussion of gure 1.10 too). Furthermore, FRS traders are likely to have had gains from FRS and exclusion of such traders in the gains distribution would shift the ratios in favor of losers.
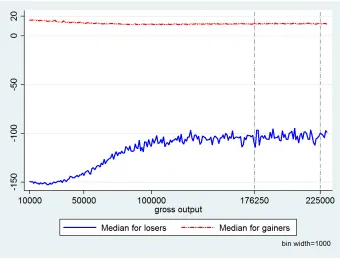
In order to get a better sense of size of gains, gure 1.9 looks at FRS tax gains as a percentage of reported VAT liability across sales levels. The gure plots medians of relative tax gains distribution separately for FRS gainers (above zero) and losers (below zero) within gross sales bins of ¿1000. The top part shows fairly stable and non-negligible tax gains for FRS gainers. Gainers with annual sales between ¿9500 and ¿10500 (rst bin) see a median reduction of 17 percent in their tax liability upon joining FRS. The median gain decreases to 12 percent for larger gainers but remains stable at this level. Perhaps not surprisingly, the bottom part conrms FRS losers incur large tax losses if they join the scheme. Median FRS losers with less than ¿50,000 annual sales would see an increase of 150 percent in their tax liability should they join FRS. This loss reduces to 100 percent for higher annual sales.
Fact 4: Gains are concentrated
To see the type of activities beneting from FRS, table 1.6 lists ten sectors with highest number of FRS gainers. These sectors comprise 51% of all FRS traders and 41% of all FRS gainers. This table shows FRS is suitable for a concentrated number of sectors. The list includes management consultancies, computer consultancies, 21Obviously, this assumes mean and median of VAT liability distribution within at rate
Figure 1.8: Distribution of FRS tax gains for gainers
Figure 1.9: Medians of FRS gains as a percentage of VAT liability
business support activities, and take away food shops. Interestingly, most of these sectors have at rates close to the high end of the range of applicable rates. Gains seem to be more persistent for these sectors: 77% of gainers who remain on VAT continue to gain int+ 1 (compared to 70% for all gainers in table 1.5). Conditional
median of gains (columns (6) and (7)) reveals non-negligible potential gains from joining FRS.
Figure 1.10 generalizes the patterns in table 1.6 by looking at distribution of FRS traders, gainers, and eligible VAT traders across at rate categories. Dots in the gure show proportion of the specied group that falls in the given at rate category. For example, the two far right solid blue circles show that the last two at rate categories contain 31 and 26 percent of all FRS traders. This gure shows proportion of eligible traders, FRS traders, FRS gainers, and the at rate percentages show positive correlations22. In other words, it seems there is a high concentration of FRS traders, gainers, and eligible traders in the higher at rate categories. This pattern is partly due to the concentration of total observations in these categories. The three most populous at rate categories are those with at rate percentages equal to 6, 12.5, and 13 with a respective share of 17, 14 and 13 percent of total observations (eligible plus FRS traders). All other sectors have less than 9 percent of traders. The other factor that explains this positive correlation is the positive correlation between FRS traders and FRS gainers (both as a % of eligible traders) within 5-digit SIC2007 codes. Sectors with a higher percentage of FRS traders also have a higher percentage of FRS gainers23.
This counter-intuitive pattern seems to be an artifact of HMRC's conservative ap-proach in setting the at rate percentages. Using returns submitted by FRS eligible VAT traders between 2004 and 2007 nancial years, I calculated the average of net VAT to gross sales within 5-digit SIC2007 codes, restricting to traders with a posi-tive net VAT. This average ratio should approximate the statutory at rates based on HMRC guidance on calculation of at rates. But when I compare calculated at rates to statutory rates, I nd that some sectors have statutory rates that are higher than the calculated ones24. These are mostly sectors with majority zero-rated traders 22The correlation coecient between proportion of FRS traders and FRS gainers is 0.76; for FRS
traders and eligible traders it is 0.36; for FRS gainers and eligible traders it is 0.70; for at rate percentages and FRS traders it is 0.62; and for at rate percentages and FRS gainers it is 0.54.
23Notice, this is the share of FRS traders and gainers from all traders in a given 5-digit SIC2007
code which is dierent from the share of population falling under each sector. Figure 1.10 is an aggregated version of the latter while table 1.6 is showing some evidence based on the former.
24The fact that some traders are on FRS during the time I am calculating the at rates implies
Table 1.6: Ten sectors with highest number of FRS gainers
Sector τF
(2004-7) % FRS % gainer % gainers join FRS
int+ 1
% gainers gaining in
t+ 1
Conditional Median of gains (¿) Conditional Median of gains % VAT
(1) (2) (3) (4) (5) (6) (7)
Management consultancy 12.5 35 36 5 74 522 7.5
Renting and operating of Housing Association
12 3 52 0 85 642 15
Computer consultancy 13 45 36 7 79 643 7.4
Other personal service activities
10 13 31 2 77 849 15
Other business support service activities
11 17 30 3 79 795 14
Other engineering activities
12.5 48 35 6 76 530 7.3
Take away food shops 12 31 39 5 84 808 7.2
Freight transport by road 9 17 29 1 67 461 8.5
Maintenance and repair of motor vehicles
7.5 10 29 2 76 841 13
Artistic creation 11 20 34 3 73 516 11
Figure 1.10: Distribution of FRS traders, FRS gainers, and eligible VAT traders across at rate categories
Notes: Figure shows distributions across at rate categories. Solid line shows fraction of FRS traders that fall in each at rate category, dashed line shows fraction of FRS gainers in each FRS category, and dot-dash line shows the fraction of eligible VAT traders within each at rate. Flat rate categories are based on the applicable rates during 2004-7 Flat rates range from 2 to 13.5 percent during 2004-2007, but 13.5 percent is excluded as I could not assign it. There are, therefore, 15 distinct at rates. The sample is the returns-level dataset and covers 2004-2010 nancial years.
or those with high input use (low share of value added) that feature a large number of traders with negative net VAT (repayment traders). Such sectors are unlikely to have a high number of FRS gainers if the calculation of at rates ignores the repay-ment traders. On the other hand, sectors with mostly standard-rated traders (e.g. management consultancy) would receive a statutory at rate closer to the sectoral average and hence are more likely to have a higher number of FRS gainers and FRS traders.
1.5 Uncertainty
Traders decide to join FRS before gains are realized. Assuming risk neutrality, basic economic theory suggests they should join FRS when expected after tax prots are greater under the scheme. So far, I have shown some traders are observed to gain. But this is not necessarily equivalent to expected gains. Therefore, inaction of identied FRS gainers could simply be an artifact of expected FRS losses, not sub-optimal choices. In this section I rst show that observed FRS gains inuence the joining decision of a sub-sample of traders. Then I reinforce fact 2 from the previous section on persistence of FRS gains to show that gaining once is a strong signal of expected gains. Finally, I discuss implications of risk averse preferences and consider a few features of the scheme that might alleviate concerns.
Figure 1.11 shows that the probability of joining FRS rises sharply around zero last year gains. In other words, a visibly higher proportion of FRS gainers join the scheme compared to FRS losers. This pattern conrms that calculated gains are not irrelevant and inuence the joining decision of a sub-sample of traders. Under the assumption that the responsive traders are not making a mistake themselves, I can conclude that observed gains are equivalent to expected gains for these traders. However, this gure might be less useful in ruling out uncertainty for the whole sample because the responsive traders might have dierent risk preferences or face lower levels of uncertainty.
Figure 1.11: Probability of joining FRS conditional on last year gains
Notes: Figure depicts probability of joining FRS in yeartconditional on falling in a given bin of FRS tax gains in
yeart−1. This is the ratio of the number of traders joining FRS to the number of traders remaining on VAT in year twithin FRS tax gain bins of yeart−1. Sample includes all traders who are eligible to join FRS during 2004-2009
Table 1.7: Linear probability model of FRS gains
Dependent Var: dummy for gainer (1) (2)
L.gainer 0.647
(.0078)∗
0.617
(.0068)∗
SIC2007 dummies NO YES
Year dummies NO YES
Notes: Table shows coecient estimates from an OLS regression of a gainer dummy on covariates. Gainer dummy is equal to one if trader is observed to gain from FRS in a given year and zero otherwise. Columns (1) and (2) control for trader's VAT registration time (two dummies capturing whether VAT registered between 1 April 2002 and 1 January 2004 and after 1 January 2004), ownership status (two dummies capturing incorporations and partnerships), Average log of gross output, average and standard deviation of FRS gains as a percentage of VAT liability, fraction of years trader was eligible for FRS, and a dummy for monthly returns. Column (2) further includes SIC2007 and year dummies and 9 dummies capturing the 2004 FRS density decile for registered outcode of trader. Standard errors are adjusted for SIC2007 clusters and shown in parenthesis. * shows if coecient is signicant at 1 percent level. The sample for both regressions is 3,449,070 returns during 2005-2010. It includes traders that were at least eligible for FRS once during 2004-2010 and drops sectors with less than 1000 observations during the 7 years of the sample. Notice the sample only includes traders NOT on FRS and those I could calculate whether they gain from being on FRS.
Figure 1.12b shows FRS gainers as a percentage of traders within bands of last year gains (the x-axis is the same as in gure 1.12a). The gure shows less than 20 percent of last year FRS losers become gainers. Perhaps more importantly percentage of gainers rises sharply right after zero to more than 70 percent. The fraction of gainers increases to 80 percent for traders gaining between ¿750 and ¿1250 during last year and continues to increase as the size of past gains increases.
To see the robustness of the persistence conclusion, table 1.7 shows the results of regressing an FRS gainer dummy on lag of the dependent variable and other co-variates. The coecient estimate of last year gains is highly signicant and shows the probability of gaining from FRS increases by 65 percentage points for last year gainers. Controlling for sector and year dummies reduces the coecient to 62 per-centage points. While these regressions suer from all sorts of endogeneity issues, they conrm that being an FRS gainer in the past is an important correlate of cur-rent gains even after controlling for sector and year dummies and other observable characteristics.
(a) Percentiles of tax gains in yeart in bins yeart−1gains
(b) Probability of FRS gains in bins of yeart−1 gains
Figure 1.12: Impact of last year FRS gains on current gains
Notes: Figure (a) shows twenty fth, ftieth (median), and seventy fth percentiles of FRS tax gain distribution in yeartfor VAT traders who were eligible for FRS in yeart−1within FRS tax gain bins in yeart−1. Solid black
line shows median and dashed gray lines show twenty fth and seventy fth percentiles. The solid gray line shows the 45 degree line. Panel (b) shows probability of having non-negative tax gains from FRS in yeartconditional on
being in a given bin of FRS tax gains in the previous year. This is the ratio of the number of traders gaining from FRS to the number of traders remaining on VAT in yeartwithin FRS tax gain bins of yeart−1. In both gures
restricts to traders who have gained a year earlier and shows the dependence of the distribution on sales. Median gains are fairly stable at around 10 percent of VAT liability25. Seventy fth percentile is also stable and shows 25 percent of last year FRS gainers save more than 20 percent on tax payment upon joining FRS. Twenty fth percentile of the gains distribution is negative up until ¿40,000 annual sales but becomes positive for larger traders26. I have plotted mean of gains distribution to shed light on expected gains for FRS gainers. Assuming that gains distributions for last year gainers in the same sales bin are identical, the mean of FRS gains in each sales bin is equal to expected gains for traders in that bin. Therefore, I can use the realized gains for this group to back out expected gains for individual traders27. The mean coincides with twenty fth percentile of FRS gains. For traders with gross sales less than ¿60,000, mean FRS gain is negative but traders larger than this level have positive mean. This suggests expected FRS gains for these traders.
So far I have assumed traders are risk neutral but would the same conclusions apply if traders are risk averse? Risk aversion could be important because as gure 1.13 shows the mean of FRS gains is almost 9 percentage points less than the median. In other words, there is a probability of incurring large losses even for last year FRS gainers. Therefore, while the mean of FRS gains is positive, the risk involved in opting in the scheme prevents risk averse traders from joining. This story suggests FRS liability is more volatile (involves higher uncertainty of after tax prots) compared to VAT liability. The summary statistics in table 1.3 shows coecient of variation for net VAT is 0.64 for eligible FRS gainers (panel C) while it is 1.11 for FRS traders (panel B). This shows FRS traders face greater dispersion in distribution of tax liability compared to eligible gainers which is in line with the above reasoning. It is not, however, clear that this gap is entirely due to greater uncertainty of FRS liability. For example, coecient of variation for gross sales shows a similar pattern. It is 0.61 for eligible gainers and 1.08 for FRS traders.
Two features of FRS alleviate some of the concerns arising from risk averse pref-erences. Infrequent large FRS losses (and higher volatility) could be a result of investments in capital goods. For example, management consultants might buy new computer systems every 5 years or take-away food shops might invest in new stoves 25The median gains as a percentage of turnover is also stable at around 1.5% (results not shown). 2625th percentile uctuates between a min of 0.2 percent and a maximum of 2.8 percent for
traders larger than ¿40,000 with an average of 1.5 percent. This suggests on average 25 percent of last year FRS gainers have a gain of 1.5 percent or less (maybe negative) in the current year.
27Obviously this is a crude way of estimating expected gains as there are very few controls (sales).
Figure 1.13: Percentiles of FRS gains as a percentage of VAT liability intfor traders
observed to gain in t−1
Notes: Figure shows twenty fth, ftieth (median), seventy fth percentiles and mean of FRS tax gain as a percentage of VAT liability distribution in yeartfor VAT traders who are observed to gain from FRS in yeart−1. Traders are
grouped in to bins of gross output in yeartand the statistics of the gains distribution are calculated separately for
every 10 years. These investments will imply large losses if traders could not recover input VAT. I do not observe these investments separately in the data and therefore assume traders cannot recoup any input VAT when I calculate FRS gains. But the rules of the scheme allow reclaiming of input VAT on capital expenditures exceeding ¿2000. Incorporating this possibility might remove the outliers in gure 1.13 and move the mean closer to the median.
The other feature of the scheme is its easy and quick leaving procedure. Traders can leave the scheme at the end of VAT periods (a quarter for most). Therefore, if traders could predict large upcoming purchases that do not qualify for FRS input recovery, they can simply leave the scheme. Inaction of gainers is justied only when traders face large urgent (unpredictable) purchases that happen with small probability and do not qualify for FRS input recovery. For example, traders might need to purchase large stocks of consumable inputs that could not be postponed until they leave FRS28.
1.6 Evidence on type of frictions
If uncertainty cannot fully explain inaction of FRS gainers what are the potential hurdles that prevent these traders from joining the scheme? In this section, I use temporal and spatial correlations in the data to justify a combination of information frictions and learning as the most prominent reasons for inaction. I dene informa-tion fricinforma-tions to include both lack of knowledge about rules required to calculate FRS liability and unawareness of the existence of the scheme29. Learning suggests traders know about the scheme but are not certain about its benets. Therefore, they might wait for some time to learn about the optimality of the scheme30. I will argue that inertia, i.e. sluggish responsiveness to known expected gains, could not fully explain the observed patterns31.
28It is worth noting that demand uctuations would not necessarily generate higher volatility of
FRS liability. If traders use a xed proportion of inputs to deliver their supplies, an increase in demand increases input use but does not change the share of value added and therefore does not change the relative merit of FRS and VAT.
29The evidence is silent on deeper reasons responsible for lack of knowledge: e.g. high cost
of acquiring information, biased beliefs about suitability of VAT, tendency to ignore non-default options, and lack of salience of VAT.
30Notice, learning could still be important even when there is no objective uncertainty. For
example, traders might not know the objective distribution of FRS gains. They would update their prior beliefs after a few observations and learn that FRS is optimal for them.
Before considering the evidence on type of frictions, it is useful to outline potential ways traders could learn about FRS. VAT traders could learn about FRS through a) HMRC, b) tax agents and consultants, and c) business partners and peers. Traders are engaged with HMRC during VAT registration, submission of returns, and audit visits. But chances of learning about FRS is highest at t