2017 International Conference on Mathematics, Modelling and Simulation Technologies and Applications (MMSTA 2017) ISBN: 978-1-60595-530-8
A Simulation Algorithm Based on Optimal Operation
Strategy for CCHP System
Zheng-Long ZHAO
1and Bin ZOU
1,2,*1School of Mechatronic Engineering and Automation, Shanghai University, Shanghai, China
2Shanghai Key Laboratory of Power Station Automation Technology, Shanghai China
*Corresponding author
Keywords: CCHP, Simulation, Optimal operation strategy, KT condition.
Abstract. The operation problem is modeled as nonlinear programming in which the relationship between generating and heating and the generating efficiency change with the power generating are considered as the constraints. The KKT condition of the optimal operation model are investigated for the typical operation strategy, and the condition that the typical operation strategy is optimal operation strategy are obtained. A CCHP simulation algorithm based on optimal operation strategy is presented in this paper. The numerical results demonstrated that the operation cost based the presented operation strategy reduces significantly comparison with the traditional operation strategy.
Introduction
The distributed energy system with 80% primary energy utilization and environmental benefits have be become one of the important means to solve the city's energy supply [1]. The most significant feature of the distributed energy system is the recovery of waste heat from power generation to supply heat energy for users around. There is a tight relationship between generating and heating in combined heating power system which is the key equipment in the distributed energy system, and the generating and heating efficiency change with the power generating [2].
The operation strategy of combined heating power system to meet the load profile is an important issue. The load profiles are not match the relationship between generating and heating of CHP system, so the operation strategy to dispatch the PGU and other equipment to meet the load demand will affect directly the primary energy ratio, economic and environmental benefits [3]. There are many researches on operation strategy of CHP system. Two famous operation strategy are following thermal load (FTL) and following electric load (FEL). Previous studies show that it is a good strategy that the CHP system operates under FEL when the thermal load is comparatively larger than the electric load, and under FTL when the electric load is larger [4][5]. The operation strategy is called Hybrid electric–thermal load (HET).
The operation strategy of combined cooling, heating, power system (CCHP) is more complex than CHP’s. The absorption chiller and electric chiller are used cooling, and the equivalent thermal electric profile change with the various chiller’s operation profile. Using the absorption chiller to supply the cooling, [6] show that the performance of CCHP in primary energy consumption, operation cost and environment is better than that of independent supplying system, [7] and [8] presented a new operation strategy dispatch the chillers, the results are better than HET, but do not know whether it is optimal.
The operation strategy of CCHP system is also included in many researches on optimal operation of distributed generations in micro-grids and the energy hub. The linear programming, nonlinear programming, dynamic programming, mixed integer linear programming and mixed nonlinear programming are used to model the operation problem of CCHP system [9][10].
operation strategy are obtained. A CCHP simulation algorithm based on optimal operation strategy is presented in this paper. The numerical results demonstrated that the operation cost based the presented operation strategy reduces significantly comparison with the traditional operation strategy.
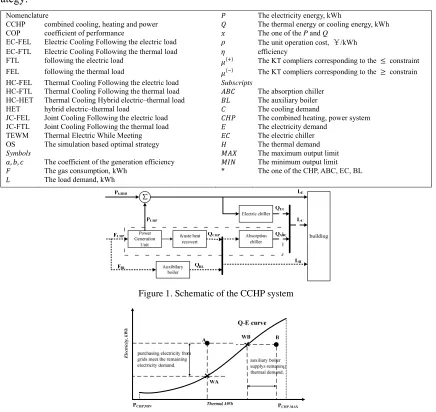
Nomenclature The electricity energy, kWh
CCHP combined cooling, heating and power The thermal energy or cooling energy, kWh COP coefficient of performance The one of the P and Q
EC-FEL Electric Cooling Following the electric load The unit operation cost, ¥/kWh EC-FTL Electric Cooling Following the thermal load efficiency
FTL following the electric load The KT compliers corresponding to the constraint FEL following the thermal load The KT compliers corresponding to the constrain HC-FEL Thermal Cooling Following the electric load Subscripts
HC-FTL Thermal Cooling Following the thermal load The absorption chiller HC-HET Thermal Cooling Hybrid electric–thermal load The auxiliary boiler HET hybrid electric–thermal load The cooling demand
JC-FEL Joint Cooling Following the electric load The combined heating, power system JC-FTL Joint Cooling Following the thermal load The electricity demand
TEWM Thermal Electric While Meeting The electric chiller OS The simulation based optimal strategy The thermal demand
Symbols The maximum output limit
[image:2.612.90.526.114.526.2], , The coefficient of the generation efficiency The minimum output limit The gas consumption, kWh * The one of the CHP, ABC, EC, BL The load demand, kWh
Figure 1. Schematic of the CCHP system
El
ect
ri
ci
ty,
kW
h
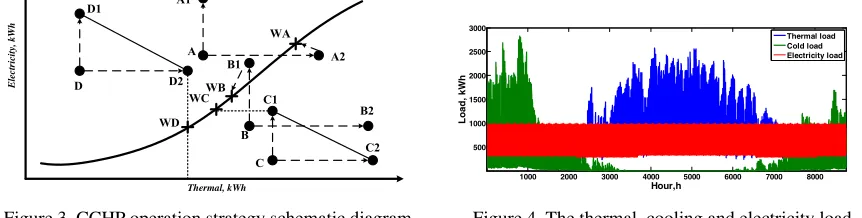
Figure 2. The Q-E curve of generating energy and recovered waste heat.
Operation Strategy of the Combined Heating Power System
A schematic of the CCHP system is shown in Fig.1. There are three energy bus in the system, names thermal bus, cooling bus and power bus. The energy demands of consumers are served in three ways: 1) power is provided by power generation unit (PGU) or/and power grids; 2) heat is provided by waste heat recover from PGU or/and auxiliary boiler; 3) cold is provided by electric chiller or/and absorption chiller.
It is important features that the thermal recover is dependent on the power generation by the PGU. The relationship between the production electricity energy by PGU and the thermal recover are represent by follow equation:
,
CHP CHP CHP E
P t F t (1.1)
1 ,
CHP CHP E CHP H
,
/
CHP CHP MAX
f P P (1.3)
2 ,
CHP E a b f c f
(1.4)
Based on the equation (1), the production electricity energy by PGU and the thermal energy from waste recover has a monodromy function that is shown in Fig.2 as Q-E curve. If the production electricity energy known, the thermal energy from the waste heat recover can be determined by the function, in turn which can also be found.
In the system, the load balance can be expressed as
/ 0
E CHP GRID EC EC
L t P t P t Q t COP (2.1)
/ 0
H ABC ABC CHP BL
L t Q t COP Q t Q t (2.2)
0
C ABC EC
L t Q t Q t (2.3)
The space in Fig.2 can be seen as load space, the Q-E curve of the generation and waste heat recover separates the space into two parts. The heat and electric load profiles in the left of the Q-E curve, known as the larger electric load, like as point A in Fig.2, the case can expressed as
E E
H CHP E
L L
L Q L (3)
The means that recovered heat when production electricity energy is , which follows the function determined by Q-E curve.
The case that the heat and electric load is in the right of the Q-E curve known as the larger thermal load, like as point B in Fig.2, that is,
E E
H CHP E
L L
L Q L (4)
In the larger electric load, the following thermal load strategy (FTL) known as good strategy. The load profile point A in Fig.2 that meet the inequality (3), the work point of CHP is WA in Fig.2 when the FTL strategy is used, the thermal energy recovered from waste heat by PGU generation meets the thermal demand, but the generation by PGU is less than the electric load. The insufficient demands are provided by purchasing from generation grids.
In the larger thermal load, the following electric load (FEL) strategy is considered to be a good choose. The load profile B point in Fig.2 meet the inequality (4), the work point is WB according to the FEL strategy, the electricity generated by PGU is equal to the electric load, and the recovered waste heat from the PGU is not enough to meet the thermal load, additional heat must be provided by the auxiliary boiler.
The optimal operation model can be expressed as
minCHPFCHP t BLFBL t GRIDPGRID t (5.1)
s.t.
,
CHP CHP CHP E
P t F t (5.2)
1 ,
CHP CHP E CHP H
Q t F t (5.3)
,
/
CHP CHP MAX
f P P (5.4)
2 ,
CHP E a b f c f
(5.5)
0
E CHP GRID
0
H CHP BL
L t Q t Q t (5.7)
BL BL BL
Q t F t (5.8)
, ,
CHP MIN CHP CHP MAX
P P t P (5.9)
, ,
BL MIN BL BL MAX
Q Q t Q (5.10)
, ,
GRID MIN GRID GRID MAX
P P t P (5.11)
Where:
The objective function of the model (5) is operation cost (5.1) .The decision variable are the generation energy by PGU, the buying electricity energy from power grids, and the thermal energy produced by auxiliary boiler. The constraints include combined heating power production (5.2)-(5.5), load balancing (5.6)-(5.7), auxiliary boiler production (5.8) and the maximum and minimum limit on output of each device's (5.9)-(5.11). Without loss of generality, assume all minimum limit is zero.
The Lagrange function of the model (5) is
,
, , , , ,
CHP CHP BL BL GRID GRID E E CHP GRID H H CHP BL CHP CHP CHP MAX
CHP CHP MIN CHP BL BL BL MAX BL BL MIN BL GRID GRID GRID MAX GRID GRID MIN GRID
= F t F t P t L t P t P t L t Q t Q t P t P
P P t Q t Q Q Q t P t P P P t
L
(6)
The optimal solution of the model (5) must meet the KKT condition. The KKT condition of the model (5) include three part. The one is the derivative of the Lagrange function equal to zero, that is,
0
CHP CHP
CHP E H CHP CHP
CHP CHP CHP
F t Q t
=
P P P
L (7.1)
1
0
BL H BL BL
BL BL
=
Q
L (7.2)
GRID E GRID GRID 0 GRID
=
P t
L (7.3)
The detailed expression of the ⁄ and ⁄ see appendix.
The second part of the KKT condition are the constraints of model (5). The third part is KKT multipliers of the inequality constraint greater than or equal to zero and the complementary slackness, that is,
*
* 0
, * xxmax0 , * xminx0 (8)
If the operation strategy is optimal, the KKT condition mast be meet by the results of the operation strategy. According to the load profile and operation strategy, the constraint and complementary slackness, the KKT multipliers can be determined, then the solvability condition of equation (7) is investigated.
Assume the heat and electric load profile meet the inequality (3), and the FTL strategy is used, then the recovered waste heat meet the thermal demand, the electric load is meet by PGU generation and purchasing power grid. It means that the output of PGU, purchasing electricity is between their maximum and minimum limit, the output of the auxiliary boiler is equal to the minimum output, is zero. Based on formula (8), the KKT multipliers of the constraint (5.9)-(5.11)
are 0 and 0. Substituting these KKT multiplier
CHP CHP GRID CHP BL H CHP BL CHP F t P Q t P (9)
If thermal and electric load profile meet the inequality (3) and the condition (9) is meet, then the FTL is optimal strategy. Form the (9), the optimality of FTL strategy associated with the efficiency of combined heat power system and auxiliary boiler, the electricity price. In normal case, the inequality is true.
Other strategy in electric load lager always is not the optimal strategy. When the work point of combined heat power system is over WA, the load balance is not meet, so the KKT condition is not meet. And when the work point is at the bottom of the point WA, the generation electricity by PGU and the recovered heat all are not meet the load, purchasing electricity and auxiliary boil should be
run at same time. It means the KT multiplier are 0,
substituting these KKT multiplier into equation (7), the (7) is not meet. In the larger electric load, the FTL is the optimal operation strategy.
Assume the heat and electric load profile meet the inequality (4), and the FEL strategy is used, the electric load is meet by the generating electricity by PGU, the thermal load is meet by recovered waste heat and product thermal by auxiliary boil. The output of the combined heat power system and the auxiliary boiler is between the maximum and minimum, the purchasing electricity is equal to zero. The KT multipliers of the constraint (5.3)-(5.4) are
0 and 0. By (7) can know ⁄ , there are
CHP BL CHP
E CHP GRID
CHP BL CHP
F t Q t
P P
(10)
When the inequality (10) is true, the results of the FTL operation strategy meet the KKT condition. In normal price and the efficiency of the combined heat power system, the inequality (10) is true.
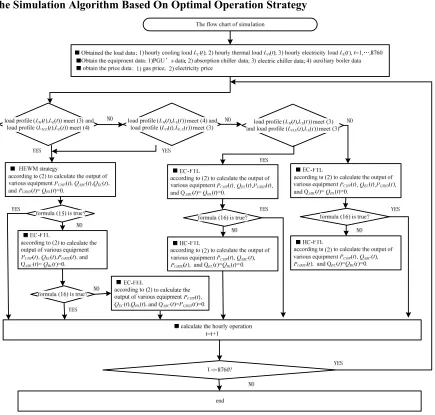
[image:5.612.91.522.435.544.2]Thermal, kWh El ec tr ic it y, k W h A B C D A1 A2 B1 B2 WB WA WC WD D1 D2 C1 C2
Figure 3. CCHP operation strategy schematic diagram. Figure 4. The thermal, cooling and electricity load.
Follow the same logic, it can be proved that the other operation strategy in lager thermal load are not an optimal.
The Operation Strategy of the Combined Cooling Heating Power System The Typical Operation Strategy
When the cold demand is considered, the operation strategy is more complicated than only thermal and electric demand. In the section, nine typical strategy are summed up as alternative strategies for optimal operation strategy. The cold, thermal and electric demand profile are divided into four region. For the convenience of description, let us define the equivalence thermal load and the equivalence electric load.
, = /
E E E EC EC
L t L t Q t COP (11.1)
, /
H E H ABC ABC
L t L t Q t COP (11.2)
According to the load profile and the equivalence load profile, four states are defined that covers all load space.
State 1. When the thermal and electric demand meet the inequality (3) and the equivalence
thermal load and electric load meet the inequality (4) while the cold demand is all supplied by absorption chiller.
State 1 can be explained as shown in Fig.3, the point A in which the thermal and electric load profile meet the inequality (3), and the point A2 is the equivalence load profile that the cold demand is all met by absorption chiller, and the equivalence thermal load and electric load meet the inequality (4). The key feature is that the load profile and the equivalence load profile are located at left and right side of the Q-E curve respectively. While the cold demand is all met by electric chiller, the equivalence load is shown in point A1.The points on the line connecting point A1 and point A2 represent the equivalent load while the absorption chiller and electric chiller work at same time to supply the cooling.
In state 1, there are three typical operation strategies. The first is called EC-FTL (Electric Cooling Following the thermal load, EC-FTL), while the cold demand is all met by electric chiller. The equivalence load profile located in point A1, then the thermal load is supplied by recovered waste heat, and the equivalence load is supplied by PGU and purchasing electricity from grids. The second typical operation strategies is called HC-FEL (Thermal Cooling Following the electric load, HC-FEL), while the cooling demand is all met by absorption chiller. The equivalence load profile located in point A2, the electric load is met by PGU, and the equivalence thermal load is supplied by the recovered waste heat and the auxiliary boiler.
The third typical operation strategy is called TEWM (Thermal Electric While Meeting, TEWM). The absorption chiller and electric chiller are run at same time to supply the cold demand in the operation strategy, and the equivalence load located in point WA that is the intersection of the Q-E curve and segment A1-A2. Although any point on segment A1-A2 corresponds to an operation strategy, the point WA is the most likely optimal strategy, because of the cooling heating and electricity load are all supplied by CCHP system.
State 2. When the thermal and electric demand meet the condition (4) and the equivalence
electric load and thermal load meet the inequality (3) while the cold demand is all met by electric chiller.
For example, the thermal and electric demand profile located at point B in Fig.3, the equivalent load profile located at point B1 while electric chiller supplies the cold demand, and the point B1 and point B are located at above and below the Q-E curve.
In state 2, the typical operation in state 2 is same in state 1.
State 3. When the thermal and electric demand meet the inequality (3) and the equivalence
thermal load and electric load also meet the inequality (3) while the cold demand is all met by absorption chiller.
All the equivalence load used various operation strategy in State 3 satisfy the inequality (3), it means that the typical operation strategy for the equivalence load is always FTL. There are three typical way to produce the equivalence load. The first typical way is that electric chiller supplies the cold demand, the second typical way is that absorption chiller met the cold demand, and the third is that two type chiller work at same time to supply the cold demand. So the typical operation strategies in state 3 are the Electric Cooling Following the thermal load (EC-FTL), Thermal Cooling Following the thermal load, HC-FTL and Joint Cooling Following the thermal load (JC-FTL).
The point D in Fig.3 represent the load profile, and point D1 represents the equivalence load profile while electric chiller meet the cold demand, point D2 presents the equivalence load profile while absorption chiller meet the cold demand. The points on the segment D1-D2 represent that the absorption chiller and the electric chiller supply the cooling at same time.
State 4. When the thermal and electric demand meet the inequality (4) and the equivalence
A load profile which is stat 4 is shown in Fig.3 as point D. when the cold demand is all met by electric chiller, the point D1 represents the equivalence load profile, while point D2 represents the equivalence load profile that the absorption chiller supply the cold demand. The segment D1-D2 represent the equivalence load profile that the two type chiller work at same time to supply the cooling.
The equivalence load profiles meet the inequality (4), so the operation strategy for the equivalence load is FEL.
There are three typical operation strategies in state 4, that is, the Electric Cooling Following the electric load (EC-FEL), Thermal Cooling Following the electric load, HC-FEL and Joint Cooling Following the electric load (JC-FEL).
The Optimal Operation Model of CCHP
Considering the cooling demand, the optimal operation model (5) are modified as Load balance
(5.5) (5.6) is changed to the following formula ⁄
0 , ⁄ 0 , 0 . In
addition, the upper and lower limits of the refrigerator must be added as ,
, , , , QEC MIN, QEC t QEC MAX, .
The decision variable add the producing cooling by absorption chiller and producing cooling by electric chiller in the modified model. The Lagrange function of the modified model is , , , , / /
CHP CHP BL BL GRID GRID E E CHP GRID EC EC C C ABC EC
H H CHP BL ABC ABC CHP CHP CHP MAX CHP CHP MIN CHP EC EC EC MAX
EC EC MIN EC ABC ABC AB
= F t F t P t L t P t P t Q t COP L t Q t Q t
L t Q t Q t Q t COP P t P P P t Q t Q
Q Q t Q t Q
L , , , , , ,
C MAX ABC ABC MIN ABC BL BL BL MAX BL BL MIN BL
GRID GRID GRID MAX GRID GRID MIN GRID
Q Q t Q t Q Q Q t
P t P P P t
(13)
The KKT condition add two new equation in addition to equation (7), that is,
C H 1 ABC ABC 0
ABC ABC
=
Q t COP
L (14.1)
E 1 C EC EC 0
EC EC
=
Q t COP
L (14.2)
The Optimal Condition of the Operation Strategy A. the optimal strategy in state 1 and state 2
Using TEWM strategy in state 1, the PGU, absorption chiller and electric chiller work between their maximum and minimum limit, and the auxiliary boil’s output and the purchasing electricity are aero that is their minimum limit. So the KKT multipliers are
0; 0; 0. Substituting these KKT multiplier into equation (7) and (14), when inequality (15) is true, the operation strategy is optimal strategy because the KT condition is true.
= CHP CHP CHP H CHP EC CHP ABC F t P
Q t COP
P COP
, BL H
BL
, ABC
H GRID
EC
COP COP
(15)
The result of the EC-FTL strategy is that the PGU, electric chiller run between their maximum and minimum limit, the purchasing electricity from grids is also between the maximum and minimum, the absorption chiller and auxiliary boil are not work, their output is their minimum value. The KKT multipliers are
CHP
CHP GRID
CHP H
CHP CHP
F t P t
Q t P t
, ABC BL
GRID H
EC BL
COP COP
(16)
Comparing (16) and (15), when the EC-FTL is optimal strategy, the TEWM is not, Vice versa vice versa.
The result of EC-FEL can be investigated using KKT condition, the condition that EC-FEL is optimal strategy is
CHP BL CHP
E CHP
CHP BL CHP
F t Q t
P P
,
BL EC
E GRID
BL ABC
COP COP
(17)
The is larger than , the inequality (17) is not true in general. In state 1, the optimal strategy may be WETM or EC-FTL according to the condition are (15) (16).
The strategy in state 2 is same as that in state 1, the conclusion are also same as that in state 1.
B. the optimal strategy in state 3
When the HC-FTL strategy is used in state 3, the PGU, the absorption chiller, and the purchasing electricity will between their maximum and minimum, and the producing energy of the electric chiller and the auxiliary boil are zero. The KKT multipliers are
0; 0; 0. Substituting these KKT multiplier into equation (7) and (14), when is calculated according to (16), and following inequality (18) is true, the operation strategy is optimal.
,
BL ABC
H H GRID
BL EC
COP COP
(18)
The EC-FTL is an optimal strategy when the inequality (16) is true. Compare (16) with (18), if the EC-FTL is the optimal strategy, then the HC-FTL is not, and vice versa vice versa.
JC-FTL is not able to be an optimal strategy. The result of JC-FTL are that the both chiller is work between their minimum and maximum output, and so are the PGU and the purchasing electricity. The auxiliary boil’s output is zero in its minimum value. The multipliers are
0, 0 . Substituting these KKT multiplier into equation (7) and (14), the KKT condition (7) and (14) is not true, the JC-FTL is not optimal strategy.In state 3, the optimal strategy is the one of the EC-FTL and FC-FTL according to the condition (16) and (18).
C. the optimal strategy in state 4
In the HC-FEL, the purchasing electricity and absorption chiller's output are zero in their minimum value, and the output of PGU, electric chiller and the auxiliary boil are between the maximum and minimum. According to the complementary slackness (9), The KKT multipliers are
0; 0; 0 .
Substituting these KKT multiplier into equation (7) and (14), the condition that HC-FEL is optimal strategy is that the is calculated according to (17), and following inequality (19) is true.
,
BL ABC
H H GRID
BL EC
COP COP
(19)
The optimal condition of the EC-FEL strategy’s in state 4 is same as in state 3, that is, (17) need be true.
The Simulation Algorithm Based On Optimal Operation Strategy
Figure 5. The flow chart of simulation.
Based on the optimal strategy condition discussed in section 3, a chronological simulation algorithm is presented in the section.
The chronological simulation includes three main procedures:
1) According to hourly cold, heating and electricity load, determine that the load profile belongs to which state in state 1- state4;
2) Calculate the output of various equipment based on the load balance (2) and the operation strategy. According to the optimal strategy condition, choice the operation strategy.
3) Based on gas consumption of PGU and auxiliary boiler, purchasing electricity energy, and the price, calculate the operation.
The flow chart of the simulation is shown in Fig.5.
Case study
This section presents the calculation results based the actual data. The Nominal capacity of PGU, Absorption chiller, Electric chiller and Auxiliary boil are respectively 900MW, 3000MW,3000MW, and 1000MW. The parameters of generating efficiency are a=-0.2,b=0.4,c=0.1. The recovered waste heat efficiency is , 0.8, The coefficient of performance of the absorption chiller and electric chiller are respectively 0.75, 3, the auxiliary boil’s efficiency is
The electricity price and gas price are shown in table 1 that come from the Shanghai development and Reform Commission Web site [12].
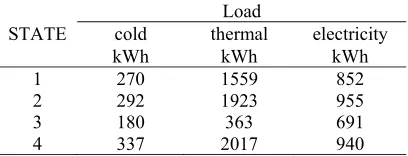
The hourly cooling, thermal and electricity load of a hospital in Shanghai is shown in Fig.4, Four load profiles in these hours are selected as the typical load profiles which fall within the state 1 to 4 respectively, while the electricity price is electricity price on peak and natural gas is the normal price. The typical four cooling, thermal and electricity load are shown in table 2.
The results based on various operation are shown in table 3. The first column in table 3 is the state that means the load profiles in table 2, and the 2nd column gives the operation strategies, column 3rd to column 8th gives the output of the devices, the last column is the cost corresponding operation strategies. According to the optimal condition, the optimal operation strategy is TEWM in state 1 and 2 while the electricity price is electricity price on peak and the normal price of natural gas, the cost in state 1 and 2 are the lowest. Similarly, the optimal strategy in state 3 and state 4 is HC-FTL and EC-FEL respectively, their cost are the lowest in optional operation strategies.
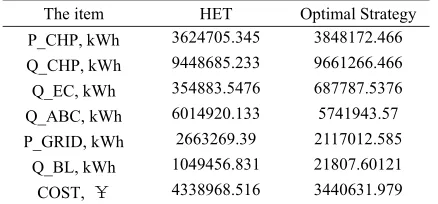
The annual production energy to meet the annual load based on the presented simulation algorithm are shown in table 4.
[image:10.612.171.438.339.416.2]A simulation algorithm based on traditional strategy is used as the comparison of the presented method. In the comparison operation strategy, all clod demand is met by absorption chiller, and then the FTL strategy is used if the equivalent load meet inequality (3) or the FEL strategy is used if the equality (4) is met by the equivalent load. The operation strategy is HET.
Table 1. The price data.
Item value
low heat values of natural gas, LHV, kWh/m3 9.86
normal price of natural gas, , ¥/m3 3.99
favorable price of natural gas, , ¥/m3 2.43
electricity price on peak, , ¥/kWh 1.032
[image:10.612.205.409.448.526.2]electricity price on peak off , ¥/kWh 0.474
Table 2. The typical load profiles of the four state.
STATE
Load
cold thermal electricity
kWh kWh kWh
1 270 1559 852
2 292 1923 955
3 180 363 691
4 337 2017 940
Table 3. The results of the various operation strategies.
state strategy PCHP QCHP QEC QABC PGRID QAB cost
kWh kWh kWh kWh kWh kWh ¥
1 TEWM EC-FTL 1006 801 1925 1665 142 337 195 0 253 0 0 0 407 586
HC-FEL 970 1876 0 337 0 239 489
2 TEWM EC-FTL 1023 1004 1950 1923 272 292 20 0 24 0 0 0 414 431
HC-FEL 955 1856 0 292 0 456 571
3 HC-FTL EC-FTL 121 62 603 363 180 0 180 0 570 674 0 0 637 720
JC-FTL 89 483 90 90 624 0 680
4 EC-FEL HC-FEL 1024 940 1951 1836 337 0 337 0 0 0 630 65 441 635
JC-FEL 982 1892 169 169 0 349 539
[image:10.612.99.517.556.694.2]than the auxiliary boiler, and the electricity cost is less than the electricity price, the cost based optimal strategy is less than the cost based on the HET. In fact, the TEWM is employed 2298 hours that is one-fourth total hour number, the cost based optimal strategy reduce 20% compared to the HET.
Table 4. The results of the Optimal strategy simulation and the HET operation strategy.
The item HET Optimal Strategy
P_CHP, kWh 3624705.345 3848172.466
Q_CHP, kWh 9448685.233 9661266.466
Q_EC, kWh 354883.5476 687787.5376
Q_ABC, kWh 6014920.133 5741943.57
P_GRID, kWh 2663269.39 2117012.585
Q_BL, kWh 1049456.831 21807.60121
COST, ¥ 4338968.516 3440631.979
Conclusion
The solution of the optimal operation model for CCHP system are different from the traditional operation strategy, the operation simulation algorithm need to be improved to reflect the characteristics of the optimal operation for estimating the performance of CCHP system. This paper investigated the typical operation strategy and their optimal condition based on KKT condition, and presents a simulation algorithm according to the optimal operation strategy. The research obtained following conclusion:
1) The optimal operation strategy change with the extrinsic price, like as electricity price and gas price, and intrinsical equipment efficiency, like as COP of electric chiller and absorption chiller.
2) The optimal condition of operation strategy presented in the paper can be used as selecting operation strategy in simulation. The simulation algorithm given a realistic estimation of CCHP system that operation based optimal operation model.
Reference
[1] Wang J.-J., Jing Y.-Y., Zhang C.-F., Zhai Z.J. Performance comparison of combined cooling heating and power system in diffident operation models, Appled Energy, 2011, 88(12): 4021-4631. [2] Pnghui Gao, Yanjun Dai, YenWah Tong, Pengwei Dong. Energy matching and optimization analysis of waste to energy CCHP system with exergy and energy level. Energy 2015, 79: 522-535. [3] Mago P., Chamra L. Analysis and optimization of CCHP systems based on energy, economical, and envioronmental considerations. Energy and Building, 2009, 41(10):1099-1106.
[4] Alan Moran, Redro J. Mago and Louay M. Comra. Thermo economic modeling of micro-CHPfor small commercial applications. Int. J. Energy Res., 2008, 32: 808-823
[5] R/J. Mago, N. Fumo, L.M. Chamra. Perforance analysis of CCHP systems operationting following the thermal and electric load. Int. J. Energy Res., 2009, 33: 852-864.
[6] Mingxi Liu, Yang Shi, Fang Fang. A new operation strategy for CCHP systems with hybrid chillers, Applied Energy, 2012, 95: 164-173.
[7] Wang J.J., Sui J., Jin H.G. An improved operation strategy of combined cooling heating and power system following electrical load. Energy, 2015, 85: 654. 666.
[8] Fang F, Wang Q H, Shi Y. A novel optimal operational strategy for the CCHP system based on two operating modes. IEEE Transactions on Power Systems, 2012, 27(2): 1032. 1041.
[10] Zhanbo Xu, Xiaohong Guan, Qing-shan Jia, Jiang Wu, Dai Wang, Siyuaaaaaaaan Chen. Performance analysis and comparison on energy storage devices for smart building energy management. IEEE Tans. on Smart Grid, 2012, 3(4): 2136-2147.
[11] Sashirekha A., Pasupuleti J., Moin N.H., Tan C. Combined heat and power (CHP) economic dispatch solved using Lagrangian relaxation with surrogate subgradient multiplier updates. Electr Power Energy Syst 2013, 44:421-30.
[12] http://www.shdrc.gov.cn/main?main_colid=319&top_id=312&main_artid=19986.
Appendix
According to (1.1)
2 ,
, ,
1 1 CHP E
CHP
CHP
CHP CHP E CHP E CHP
F t
P t
P t P
(A.1) According to (1.3),(1.4)
,
, ,
1 2 1
CHP E
CHP CHP MAX CHP MAX
b c f
P P P
(A.2)
Substituting (A.2) into (A.1)
2
2
, ,
1 1
2
CHP
CHP CHP E CHP E
F t
b f c f
P t
(A.3)
According to (1.2)
,, 1 , CHP H
CHP CHP
CHP H CHP E CHP
CHP CHP CHP
Q t F t
F t
P P P
Substituting into(A.2), (A.3)
, 2
, 2
, ,
1 1
2
CHP E CHP
CHP H
CHP CHP E CHP E
Q t
b f c f P