Modelling water vapour permeability through atomic layer deposition
coated photovoltaic barrier defects
Mohamed Elrawemi
a,⁎
, Liam Blunt
a, Leigh Fleming
a, David Bird
b, David Robbins
b, Francis Sweeney
a aEPSRC Centre for Innovative Manufacturing in Advanced Metrology, School of Computing and Engineering, University of Huddersfield, Huddersfield, UKbCentre for Process Innovation Limited, Sedgefield, County Durham, UK
a b s t r a c t
a r t i c l e i n f o
Article history:
Received 11 March 2014
Received in revised form 26 August 2014 Accepted 29 August 2014
Available online 16 September 2014
Keywords:
Defects Permeation Surface topography Thinfilms
Water vapour transmission rate
Transparent barrierfilms such as Al2O3used for prevention of oxygen and/or water vapour permeation are the subject of increasing research interest when used for the encapsulation offlexible photovoltaic modules. Howev-er, the existence of micro-scale defects in the barrier surface topography has been shown to have the potential to facilitate water vapour ingress, thereby reducing cell efficiency and causing internal electrical shorts. Previous work has shown that small defects (≤3μm lateral dimension) were less significant in determining water vapour ingress. In contrast, larger defects (≥3μm lateral dimension) seem to be more detrimental to the barrier func-tionality. Experimental results based on surface topography segmentation analysis and a model presented in this paper will be used to test the hypothesis that the major contributing defects to water vapour transmission rate are small numbers of large defects. The model highlighted in this study has the potential to be used for gaining a better understanding of photovoltaic module efficiency and performance.
© 2014 The Authors. Published by Elsevier B.V. This is an open access article under the CC BY-NC-ND license (http://creativecommons.org/licenses/by-nc-nd/3.0/).
1. Introduction
In today's industry, the most common type of solar photovoltaic (PV) cell is fabricated from either rigid crystalline silicon or thin-film mate-rials[1]. The rigid construction of Si solar cells hampers their economic integration into residential and commercial buildings; however, thin film solar cell technologies may prove to be most appropriate with re-spect to cost, ease of manufacture and installation. These thinfilm cells are based on the material CuIn1−xGaxSe2(CIGS) as the absorber layer (p-type) and they at present have efficiency levels at or beyond that of Si based rigid solar modules[2]. The key weakness of these cells however is their moisture sensitivity. This is a critical problem if this technology is expected to meet the requirements of international standard IEC61646[3]which requires that all PV modules survive 1000 h in an environment of 85 °C and 85% relative humidity (RH)[3]. At the present time, no cost effective,flexible transparent encapsula-tion can fulfil the requirements of the water vapour transmission rate (WVTR) forflexible PV modules[4]. The WVTR of current bar-riers is in the range of 10−1g/m2/day, while it should not be higher than 10−4g/m2/day to assure life-times of 20 years and more[4,5].
Therefore, a robust, transparentflexible encapsulation method for flexible PV modules is needed.
Thin layers of aluminium-oxide (Al2O3) of the order of a few tens of nanometres deposited via the atomic layer deposition (ALD) technique have been introduced to allow PV module transparency andflexibility and to provide an effective barrier layer. These barrierfilms ideally have WVTR of less than 10−4g/m2/day[6]. The term‘barrier’here refers to the ability of Al2O3to resist the diffusion of water vapour into and through itself. Nevertheless, the barrier properties are often influenced by a wide range of variables, making conclusions regardingfilm proper-ties sometimes difficult. It is known that barrierfilm permeability can be affected by the chemical and physical structures of the barrier, concen-tration of the permeant, temperature and humidity[7,8]as well as sur-face defects on the barrier coating that may be induced during the deposition processes[9,10]. Da Silva Sobrinho et al.[11]stated that the source of defect-driven permeation has been primarily attributed to pin-hole defects[12,13]though more recent studies have shown that in the absence of pinhole defects permeation rates are still reduced by three or-ders of magnitude over the substrate material[14]. The remaining per-meation is shown to be the result of defects in the sub-micromere to several micrometre range, produced by the surface microstructure[15]
and/or low density of thefilms[14–16]. More detailed reviews of perme-ation mechanisms and the performance of various permeperme-ation barriers have been given elsewhere[12,17]. In this paper a theoretical model is presented to allow the prediction of the amount of water vapour perme-ation through PV barrierfilm defects. The results of the model are then ⁎ Corresponding author at: EPSRC Centre for Innovative Manufacturing in Advanced
Metrology, School of Computing and Engineering, University of Huddersfield, Huddersfield, HD1 3DH, UK.
E-mail addresses:Mohamed.elrawemi@hud.ac.uk,elrawemi@yahoo.com (M. Elrawemi),David.Bird@uk-cpi.com(D. Bird).
http://dx.doi.org/10.1016/j.tsf.2014.08.042
0040-6090/© 2014 The Authors. Published by Elsevier B.V. This is an open access article under the CC BY-NC-ND license (http://creativecommons.org/licenses/by-nc-nd/3.0/).
Contents lists available atScienceDirect
Thin Solid Films
compared to experimental results where defects measured using surface metrology techniques are correlated with WVTR.
2. Theoretical model
Ashely[18]developed an equation to calculate the permeability co-efficient of the water vapour through a polymer barrierfilm. The equa-tion was based on Henry's law of solubility[19], Fick's laws of diffusion
[20], Stefan and Exner'sfindings[21]and Von Wroblewski hypothe-sis[22]. Ashely[23] indicated that the permeability coefficientPr
depends on the solubility coefficient, S, as well as the diffusion coeffi -cient, D. Eq.(1)expresses the permeability in terms of solubility and dif-fusivity, D, and it can be defined as the volume of vapour passing through a unit area of the barrier layer per unit time, with a unit pres-sure difference across the sample[23].
Pr¼
quantity of permeant
ð Þ ðfilm thicknessÞ
area
ð Þ ðtimeÞ ðpressure drop across the filmÞ
Pr¼DS¼
qL AtΔP
cm3cm cm2sPa
!
ð1Þ
where q is the amount of permeant passing through afilm of thickness L and over area A during time t driven by a partial pressure differentialΔp across thefilm[24]. In a typical water vapour permeation measurement, for example, a“MOCON”test,ΔP in Eq.(1)corresponds to the partial pressure difference between nitrogen containing water vapour at 90% RH on one side, and ultra-pure nitrogen on the other side. In this type of permeation test there is no pressure gradient across the sample so it is then reasonable to use the absolute value of the permeant's partial pressure P, instead ofΔP[11]Thus, Eq.(2)can be presented as the fol-lowing;
Pr¼DS¼
qL AtP
cm3cm cm2sPa
!
: ð2Þ
Da Silva Sobrinho et al.[11]developed an equation to determine the amount of permeant per unit of time (Q) through the polymer; this equation was based on Henry's law of solubility[19]. This equation is mathematically expressed as;
Q¼qt¼ADSPL ¼ADL∅ ð3Þ
where the validity of Henry's law is assumed, and Ø represents the water vapour concentration in thefilm surface and it has been estimat-ed to be 1 g/cm3[11]. For the case of water vapour which has a little[25]
or even no interaction with the barrierfilm[11,26], the water vapour transmission is completely governed by defect geometries and densities
[11]. In the present paper a model of water vapour permeation through the barrier defects is presented to study the effect of the defects on water vapour permeation.
2.1. Single defect case
The basic assumption is that the combinedfilm of thickness L is made up of a transparentflexible barrier coating of (Al2O3) with a single circular hole (defect) of radius (R0), and that it is exposed to permeant water vapour from the lower side as shown inFig. 1.
Considering only steady-state permeation, where temperature and partial pressure of the water vapour are constant, and the total pressure is the same on both sides of the barrier layer. The next step is to deter-mine the amount of the water vapour qH, leaving the barrierfilm, see
Fig. 1. In steady state, this amount is clearly determined by the water passing through the defect in the barrier. However, in the case of the
hole in the barrierfilm as shown inFig. 1, the amount of permeant tra-versing the polymer and through the hole per unit time can be provided by modifying Eq.(3)and introducing the barrierfilm as having a circular “hole”area (πR02).
Q¼qH
t ¼
πR20D∅
L ð4Þ
where R0is the hole radius, D is the diffusion coefficient of the barrier film (cm2/s),∅is the water vapour concentration (g/cm3) and L is the combinedfilm thickness. However, to determine the rate of the water vapour that penetrates hole over the substrate area (g/m2/day), Eq.(4)can be expressed as the following[24];
WVTR¼QA g=m2=day ð5Þ
where Q is the amount of the water vapour passing through afilm of thickness L and area A during time t driven by a partial pressure differ-ential P across thefilm[23].
2.2. Case of many defects
Independent holes assume that the presence of one does not affect water vapour permeation through the other, so that their respective quantities of water vapour permeation are additive[27]. So far, a theo-retical model to determine the amount of the water vapour per unit of time, traversing a single hole in a barrier coating has been assumed and in order to discuss water vapour permeation through a barrier coat-ing containcoat-ing numerous defects (holes), Eq.(5)can be modified for (N) holes as follows:
WVTR¼X
N
0
Q
A N ð6Þ
N, is the number of defects (holes) in the sample area.
3. Experimental details
[image:2.595.311.544.54.235.2]The experimental study was based on a set of two 80 mm diameter samples. These two samples were supplied by the Centre for Process In-novation (CPI), and were coded as 2705 and 2706. These two samples are coated with 40 nm of Al2O3using ALD technique[28]. The ALD de-positions were made using Oxford Instruments FlexAL tool, where trimethyl aluminium was used as the metal precursor[29]. The reactor temperature used to deposit the aluminium oxide was 120 °C and the
pressure was very low (b0.1 mbar). 312 reaction cycles were induced to produce 40 nm Al2O3layers on a polyethylene naphthalate (PEN) substrate.
The Al2O3transparent ceramic material has an effective WVTR of less than 5 × 10⁻⁶g/m2/day[1]. The basefilm substrate used in this study was PEN material; where the thickness of this substrate is specified to be 125μm. According to the manufacturer's data, this material has a water vapour diffusion coefficient of 4 × 10⁻¹²cm2/s at 38 °C, and WVTR of 4 g/m2/day at 38 °C and 90% RH. Prior to the surface measurements, the Al2O3ALD samples were measured for WVTR using isostatic standard test (Aquatran1-MOCON®) instrumentation[30]at 38 °C and 90% RH. The lower detection limit of the instrument is 4 × 10⁻⁴g/m2/day, and the uncertainty of the measurements is 2 × 10⁻⁴g/m2/day for the calibra-tion offset and 2 × 10⁻⁴g/m2/day for the actual measurement, giving a total of 4 × 10⁻⁴g/m2/day.
The water vapour permeation test results show that sample coded 2705 had a WVTR of 4.1 × 10⁻³g/m2/day and sample 2706 had a WVTR of 2.0 × 10⁻³g/m2/day (the WVTR for sample 2705 is twice as high as the WVTR for sample 2706). The WVTR results were obtained after a stabilisation time of 5 days.
4. Surface topography analysis
4.1. Surface topography analysis and result discussion
Surface metrology and characterisation technologies used in the present study include white light scanning interferometry (WLSI) and environmental scanning electron microscopy (ESEM) and both were applied to analyse the PV barrierfilm defects. It should be noted that the WLSI technique employed, imposed a lateral resolution limit on the surface measurement of ~0.88μm. In the study quantitative surface measurement was carried out using optical interferometry and the topography was characterised using areal parameters[31]. The propor-tion of the surface area characterised was 14% of the total area of each sample equating to 703 mm2; this comprised 700 measurements per sample. Initially, standard statisticalfield parameters[32,33]in particu-lar the root mean square surface roughness deviation (Sq)[33]were cal-culated for the overall 3D surface data (defective and non-defective) in an attempt to investigate any correlations between the surface topogra-phy measurement and the WVTR. This amplitude parameter can give information regarding the areal height deviation of the surface topogra-phy for each sample, and it is defined as the root mean square value of the surface departures z(x, y), within a sampling area[33], and is given by the following equation:
Sq¼
ffiffiffiffiffiffiffiffiffiffiffiffiffiffiffiffiffiffiffiffiffiffi 1
MN∑
N
j¼1∑ M
i¼1 s
η2
xi;yj
ð7Þ
where M is a number of points per profile, N is the number of profiles andη(xi,yj) is the residual surface obtained by subtracting the reference
plane from the original surface.
Applying this method to the recorded 3D surface data, the results in
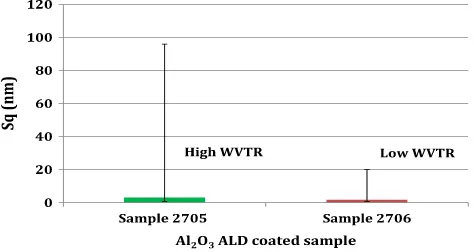
Fig. 2which represent the mean value of the surface roughness for the samples showed no real differences or correlations between the studied samples other than a greater spread of root mean square roughness values for sample 2705 (high WVTR) as represented by error bars. This result seems to strongly agree with previous published work[15], where the authors observed that no correlation exists when the surface roughness is measured over large scanned areas owing to the inhomo-geneous coating morphology[15].
The results shown inFig. 2show no clear correlation between the mean Sqvalue taken over the measured area of the samples and the WVTR. It can be seen that the mean Sqvalues are similar for both samples, while the WVTR is substantially different. Following this initial analysis only datafiles with defects (peaks and holes) were selected for further
investigation in an attempt to investigate such correlation between defect size, density, distribution and morphology.Fig. 3shows the number of datafiles with defects present on the surfaces, where each datafile repre-sents 1 mm2of the total measured area of 703 mm2.
The results inFig. 3indicate that sample 2706 has higher defect den-sity than sample 2705. However, the question remains here why does sample 2706 still show lower WVTR although it has a higher defect density?
At this point, segmentation analysis[31]was carried out on the sur-face topography data (areas with defects present) of the samples in
Fig. 3in order to try to extract and quantify only the significant defects present on the substrate. In the present work it is postulated that only geometrically significant defects are directly responsible for the high WVTR. This method of analysis (segmentation) allows the extraction of information pertaining to specific“significant”topographical features from the topography data using a series of mathematical and thresholding techniques[31,32]. In the present case a significance value of ± 3 Sqvertical height [where, Sqfor non-defective sample area = 0.8 nm, see Fig. (4a)] and 15μm (based on SEM analysis) lateral size was applied to compare the presence of significant defects on both samples.
Wolf pruning and area pruning [31,34] are implemented for extracting the features of functional interest by accurately excluding in-significant geometrical features, such as measurement noise and error and small topographical features. As a starting point, this method was ap-plied to count only defects where the scale is greater than the background surface roughness variation over the total measured area. In the present case defects are assumed to manifest themselves as both negative topo-graphical features (holes) and positive features (particulates) as shown inFig. 5, where the particulates are considered as a defect. Zhang et al.
[image:3.595.318.555.55.181.2][9]stated that particulates may be dislodged post coating or provide shadowing thus resulting in areas of uncoated substrate.
Fig. 2.The calculated mean surface roughness (Sq) over 700 measurements for two similar
[image:3.595.324.549.577.718.2]samples (the error bars represent the maximum and the minimum Sqvalues obtained).
Using the criteria outlined above (±3 Sqvertical and 15μm lateral) it was possible to segment the surface data and record the defect densi-ty/count across the surface data sets collected from the Al2O3ALD coat-ed barrier layers.Fig. 6shows significant defect count at +/−3 Sq vertical and 15μm lateral pruning conditions.
The analysis of the results inFig. 6showed that there was evidence of correlation between the number of large defects and the WVTR value. The high WVTR specimen (2705) had a larger density of significant de-fects as compared to the better performing substrate (2706). This result seems to agree with previous published work[35], which stated that large defects may dominate the permeation properties of the barrier film. However, even for sample (2706) there are still circa four signifi -cant defects affecting the barrier performance by allowing water vapour ingress. The question that remains is, are larger defects more significant in terms of WVTR and what is the cut off level between large significant defects and small insignificant defects in the present case?
Hence to investigate the lower limit of the defect size that is poten-tially significant, different area pruning conditions were applied while the height prune condition of ±3 Sqremained the same,Fig. 6. Using these criteria (different width pruning and ± 3 Sqheight), the defect density count appeared to converge around 2.5μm (lateral dimension) as shown inFig. 7. However, when larger pruning values are used to de-fine significance, the defect density level was consistently higher for the sample with the higher WVTR (2705) and from approximately 5μm down to 1μm; the defect density count remained stable. Interpretation of the data suggests that, for defects less than 1μm and up to 2.5μm size, sample 2706 shows a higher defect density at ~24/mm2while the defect
density for sample 2705 remains stable at 17/mm2. Above 2.5μm, the decreased defect density for sample 2706 throughout is highly significant. This result indicates that the sample with higher density of defectsN3μm exhibits inferior barrier properties.
(a)
[image:4.595.43.277.55.418.2](b)
Fig. 4.Surface topography for (a) non-defective area and (b) defective area of a sample. (Note difference in Sqvalue).
Particulate
4 µm Hole
Defect
(a)
(b)
Fig. 5.Shows (a) particulate type defect, (b) hole type defect in the Al2O3barrier coating
[image:4.595.310.545.57.469.2](ESEM images).
Fig. 6.Defects density at (±3 Sqvertical and 15 um lateral) pruning conditions for the two
[image:4.595.315.539.568.718.2]Moreover,Fig. 7also shows a plot of the accumulated surface area of the defects measured on the two samples. The results show that when all defects with lateral widths down to 1μm are used in the analysis, sample 2705 (high WVTR) consistently has a higher cumulative surface area value, but accompanied by a lower defect density. Consequently the results would indicate that when developing a metrology technolo-gy for defect characterisation on these types of barrier coatings only significant defects need to be quantified. Based on the results inFig. 7, it is possible now to classify the defects in terms of their size in relation to their significance. (Seetable 1.)
4.2. WVTR analysis and results discussion
The cumulative defect area (over a total measured area of 703 mm2) for samples 2705 and 2706 were found to be 0.083 mm2and 0.03 mm2 respectively, as shown inFig. 7. If a homogenous distribution of the de-fects is assumed across the whole of the sample area (5024 mm2), then the cumulative defect areas may be scaled up linearly and are found to be 0.012% and 0.004% of the total sample area. This should result in WVTRs of 4.86 × 10⁻⁴g/m2/day and 1.65 × 10⁻⁴g/m2/day respectively, based on the ideal values of the WVTR for the Al2O3material (see
Section 3). The experimental WVTRs of the samples, taken after a stabilisation time of 5 days, were found to be 4.1 × 10⁻³g/m2/day (sample 2705) and 2 × 10⁻³g/m2/day (sample 2706). Consequently using this method (the ratio of the defective area to non-defective area) does not give reliable results for quantifying the water vapour per-meation through the samples, seeFig. 8. However, when referring back to the theoretical model presented earlier in the paper and using Eqs.(5) and (6)for the given sets of parameters and variables for each sample, as shown inAppendix A(1), and substituting all the known data (sample area, sample thickness, number of defects, diffusion coef-ficient, water vapour concentration and the accumulative area of the de-fects) into Eq.(6), the theoretical model based on the approach of Da Silva Sobrinho et al.[11]led to results which are similar to those obtain-ed by surface topography analysis[36,37]and experimental WVTR test results. Calculations are shown inAppendix A(1).
The results inFig. 8indicate that sample 2705 has a higher WVTR value than sample 2706. This result is similar to that obtained experi-mentally using water vapour permeation test inSection 3. This would seem to indicate that the theoretical model presented in this paper after Da Silva Sobrinho et al.[11]has the potential to be used for under-standing the mechanism of water vapour permeation throughflexible PV barrierfilm defects.
To summarise, this investigation for the conditions studied here has shown that the total permeation rate through small numbers of larger defects is much greater than the total permeation rate through large numbers of small pinhole-type defects over the same area of substrate and that the use of a theoretical model yields similar results.
5. Conclusion
The segmentation analysis results and the theoretical model ap-proach in this research paper, both appear to indicate that the major con-tributing factor for determining the WVTR is the total number of larger defects, where the sample with higher density of defectsN3μm exhibit inferior barrier properties. The model presented in this paper could therefore also be used for the understanding of the overall PV module ef-ficiency, performance and lifespan. In addition to this, the results would seem to indicate that, for these substrates produced under the stated conditions, the critical spatial resolution required for defect detection need not be less than 3μm, as any defect that has less than this lateral size seems to have a much lower effect on the barrier properties.
Acknowledgements
The authors would like to thank the EU for providing funds to carry out this work via the NanoMend project NMP4 LA-2011-280581, the EPSRC Centre for Innovative Manufacturing in Advanced Metrology (EP/I033424/1), and the Libyan Cultural Attaché in London (EE178-522-30836 (2013/2014)).
[image:5.595.320.551.52.216.2]Appendix A
Fig. 7.Defects count and accumulative area at different lateral pruning conditions for the measured area (703 mm2) of two similar samples.
Fig. 8.Comparison between the theoretical and experimental results for the two similar samples.
Sample 2705 data
Parameter Given unit Metric unit (m)
L (film thickness) 125.04μm 0.000125 m D (diffusion coefficient) 4 × 10⁻¹²
cm2
/s 4 × 10⁻¹⁶
m2
/s
∅(water vapour concentration) 1 g/cm3
1,000,000 g/m3
Accumulated defect area (A) 0.592558 mm2
5.93 × 10⁻⁷
m2
Sample area (A) 5024 mm2
m2
[image:5.595.53.285.53.185.2]0.00524 N (total number of defects at 3μm) 121 121 Table 1
Type and size of significant/non-significant defects in the Al2O3barrierfilm.
Type of defect Feature size
Vertical Lateral
Significant (holes and particulates)
≥(±2.4) nm/field of view ≥3μm lateral dimension
Non-significant (holes and particulates)
[image:5.595.42.292.679.744.2]Q one holeð Þ ¼qH
t ¼ πR20D∅
L :
Q many holesð Þ ¼qH
t ¼
AcumulativeD∅
L :
Q¼5:9310− 7
410−161106
0:000125 ¼1:9010
−12
g=s:
WVTR¼Q
AN86400 dayð Þ:
WVTR¼1:9010− 12
0:00524 12186400¼3:9610 −3
:
WVTR¼3:9610−3g=m2=day:
Q one holeð Þ ¼qH
t ¼ πR20D∅
L :
Q many holesð Þ ¼qH
t ¼
AcumulativeD∅
L :
Q¼2:00310− 7
410−161106
0:000125 ¼6:8210
−13
g=s:
WVTR¼QAN86400 dayð Þ:
WVTR¼6:4110− 13
0:00524 13686400¼1:5310 −3
:
WVTR¼1:5310−3g=m2=day:
References
[1] P.F. Carcia, R.S. McLean, S. Hegedus, ALD moisture barrier for Cu (InGa) Se2solar cells, ECS Trans. 33 (2010) 237.
[2] M. Igalson, A. Urbaniak, Defect states in the CIGS solar cells by photocapacitance and deep level optical spectroscopy, Technol. Sci. 53 (2005) 157.
[3] IEC 61646, Thin-film Terrestrial Photovoltaic (PV) Modules—Design, Qualification and Type Approval, second ed. IEC Central Office, Geneva, 2008.
[4] D.J.L. BrÃ, Investigation and development of CIGS solar cells onflexible substrates and with alternative electrical back contacts, Diss., Eidgenössische Technische Hochschule ETH Zürich, Zurich, 2009.
[5] M.D. Kempe, Control of moisture ingress into photovoltaic modules, Photovoltaic Specialists Conference. Conference Record of the Thirty-first IEEE, 2005, p. 503.
[6] A.A. Dameron, S.D. Davidson, B.B. Burton, P.F. Carcia, R.S. McLean, S.M. George, Gas diffusion barriers on polymers using multilayers fabricated by Al2O3and rapid SiO2atomic layer deposition, J. Phys. Chem. C 112 (2008) 4573.
[7] J.H. Hotchkiss, Food‐packaging interactions influencing quality and safety, Food Addit. Contam. 14 (1997) 601.
[8]M. Chainey, Transport phenomena in polymerfilms, in: N.P. Cheremisinoff (Ed.), Hand-book of Polymer Science and Technology, Marcel Dekker, Inc., New York, 1989, p. 499. [9] Y. Zhang, Y.-Z. Zhang, D.C. Miller, J.A. Bertrand, S.-H. Jen, R. Yang, M.L. Dunn, S.M. George, Y. Lee, Fluorescent tags to visualize defects in Al2O3thinfilms grown using atomic layer deposition, Thin Solid Films 24 (2009) 6794.
[10]Y. Zhang, J.A. Bertrand, R. Yang, S.M. George, Y. Lee, Electroplating to visualize de-fects in Al2O3thinfilms grown using atomic layer deposition, Thin Solid Films 11 (2009) 3269.
[11] A. da Silva Sobrinho, G. Czeremuszkin, M. Latreche, M. Wertheimer, Defect-permeation correlation for ultrathin transparent barrier coatings on polymers, J. Vac. Sci. Technol. A 18 (2000) 149.
[12]H. Chatham, Oxygen diffusion barrier properties of transparent oxide coatings on polymeric substrates, Surf. Coat. Technol. 78 (1996) 1.
[13]M. Hanika, H.C. Langowski, U. Moosheimer, W. Peukert, Inorganic layers on poly-mericfilms—influence of defects and morphology on barrier properties, Chem. Eng. Technol. 26 (2003) 605.
[14]A. Erlat, R. Spontak, R. Clarke, T. Robinson, P. Haaland, Y. Tropsha, N. Harvey, E. Vogler, SiOxgas barrier coatings on polymer substrates: morphology and gas trans-port considerations, J. Phys. Chem. B 103 (1999) 6047.
[15]G. Garcia-Ayuso, L. Vázquez, J.M. Martínez-Duart, Atomic force microscopy (AFM) morphological surface characterization of transparent gas barrier coatings on plastic
films, Surf. Coat. Technol. 80 (1996) 203.
[16]A.G. Erlat, B.M. Henry, C.R. Grovenor, A.G. Briggs, R.J. Chater, Y. Tsukahara, Mecha-nism of water vapor transport through PET/AlOxNygas barrierfilms, J. Phys. Chem. B 108 (2004) 883.
[17] J.S. Lewis, M.S. Weaver, Thin-film permeation-barrier technology forflexible organic light-emitting devices, IEEE J. Sel. Top. Quantum Electron. 10 (2004) 45. [18]A. Ruanthon, C. Thanachayanont, T. Sarakonsri, Preparation of CIGS p-type
semiconduc-tor used as thermoelectric material by sol–gel, J. Mater. Sci. Appl. Energy 3 (2013) 10. [19] W. Henry, Experiments on the quantity of gases absorbed by water, at different tem-peratures, and under different pressures, Philos. Trans. R. Soc. London, Ser. A 93 (1803) 29.
[20] A. Fick, Ueber diffusion, Ann. Phys. 170 (1855) 59.
[21] W. Su-Huai, S.B. Zhang, A. Zunger, Effects of Ga addition to CuInSe2on its electronic, structural, and defect properties, Appl. Phys. Lett. 72 (1998) 3199.
[22] S.v. Wroblewski, Ueber die Natur der Absorption der Gase, Ann. Phys. 244 (1879) 29. [23] R. Ashley, Permeability and plastics packaging, in: J. Comyn (Ed.), Polymer
Perme-ability, Chapman & Hall, London, 1985, p. 269.
[24] F. Debeaufort, A. Voilley, P. Meares, Water vapor permeability and diffusivity through methylcellulose ediblefilms, J. Membr. Sci. 91 (1994) 125.
[25]M. Kanezashi, T. Tsuru, Gas permeation properties of helium, hydrogen, and polar molecules through microporous silica membranes at high temperatures: correlation with silica network structure, in: S.T. Oyama, S.M. Stagg-Williams (Eds.), Inorganic, Polymeric and Composite Membranes: Structure, Function and Other Correlations, Elsevier, Oxford, 2011, p. 117.
[26] J.A. Bertrand, D.J. Higgs, M.J. Young, S.M. George, H2O vapor transmission rate through polyethylene naphthalate polymer using the electrical Ca test, J. Phys. Chem. A 117 (2013) 12026.
[27]A.S. Da Silva Sobrinho, M. Latreche, G. Czeremuszkin, J.E. Klemberg-Sapieha, M.R. Wertheimer, Transparent barrier coatings on polyethylene terephthalate by single- and dual-frequency plasma-enhanced chemical vapor deposition, J. Vac. Sci. Technol. A 16 (1998) 3190.
[28] S.M. George, Atomic layer deposition: an overview, Chem. Rev. 110 (2009) 111. [29] S.M. George, B. Yoon, A.A. Dameron, Surface chemistry for molecular layer deposition
of organic and hybrid organic–inorganic polymers, Acc. Chem. Res. 42 (2009) 498. [30] B. Duncan, J. Urquhart, S. Roberts, Review of measurement and modelling of
perme-ation and diffusion in polymers, NPL Report DEPC MPR 012. Middlesex, 2005, p. 1. [31] ISO 25178, Geometrical Product Specifications (GPS)—Surface Texture: Areal—Part 2: Terms, Definitions and Surface Texture Parameters,first ed. International Organi-sation for StandardiOrgani-sation, Geneva, 2012.
[32]L. Blunt, X. Jiang, Numerical parameters for characterisation of topography, in: L. Blunt, X. Jiang (Eds.), Advanced Techniques for Assessment Surface Topography: Development of a Basis for 3D Surface Texture Standards“Surfstand”, Kogan Page Science, London, 2003, p. 17.
[33] K.J. Stout, L. Blunt, Three Dimensional Surface Topography, second ed. Elsevier, London, 2000.
[34] X. Jiang, P.J. Scott, D. Whitehouse, L. Blunt, Paradigm shifts in surface metrology. Part II. The current shift, Proc. R. Soc. London, Ser. A 463 (2007) 2071.
[35] A. Erlat, B. Henry, J. Ingram, D. Mountain, A. McGuigan, R. Howson, C. Grovenor, G. Briggs, Y. Tsukahara, Characterisation of aluminium oxynitride gas barrierfilms, Thin Solid Films 388 (2001) 78.
[36]L. Blunt, M. Elrawemi, L. Fleming, F. Sweeney, Correlation of micro and nano-scale defects with WVTR for aluminium oxide barrier coatings forflexible photovoltaic modules, Int. J. Precis. Technol. 3 (2013) 290.
[37] M. Elrawemi, L. Blunt, L. Fleming, F. Sweeney, Further development of surface me-trology methods for predicting the functional performance offlexible photovoltaic barrierfilms, Surf. Topogr. Metrol. Prop. 1 (2013) 015006.
Sample 2706 data
Parameter Given unit Metric unit (m)
L (film thickness) 125.04μm 0.000125 m D (diffusion coefficient) 4 × 10⁻¹²
cm2
/s 4 × 10⁻¹⁶
m2
/s
∅(water vapour concentration) 1 g/cm3 1,000,000 g/m3
Accumulated defect area (A) 0.2003 mm2 2.003 × 10⁻⁷m2
Sample area (A) 5024 mm2
m2