2017 2nd International Conference on Computational Modeling, Simulation and Applied Mathematics (CMSAM 2017) ISBN: 978-1-60595-499-8
Agent Based Simulation on Task Workflow Oriented Self-Organization of
Cellular Organizational Network
Jie LIU
1,*, Wei-ming ZHANG
1, Bo LI
2and Zhong-ju SUN
21Science and Technology on Information Systems Engineering Laboratory, National University of
Defense Technology, Changsha 410072, China
2Xi’an High-Tech Research Institute, Xi’an 710025, China
*Corresponding author
Keywords: Task oriented self-organization, Agent based simulation, Cellular organizational network.
Abstract. Modeling self-organization is a critical problem in computational analysis of
organizational dynamics and decision support system. Task workflow oriented self-organization shows different characteristics from completely self-organization mechanism. Towards this end, a task workflow oriented self-organization model is constructed to analyze the internal mechanism and performance under different task requirement environments. The cellular organizational network is used to model the relationship structure of cellular work groups. The Agent Based Simulation (ABS) is used to simulate the whole activity self-organization process and individual behaviors driven by task workflow. The model is examined through for simulation experiments. Experimental results shows the difference of the organizational performance according to different task requirements, which exhibits potential application in task workflow oriented organization design and optimization.
Introduction
A key aspect of understanding organizational dynamics is the self-organization mechanism by which its structures grow and change over time [1]. Self-organization means the process of generating, adapting and changing organizational structure, which is the result of individual choices by a set of agents to engage in interaction in certain organizational patterns [2]. The interplay between topology and dynamics in complex networks is a fundamental but widely unexplored problem [3]. Individual behavior and network ties mutually influence each other [4]. Previous researches have indicated that the behavioral preference has a determined impact on the organization structure formation and performance [5,6]. The Dynamic Network Analysis method [7] calculates the task completion likelihood based on extracted organization structure and make use of empirical data adequately [8], however, it cannot describe the task-oriented self-organizing behaviors. Social organization works according to a certain sequence of programs which is not completely self-organization by the members.
Cellular Organizational Network
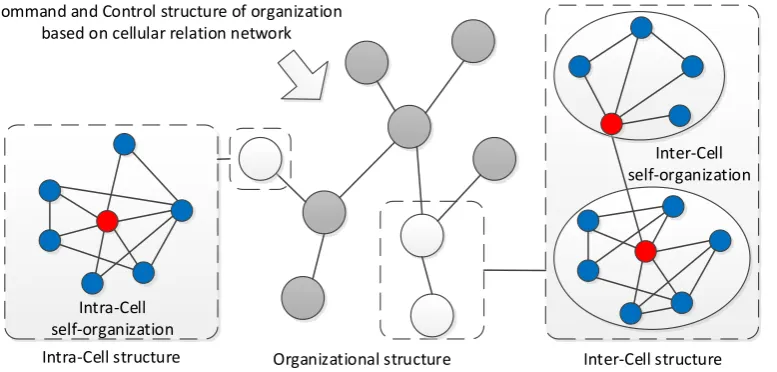
Some social organizations have different structure from the online social network topology with group cellular structure. The cellular organizational network is a model which describes the inter cooperation relationship and organizational form of task oriented groups, such as working team, project team, terrorist group [9]. In our research, the virtual structure of cellular is used, and the organization is described as a network of cells. The tasks are performed by the cells, and within them, the activities include not only performing operational tasks which are designated, but also collaborative process among members. Fig. 1 illustrates the concept model of cellular network. A cell is a cohesion structure of members, and the command relation is built according to the hierarchical structure of organization. The relations between the cells depict the command and control structure from meso-scale perspective, and the relations in the cells describe the local structure of how the members connect and communicate to each other from micro-scale perspective. In each cell, there is a leader in charge of designated task, and the other members operate various subtasks.
Organizational structure Inter-Cell structure Inter-Cell self-organization
Intra-Cell self-organization Intra-Cell structure
[image:2.595.111.500.277.463.2]Command and Control structure of organization based on cellular relation network
Figure 1. Conceptual model of cellular network structure.
Task Workflow Oriented Self-Organization Mechanism
The difference between task workflow oriented self-organization and completely self-organization mechanism is that the members in the organization work following a certain workflow program, which means that the subtasks are performed according to a sequence. The mechanism can be modeled from task workflow and self-organization based interaction.
Task Workflow
Task end
Task Type 1 Task Type 2 Task Type 3
Subtask 1
Subtask 2
Subtask 3
Subtask 4
Subtask 5
[image:3.595.121.478.74.191.2]Subtask 6
Figure 2. Conceptual model of task workflow.
Self-Organization Based Interaction
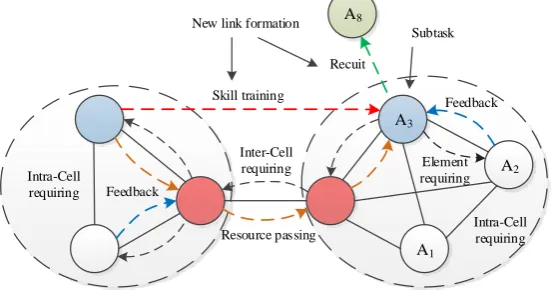
Agent cooperation refers to that the cell leaders periodically communicate with cell members, both to coordinate activity and to promote and/or maintain cell cohesion [10]. In this part we focus on the individual interaction between agents. As show in Fig. 3, the interaction behaviors can be modeled as follows:
Step 1: After receiving the subtask, the member agent first checks the other agents in the same cell to find if there is any agent who has the element. If there is one, then obtain the element and finish the subtask. If there is not any agent, turn to step 2.
Step 2: Send an element requiring message to the leader agent of the cell, and then the leader agent will send the same message to the other cell leaders for element requiring.
Step 3: Each cell leader who has received the requiring message will check the members in the cell, and then sends a feedback to the requiring cell leader.
Step 4: Finish element transferring. If it is resource requirement, then the resource will be transferred through the cell leaders, otherwise, if it is skill requirement, then the skill will be got through face-to-face transferring, known as training process.
In Fig. 3, the black dotted arrows are the requiring messages, and the blue dotted arrows are the feedbacks. The orange dotted arrows are the resource passing behaviors from the target agent (A7) to
the source agent (A3), and the red dotted arrow is the skill training behavior. These two types of
behaviors are different in transferring path, and this is because of the difference of element type. Recruitment is different from the other behaviors, and it is direct interaction between the source agent (A3) and the target agent (A8). There are two types of behaviors, skill straining and recruitment, can
build new links.
A1
A2
A3
A4
A5
A7
A6
Intra-Cell requiring Element requiring
Feedback
Inter-Cell requiring Intra-Cell
requiring Feedback
Resource passing Skill training
Subtask
A8
Recuit New link formation
[image:3.595.160.438.553.698.2]between members and the changes of network structure in this paper. The individual interactions are driven by operations to complete task, thus organizational evolve is task-oriented. In this section, we give the indicators that are used to measure and analyze the organization performance.
Organizational Structure Analysis
In order to analysis the structural change of the organization, four network characteristics are used to measure the organizational changes.
Number of links. The total number of links measures the dynamics growth of relations in organization.
Average path length. This criterion is used to measure the element transfer efficiency in organization.
Clustering coefficient. According to the graph theory, clustering coefficient measures the clustering degree of the nodes.
Network density. It measures the closeness degree of the organizational members.
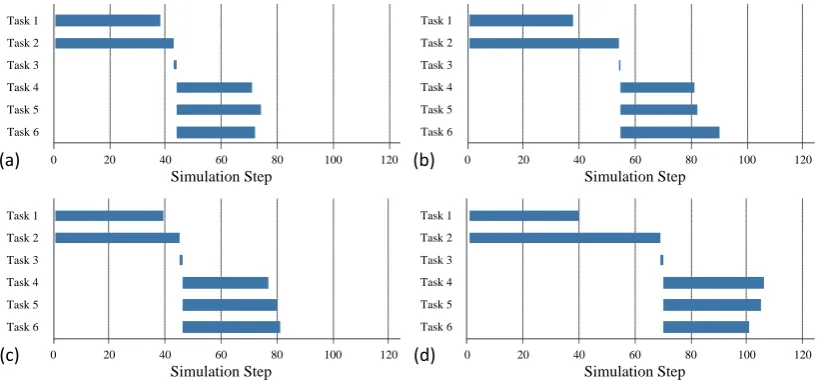
Task Completion Performance
The task completion performance is measured according to the time when all the tasks are completed. In order to show the details of the task performing process, the Gantt chart is used to show the time of the subtasks.
Experiments and Results Analysis
Experimental Setup
Considering the elements acquiring difference of tasks, we assumed four types of scenarios for simulation experiments as follows.
Scenario 1: The resource, skill and human are enough.
Scenario 2: The resource is not enough, and the skill, the human are enough. Scenario 3: The resource, the skill are enough, and the human is not enough. Scenario 4: The resource is enough, and the skill, the human are not enough.
[image:4.595.125.466.537.600.2]A task is consists of 6 subtasks as shown in Fig. 2. The sequence relationship between the subtasks is also the same as in the conceptual model.
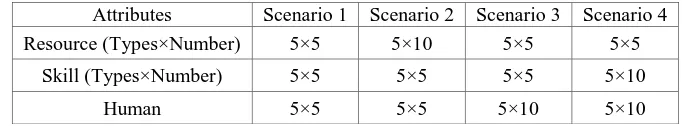
Table 1. Task requirement in simulation scenarios.
Attributes Scenario 1 Scenario 2 Scenario 3 Scenario 4 Resource (Types×Number) 5×5 5×10 5×5 5×5
Skill (Types×Number) 5×5 5×5 5×5 5×10
Human 5×5 5×5 5×10 5×10
Table 2. Simulation parameters setting.
Simulation parameters Range Default Object of parameter
Agent number -- 50 Network
Cell number -- 8 Network
Agent number of cell [0,10](int) given Network
Skill learning time threshold [1,10](int) random Agent
Resource search wait time [1, 50](int) 10 Agent
New resource requiring probability [0,1] 0.5 Agent
Recruitment probability [0,1] 0.1 Agent
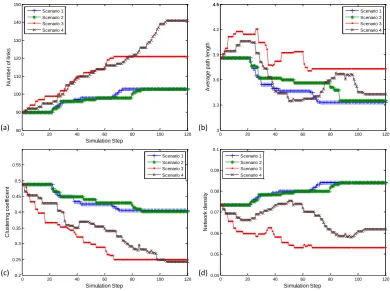
[image:5.595.97.488.356.647.2]Organizational Structure Characteristics Evolution
Fig. 4 shows the curves of four characteristics. As shown in Fig. 4(a), the number of links increases with time, and the final value is determined by elements requirements. Fig. 4(b) shows the evolutional results of average path length in organizational network, which indicates that the nodes are getting closer in the scenarios. It is interesting that average path length is fluctuating during the task period in scenario 3 and 4, and this is because of the links and the nodes are increasing simultaneously. Fig. 4(c) shows evolution results of clustering coefficient. The curves indicate that element requiring behaviors decrease the clustering of the nodes in organization. Fig. 4(d) presents the evolution results of network density, and the curves show that the recruitments make the organization more dispersive.
0 20 40 60 80 100 120
0.2 0.25 0.3 0.35 0.4 0.45 0.5 0.55 Simulation Step C lu st e ri n g co e ff ici e n t Scenario 1 Scenario 2 Scenario 3 Scenario 4
0 20 40 60 80 100 120
80 90 100 110 120 130 140 150 Simulation Step N u m b e r o f li n ks Scenario 1 Scenario 2 Scenario 3 Scenario 4 (a)
0 20 40 60 80 100 120
3 3.3 3.6 3.9 4.2 4.5 4.5 Simulation Step A ve ra g e p a th l e n g th Scenario 1 Scenario 2 Scenario 3 Scenario 4 (b) (c)
0 20 40 60 80 100 120
0.04 0.05 0.06 0.07 0.08 0.09 0.1 Simulation Step N e tw o rk d e n si ty Scenario 1 Scenario 2 Scenario 3 Scenario 4 (d)
Figure 4. Network characteristics evolution, (a) number of links, (b) average path length, (c) clustering coefficient, and (d) network density.
intelligent tasks (task 1 and 2). Since the task requirements are the same, the reason is that the network is getting dense, which makes the element transferring more quick.
0 20 40 60 80 100 120 Task 1
Task 2 Task 3 Task 4 Task 5 Task 6
0 20 40 60 80 100 120
(a) (b)
Simulation Step Simulation Step
Task 1 Task 2 Task 3 Task 4 Task 5 Task 6
0 20 40 60 80 100 120 Task 1
Task 2 Task 3 Task 4 Task 5 Task 6
(c)
Simulation Step
0 20 40 60 80 100 120
(d)
Simulation Step
[image:6.595.92.503.114.305.2]Task 1 Task 2 Task 3 Task 4 Task 5 Task 6
Figure 5. Gantt chart of task completion process.
Summary
This paper studied the organizational dynamics by modeling the task-oriented self-organization with ABM method. Modeling and simulating the process enable us to quantitatively investigate the dynamic of individual behaviors and organization performance during task performing process. The simulation experiments show that the organizational structure and information flow are influenced by the task content and requirement. During the task performing process, the self-organization mechanism makes the structure more suitable for task performing and individual interaction, which means that the organization adaptive evolves according to the task requirements. In conclusion, this work gives a new insight into social organization dynamics by modeling self-organization. It can be used to test variety of simulation experiments to investigate organization dynamics under different scenarios.
Acknowledgement
This research was financially supported by the National Science Foundation of China (Grant No. 71471176 and Grant No. 71704184).
References
[1] D. Conway, Modeling Network Evolution Using Graph Motifs, arXiv: Methodology, 2011.
[2] M. Schillo, B. Fley, M. Florian, et al., Self-Organization in Multiagent Systems: From Agent Interaction to Agent Organization, Third International Workshop on Modeling Artificial Societies and Hybrid Organisations (MASHO), (2002) 37-46.
[3] D. Garlaschelli, A. Capocci, G. Caldarelli, Self-organized network evolution coupled to extremal dynamics, Nature Physics, 3, 11 (2007) 813-817.
[4] T.A.B. Snijders, C.E.G. Steglich, M. Schweinberger, Modeling the co-evolution of networks and behavior, Longitudinal models in the behavioral and related sciences, K.V. Montfort, J. Oud, A. Satorra Ed., Lawrence Erlbaum Associates Publishers, 2007, pp. 41-71.
[6] M.E.J. Newman, The Structure and Function of Complex Networks, SIAM Review, 45, 2 (2003) 167-256.
[7] K.M. Carley, Dynamic Network Analysis, Dynamic Social Network Modeling and Analysis: Workshop Summary and Papers, (2003) 133-145.
[8] I.-C. Moon, E.J. Kim and K.M. Carley, Automated Influence Network Generation and the Node Parameter Sensitivity Analysis, 13th International Command and Control Research and Technology Symposia (ICCRTS 2008), Seattle, WA, (2008) 1-17.
[9] T.L. Frantz and K.M. Carley, A Formal Characterization of Cellular Networks, Center for Computational Analysis of Social and Organizational Systems (CASOS) CMU-ISRI-05-109, 2005.
[10] A. Ilachinski, Modelling insurgent and terrorist networks as self-organised complex adaptive systems, International Journal of Parallel, Emergent and Distributed Systems, 27, 1 (2012) 45-77.