2017 2nd International Conference on Computer, Mechatronics and Electronic Engineering (CMEE 2017) ISBN: 978-1-60595-532-2
Ontology-driven Bayesian Network Model for Semantic Expression
Alaa Aldeen Ismail Abuazab
1,*, Harihodin Bin Selamat
1,
Rasimah Bt Che Mohd Yusoff
1and Ahmed N. Abdalla
21
Faculty of Advanced Informatics School, Universiti Teknologi, Johor, Malaysia 2
Faculty Electronic Engineering, Huaiyin Institute of Technology, Jiangsu, China
*Corresponding author
Keywords: Bayesian network model, Medical diagnosis, Blood pressure.
Abstract. In this paper, ontology-driven Bayesian network model is proposed using the semantic ontology knowledge base, which automatically transforms the entities of the ontology into the Bayesian network model. Brief detail of the advantage of Bayesian network is applied for solving the uncertain and non-complete information. The hypertensive ontology is constructed to prove the validity of the model. The medical diagnosis algorithm based on the ontology-driven Bayesian network model to assist the NETICA Application Programming Interface (API). The proposed model used to realize the mapping between ontology and Bayesian network, and the different probability of the condition is entered to obtain the probability that the patient is suffering from high blood pressure. The experimental results show that the model is correct and feasible, and it has good universality and portability in medical diagnosis.
Introduction
real world in a reasonable way through probability. At the same time, to show uncertain knowledge, making the Bayesian network in different environments to be applied, especially in the direction of reasoning. Bayesian basic structure for the directional acyclic graph, which is responsible for the application of variables and variables between the relationships between the encoding, the associated digital part and the joint probability distribution associated coding, Bayesian network model which can Structure and digital information modeling.
The innovation of this paper is to combine the advantages of ontology and Bayesian network to create an ontology-driven Bayesian network model to express the knowledge of ontology using Bayesian network to express its probability, by providing the patient with the probability of illness, the diagnosis of medical diseases to provide a reference. Then we construct the Bayesian network model from the body of hypertension on the basis of NETICA API, and finally use the Bayesian network to infer the patients with hypertension Probability.
Knowledge of Medical Field
At present, many scholars have studied the ontology and given its definition [9-10]. In essence, the ontology provides a well-defined knowledge. This knowledge can improve the accuracy and efficiency of communicating information with each other, resulting in other benefits such as operation, reuse, and sharing. The specific development process is as follows.
The Goal and Scope of the Ontology
In order to clearly describe the concept of medical field and the relationship between concepts, the medical field ontology constructed should not only meet the needs of the medical field, but also should have strong semantic reasoning, so the construction of the ontology requires the participation of occupational physicians.
Build the Ontology
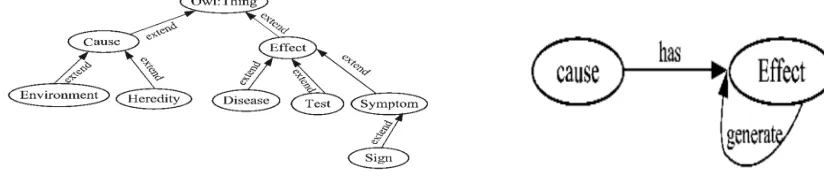
First, the key concepts in the field should be described before constructing the ontology of the domain, and Fig.1 depicts the key concepts defined in the medical ontology. In the ontology, the class is the expression of the concept, and in this particular reference to the two main Figure 1 medical ontology class relationship, that is, the cause (Cause) and the results (Effect).
The subclasses of the cause are the environment and the Heredity. The subclasses of the results are Disease, Symptom, Sign, Test. The second step is to determine the relationship between the attributes of the concept. The two main attributes of this paper, as shown in Fig.2.
[image:2.612.98.510.519.607.2]
Figure 1. The hierarchy of medical ontology. Figure 2. The relationship between classes.
Figure 3. Definition of ontology in the field of hypertension.
The Proposed Bayesian Network Model
In the Bayesian network model, each node represents a domain variable, and the relationship between nodes represents the dependency between the node and the node. In this paper, the NETICA Application Programming Interface [11] (API) is used to create the Bayesian network. The hierarchical structure between the Bayesian network nodes can be automatically constructed by the program code, which is based on the hierarchical relationship between the entities in the medical ontology. All of the Bayesian network nodes are created in parallel in memory, and the parent-child relationship between nodes is created by using synchronization techniques between executing threads, so the child node will wait until all of its parent nodes are created. After the construction algorithm is completed, the conditional probability table will be filled with the default value (this operation is done automatically by NETICA). The structure of a conditional probability table depends on the number of parent nodes.
At the time of construction, there are three states: 1) for a root node without a parent node, the state of the conditional probability expression and the attribute defined by the node in the ontology are the same. 2) If the node has only one parent node, the conditional probability table is represented by a two-dimensional matrix. Where one dimension is the state of the node and the other is the state of the parent node. 3) For those nodes with more than one parent node, this paper uses the Noisy-Or algorithm [12] to reduce the number of probability parameters. Noisy-Or can greatly simplify the conditional probability table. And in practical applications it is easier to estimate the conditional probability between any two nodes than to estimate the joint conditional probability of multiple nodes for a node.
The Bayesian network can be constructed according to the following steps [13]: Step. 1 to determine the range of variables and variables in the range;
Step. 2 to determine the relationship between variables in the field and describe the relationship as a graphical structure;
Step. 3 The variables in the Bayesian are all derived from the entities defined in the body. Definition 1 causality independence.
In the Bayesian network model, if the parent variables can have a separate probability
on the sub-variable C, it is said that the n parent nodes are independent of each other. In the case of causality independence, the Bayesian network model is the Noisy-Or model, and the parent nodes of the nodes in the Noisy-Or model are causally independent. The conditional probability of occurrence of node in the Bayesian network shown in Fig. 4 is as follows.
. (1)
Most of the conditional Probability Table of Cardiovascular Disease Report [11]. Very few conditional probability tables are obtained by the cardiovascular physician under the guidance of statistics. Table 1 shows the impact of different risk factors on the risk of hypertension.
Table 1. Risk factors for hypertension in different risk factors.
Risk factors Risk factors for hypertension Prevalence %
Family Hypertension No 18.22
Yes 30.38
Alcohol No 24.04
Yes 28.83
Obesity No 16.50
Yes 51.20
Triglyceride Normal 20.69
High 37.20
Cholesterol Normal 21.29
High 43.26
Smoking No 22.54
Yes 26.32
Experiments and Analysis
NETICA provides a variety of programming language APIs that can manipulate the Bayesian network and provide a software product for visualizing the Bayesian network. NETICA's visual reasoning experiment is as follows.
1) Generate Bayesian network hierarchy.
The input of the Bayesian network model algorithm automatically build disease from the disease ontology, and the algorithm will also output a Bayesian network model that can be identified by the NETICA software product. However, this model can not be used for reasoning, because the model contains only from the ontology mapping from the structural information.
2) Enter the digital information of the model - the conditional probability table.
For those nodes that do not have a parent node or only one parent node, their conditional probability table can be entered directly in the visual table. For those nodes with multiple parent nodes, the Noisy-Or algorithm is used to simplify the conditional probability table. The conditional probability will be calculated using equation (1). In the NETICA software, the conditional probability table of the Noisy-Or algorithm is expressed by the formula. In the Hypertension Bayesian network model, there are two nodes that need to use the Noisy-Or algorithm. The conditional probability formula for the node Obesity is shown in equation (2). Where the odds 0.30 for p (Obesity | Overnutation) = 0.30, that is, Overnutrition (yes) is yes, Obesity is the probability of yes. Likewise, the number 0.27 can be similarly explained.
(2) The conditional probability formula for the node Hypertension as in Eq.(3).
. (3) 3) Enter patient evidence and diagnose.
Using the evidence shown in Table 2 to do the experimental test, the evidence from a diagnosis of patients with high blood pressure. From Table 2 enter to the node Obesity, Cholesterol, tri- glyceride all the evidence, based on the probability of suffering from hypertension is 65.2%.
of Obesity, the evidence of the Overnutrition node and the not Enough Exercise node is lost. It can be seen from Fig.6 that the probability of the Overnutrition node and the not Enough Exercise node is deduced by the evidence of the Obesity node. Finally, enter all the evidence in Table 2 and get the diagnostic conclusion shown in Fig. 7. At this point we can see that the probability of suffering from high blood pressure is 84.8%. In addition, the probability of high blood pressure in the patient may be further inferred from the probability of symptoms or other conditions caused by hypertension in the patient. In Fig.5-7, the reason of the probability of these three nodes Cephalagia, Epistaxis, Dizziness is the default (50%) because we have not yet provided the conditional probability table for the relationship between hypertension and these nodes.
Figure 5. Diagnostic conclusion 1.
[image:5.612.107.501.194.456.2]
Figure 6. Diagnostic conclusion 2. Figure 7. Diagnostic conclusion 3.
Table 2. System Test Data.
Evidence Probability Evidence Probability
Over-nutrition 0.60 Triglyceride 1
Not Enough Exercise 0.55 Alcohol 1
Obesity 1 Smoking 0 0
Cholesterol 0 Family Hypertension 1
Conclusion
Reference
[1] O. Chapelle, & Y. Zhang. A dynamic bayesian network click model for web search ranking. In Proceedings of the 18th international conference on World wide web, (2009), pp. 1-10.
[2] A. C. Constantinou, N.Fenton, W.Marsh, & L.Radlinski,. From complex questionnaire and interviewing data to intelligent Bayesian network models for medical decision support. Artificial intelligence in medicine, 67, (2016) 75-93.
[3] A. Noraziah, R Norhayati, Ahmed N Abdalla, A. H. Roslina, M. A. Noorlin, OM Affendy.. A novel database system model design for tender management system. Journal of Computer Science, 4(6) (2008) 463.
[4] K. Srinivas, B. K. Rani, & A. Govrdhan. Applications of data mining techniques in healthcare and prediction of heart attacks. International Journal on Computer Science and Engineering (IJCSE), 2(02), (2010) 250-255.
[5] A. Noraziah, M Mat Deris, Ahmed N Abdalla, R Norhayati, MY Saman, MA Zeyad, (2007). Preserving data consistency through neighbor replication on grid daemon. American Journal of Applied Science, 4(10); 748-755.
[6] I. H. Witten, Frank, E., Hall, M. A., & Pal, C. J. (2016). Data Mining: Practical machine learning tools and techniques. Morgan Kaufmann.
[7] H. Zhang, Liu, J., & Kato, N. (2017). Threshold Tuning-Based Wearable Sensor Fault Detection for Reliable Medical Monitoring Using Bayesian Network Model. IEEE Systems Journal.
[8] K. F. R. Liu, C. F. Lu, C. W. Chen, & Y. S. Shen. Applying Bayesian belief networks to health risk assessment. Stochastic environmental research and risk assessment, 26(3), (2012) 451-465.
[9] J. Wang, , Huang, Q., Liu, Z. P., Wang, Y., Wu, L. Y., Chen, L., & Zhang, X. S.. NOA: a novel Network Ontology Analysis method. Nucleic acids research, 2011.
[10] M. Spies. An ontology modelling perspective on business reporting. Information Systems, 35(4), 404-416, 2010.
[11] N. J. Manual, (2012). Version 4.18 and Higher, Norsys Software Corp.
[12] M.Henrion. Practical issues in constructing a Bayes' belief network. arXiv preprint arXiv:, (2013) 1304.2725.