Article
On the effect of cavity formation during the water
entry of flexible bodies
Riccardo Panciroli1,* , Tiziano Pagliaroli1 and Giangiacomo Minak2
1
2
3
4
5
6
7
8
9
10
11
12
13
1 NiccolòCusanoUniversity,viadonCarloGnocchi3,Rome,Italy
2 AlmaMaterStuiorum-UniversitàdiBologna,DIN,viaFontanelle40,Forlì,Italy
* Correspondence:[email protected]
Abstract: Elastic bodies entering the water might experience Fluid-Structure Interaction phenomena introduced by the mutual interaction between the structural deformation and the fluid motion. Cavity
formation, often misleadingly named cavitation, is one of these. This work presents the results of an
experimental investigation on the water entry of deformable wedges impacting a quiescent water
surface with pure vertical velocity in free fall. The experimental campaign is conducted on flexible
wedges parametrically varying the flexural stiffness, deadrise angle, and drop h eight. It is found
that under given experimental conditions cavity pockets forms beneath the wedge. Their generation
mechanism is found to be ruled by a differential between structural and fluid velocities, which is
introduced by the structural vibrations. Results show that the impact force during water entry of
stiff bodies is always opposing gravity, while in case of flexible bodies might temporarily reverse
its direction, with the body that is being sucked into the water within the time frame between the
cavity formation and its collapse. Severe impacts might also generate a series of cavity generation
and collapses.
Keywords: Water Entry, hydroelasticity, cavitation, FSI, SPH, slamming 14
1. Introduction 15
The impulsive nature of the hydrodynamic loading experienced by structures impacting the 16
water might induce mechanical vibrations [1–3]. These introduce a series of so-called fluid-structure 17
interaction (FSI) phenomena, such as air inclusions [4], ventilation, and cavitation [5], which are 18
encountered in a wide range of water entry problems from naval [6–9] to aerospace applications 19
[10–12]. In the literature, many experimental works investigated the hydrodynamic pressure at the 20
fluid-structure interface during the water entry of rigid or very stiff bodies, showing that established 21
analytical formulations [13,14] can be used with very high confidence [15]. However, in case of FSI, the 22
theoretical formulations capable of predicting the hydrodynamic impact load developed for the water 23
entry of rigid bodies become inaccurate. Due to the mutual coupling between the fluid motion and the 24
structural deformation, the hydrodynamic loads that elastic bodies are subjected during the water entry 25
might differ from the loads acting on rigid bodies [16]. The evolution of the wetted body area in time 26
is an important characteristic of the impact, and variations of the structural shape due to its flexibility 27
might affect the loads [17]. Such problems are still difficult to analyse and compute. Predicting the 28
structural deformations and stresses during the water entry of flexible structures is a major challenge 29
and a deep understanding of these FSI phenomena is a dire need. Most of the analytical and numerical 30
works found in the literature [18–21] do not account for such FSI phenomena, since these can be 31
neglected in the cases where structural deformations are small and the hydrodynamic pressure is 32
similar to the one experienced by a rigid body (see e.g. [22–25]). 33
2 of 15
The occurrence of cavitation during the water entry of flexible bodies has been predicted in 34
the literature (e.g. [7,26]). Hydroelasticity might facilitate cavitation [6,27], since pressure becomes 35
sub-atmospheric during the second half of the first wet natural oscillation period. Reinhard [28] 36
analytically predicted that there are conditions for which a wedge entering the water in free fall might 37
form a cavity localized at its apex. Therein, the authors also mention that elasticity of the structure 38
might enhance such phenomenon. In the literature, the term cavitation is often misused, as many 39
works relative to water entry problems use this term to define the generation of cavity formation, 40
rather than effective cavitation in its original meaning [29,30]. Korobkin [26] predicted that in blunt 41
bodies subjected to a sudden velocity drop the liquid may separate from the entering body surface 42
with formation of a cavity. He defined this phenomenon as interface cavitation. In his model, which 43
bases on Wagner’s [13] theory, the cavitation is supposed to happen when the local pressure goes 44
below the atmospheric. During the water entry of flat–bottom bodies, or geometries presenting low 45
deadrise angle, air can be trapped in between the fluid and the structure during the early stage of 46
the impact [31–34]. In such occurrence an air cushion is entrapped below the structure, lowering the 47
hydrodynamic loading. Furthermore, the presence of entrapped air in the fluid is supposed to inhibits 48
cavitation. 49
In this work we report on experimental evidences about cavity formation during water entry of 50
flexible structures. Many experimental campaigns on the water impact of compliant bodies can be 51
found in the literature [35–38], but to the Authors’ best knowledge, none of these reported on cavity 52
formation. The following sections report the most important experimental findings. At first, we give 53
some insight on the analytical prediction of cavitation during the water entry of rigid bodies, showing 54
the actual possibility of such effect. We then present the experimental setup, followed by some details 55
about the experimental results. The effects of cavity formation on the impact dynamics are presented 56
hereafter. 57
2. Cavitation onset in rigid bodies water entry as predicted by analytical formulations 58
The dynamics of the water entry of rigid bodies can be accurately predicted by utilizing Wagner’s model [13]. Such solution relies on the concept of added mass (or virtual mass), where an increasing
massmof water is considered to move with the body as it penetrates the water. In this framework, the
velocity and acceleration of the impacting wedge are given by [13]
˙
ξ= MV0
M+m =
V0
1+π
2ρ
(π/2)2ξ2
Mtan2(β)
¨
ξ= d
dt MV0 M+m =
πρ(π/2)2
MV0tan2(β)ξξ˙
3 (1)
beingξthe entry depth,Mthe mass of the wedge per unit depth,V0the initial entry velocity, andβthe
deadrise angle. Figure1shows a sketch of the problem. Wagner’s model further allows to compute
the pressure distribution along the wet portion of the body as
p
ρ =
¨
ξ
p
r2−x2+π 2
˙
ξ2r
tan(β)
√
r2−x2− 1 2
˙
ξ2x2
r2−x2 (2)
whereris the horizontal projection of the wet length of the wedge, which reads π
2tanξβ. The factor
π
2 59
accounts for the water pile-up along the wetting edge due to the displaced water. Such value has been 60
later found not to be a constant, as it actually varies with the deadrise angle [39]. We’ll here utilizeπ
2 61
as this does not qualitatively alter the solution. 62
In the case of water entry at a constant speed, the solution is self-similar in time. Otherwise, 63
the component related to the acceleration may overcome the component associated to the velocity in 64
Air
deadrise angleβ
y
x
entry depthξ
r
Water pile–up
Figure 1.Sketch of the problem of the water entry of a rigid wedge. The wedge enters the water surface att=0 (left) and penetrates the water by an entry depthξas time advances (right).
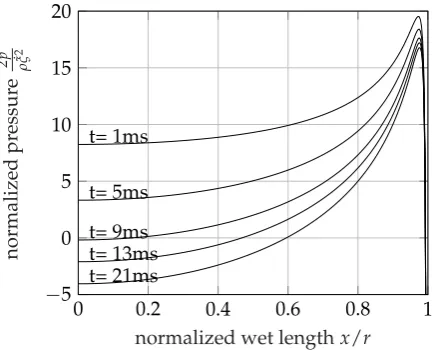
0 0.2 0.4 0.6 0.8 1
−5 0 5 10 15 20
t= 1ms
t= 5ms
t= 9ms t= 13ms t= 21ms
normalized wet lengthx/r
normalized
pr
essur
e
2
p
ρ
˙ξ
2
Figure 2.Wagner’s predicted normalized pressure as a function of the normalized wet lengthx/rat several instants. Solution calculated for a wedge weighting 5kg/m, 20◦deadrise angle, and entering the water at 2m/s with pure vertical velocity.
Figure2shows an example Wagner’s pressure distribution prediction at several impact times.
The location of the peak pressure is constant and the minimum pressure is always located at the keel
of the wedge (x=0), and equals
pkeel= 1 2ρξ˙
2
πcot(β) +ξρ¨ r (3)
We can therefore express the cavitation onset condition in terms of the dynamics components as
˙
ξ2+ξξ¨ <(pv−pa)2 tan(β)
πρ (4)
beingpathe atmospheric pressure andpvthe vapour pressure. Using equation (1), the left hand side
of the formula can be written in terms ofξonly and equals
4tan
4βM2V
02 −π ρ γ2ξ2+2Mtan2β
Version October 18, 2018 submitted toJ. Mar. Sci. Eng. 4 of 15
showing a minimum at the entry depthξ∗=4
√
πρMtan(β)
π2ρ which, substituted in eq.4, predicts that
the minimum pressure at the keel is
˙
ξ2+ξξ¨
ξ∗
=− 1
27V
2
0 (6)
It is noticeable that the penetration depthξ∗ might not be reached during the impact due to
insufficient initial entry velocity. Wagner’s solution thus predicts that cavitation during the water entry of a rigid wedge occurs if
− 1
27V
2
0 <(pv−pa)
tan(β)
π
2ρ
(7)
Notably,ξ∗is independent from the impact velocity but is function of the geometrical data only.
66
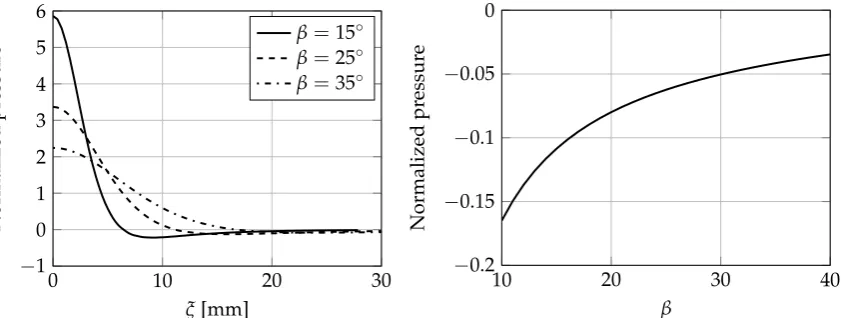
Figure3(left) shows the normalized pressures versus the entry depth for various deadrise angles.
0 10 20 30
−1 0 1 2 3 4 5 6 ξ[mm] Normalized pr essur
e β=15
◦
β=25◦
β=35◦
10 20 30 40
−0.2 −0.15 −0.1 −0.05 0 β Normalized pr essur e
Figure 3.Left: Normalized pressure versus entry depth for varying deadrise angles. Right: Normalized minimum pressure versus deadrise angle.
67
If we concentrate on the minimum value of the normalized pressure we see that this increases 68
with the deadrise angle, as displayed in figure3(right). Here, only deadrise angles higher than 10◦are
69
shown, as lower values are known to lead to the so–called air trapping phenomenon [4], that is, some 70
air is entrapped in between the structure and the fluid during the water entry to form an air cushion, 71
decreasing the impact load and inhibiting cavitation. 72
3. Preliminary experimental evidences 73
The analytical solution presented in the previous section shows that cavitation (intended in 74
its original meaning) do might appear during the water entry of rigid bodies. However, such 75
occurrence is extremely difficult to be attained as to reach pressures lower than the vapour pressure 76
we need the combination of very high velocity and extremely lightweight bodies. Similar results 77
were considerations are found in [28] for different body shapes. Further, all these solutions are 2D 78
approximations and do not take into account for the effects at the front and rear faces of the wedge 79
(but are indeed valid for axial-symmetric bodies). We will now discuss such issue by referring to the 80
keel edge only, being the location where the minimum pressure is attained. The keel is always wet, 81
being the first portion of the wedge touching the water. However, as the wedge enter the water, it 82
digs a hole on it, pushing the water sideways. The front and back sides of the wedge actually remain 83
dry and always "see" the atmospheric pressure. The hole in the water will eventually collapse, but 84
it takes a time way longer than the impact duration. Therefore, the pressure at the keel varies from 85
the theoretical one at its mid-span to the atmospheric one at its vertexes. As the pressure at keel goes 86
below the gage pressure, its effect is forcing some air to enter from the sides, forming a cavity beneath 87
We performed some experiments on rigid wedges on this sense. In our experience such occurrence 89
never happened in free-fall impacts, but was indeed found when the deceleration of the wedge was 90
imparted mechanically through a pneumatic actuator, or by a mechanic end-run forcing the wedge 91
to suddenly decelerate. Such results are thus to be considered artificial and are not presented here. 92
We therefore never encountered cavity formation in free fall water entry of rigid bodies, whereas we 93
indeed found it in case of free fall impacts of flexible bodies. The following sections will introduce the 94
most important results about cavity formation during the water entry of flexible wedges. 95
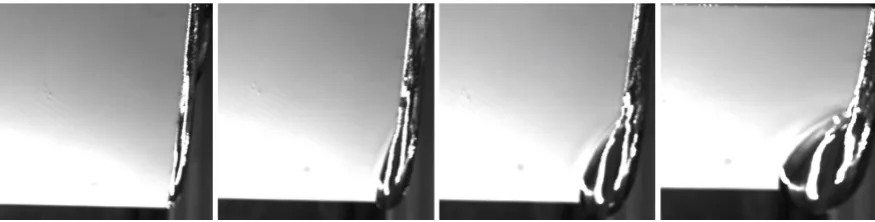
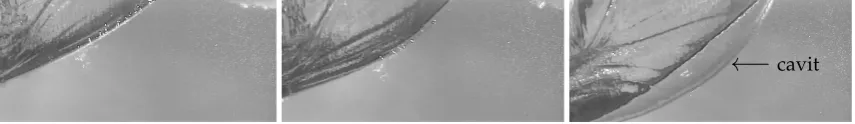
Figure 4.Details of the vertex of the keel at several time instants, presenting the evolution of the cavity formation. Images are taken from the side.
Figure4shows the evolution of a cavity formation in the neighbourhood of the vertex of the keel
96
of a wedge. The cavity formation mechanisms is equally generating on both the wedge vertexes and 97
only one of these is reported in the images for convenience. The images are presented here with the 98
sole intent of explaining the mechanism of cavity formation during water entry as these do not refer to 99
the present experimental campaign, since the experimental apparatus utilized in this work does not 100
allow to capture images from the lateral view, but from the front side only. 101
4. Experimental set-up 102
Experiments were conducted on a drop weight apparatus appositely assembled for the 103
experimental campaign. The falling body is comprised by a sledge holding two panels joined together 104
by a tunable hinge to form a v-shaped object. The deadrise angleβmay range smoothly from 0◦to
105
50◦. The hinge holds the panels in a cantilever configuration in a clamped-free boundary condition.
106
Experiments have been conducted on bodies with a sufficiently large deadrise angle (>10◦) to avoid
107
air bubbles inclusions [4]. 108
The experimental setup is the same utilized in [40]. Impact acceleration is measured by aV-Link
109
Microstrainwireless accelerometer(±100g)located at the tip of the wedge. All reported accelerations 110
are referenced to 0gfor the free-falling phase. The sampling frequency is set to its maximum of 4kHz.
111
Entering velocity is recorded by a laser sensor (µeILS 1402) capturing the sledge position over 350mm
112
of ride at a frequency of 1.5kHz with a resolution of 0.2mm. The entry velocity is obtained through 113
central difference of the position signal. 114
The dynamics of the impact is captured through a high speed camera looking trough a window 115
on the water tank. As mentioned before, only frontal views can be captured through the high speed 116
camera in the present experimental apparatus. The capturing frequency is set to 4 kHz with a definition 117
of 1280x800px. A vertical clear screen has been placed inside the water tank just before the wedge 118
preventing fluid spraying in the axial direction. The clearance between the screen and the falling body 119
is about 2mm, but it slightly vary during the water entry due to the varying fluid pressure moving and 120
deforming the screen. The use of the screen is necessary to see the evolution of the fluid jet (pileup) 121
rising on the sides of the wedge, and to prevent fluid spraying through the camera which would affect 122
6 of 15
4.1. Specimens 124
Hydroelastic effects are influenced by the ratio between the wetting time and the panel’s lower 125
natural frequency [6,41]. To vary the fundamental natural frequency of the panels, different stiffness 126
to area density ratios have been utilized: Aluminum (A), E-glass (mat) / vinylester (V), and E-Glass 127
(woven) / epoxy (W) 2mm and 4mm thick were used. All wedges are made by two panels 300mm 128
long and 250mm width. Aluminum and composite panels material properties are listed in table1.
129
Composite panels were produced by VARTM by infusion of vinylester resin on E-Glass fibre mat, 130
while the E-glass (woven 0◦/90◦) / epoxy panels were produced in autoclave. The first three dry
131
vibration frequencies of the panels are listed in table2.
132
Table 1.Material properties.
Material Abbr. E1=E2 ν12 ρ[kg/m3]
6068 T6 A 68.0 GPa 0.32 2700
E-Glass/Vinylester V 20.4 GPa 0.28 2050 E-Glass/Epoxy W 30.3 GPa 0.28 2015
All panels were equipped with two strain gauges per side, located at 25mm and 120mm from the 133
reinforced tip. The reinforced tip is 27mm long and is used to connect the two panels to the aluminum 134
sledge. 135
Table 2.First three theoretical dry natural frequencies of the panels composing the wedges.
Abbr. Material Thickness ω1[Hz] ω2[Hz] ω3[Hz]
A2 aluminum 2.0 mm 18.0 112.8 316.1
A4 aluminum 4.0 mm 36.0 225.7 632.2
V2 Fibreglass 2.0 mm 9.7 61.2 171.4
V4 Fibreglass 4.0 mm 19.7 123.6 346.2
W2 Fibreglass 2.2 mm 19.6 123.4 345.5
W4 Fibreglass 4.4 mm 37.8 236.9 663.4
A very high number of drop tests have been conducted [42], but high speed imaging has been 136
performed on selected configurations only at the end of the experimental campaign, when the camera 137
has been rented for the purpose. We here therefore report on a limited number of experiments, which 138
are considered to be sufficient to qualitatively describe the effect of cavity formation on the impact 139
dynamics. 140
5. Experimental results 141
In the following sections the results from the high speed camera are presented. A coupled 142
FEM/SPH numerical model is then utilized to gain deeper knowledge on the fluid-structure interaction 143
phenomena introduced by the structural deformation. 144
5.1. Wedges deformations during the water entry 145
In a previous research by the authors [41] it was shown that hydroelastic effects in the present 146
experiments is ruled by a parameterR, which is proportional to the ratio between the impact time and
147
the first structural natural period. Results showed that the maximum impact–induced stress decreases 148
if compared to the theoretical quasi–static solution whenRis lower than 100. Above this value the
149
structural response can be accurately predicted by a quasi–static approach. However, for values ofR
150
lower than 100 interesting Fluid-structure interaction phenomena might appear, such as ventilation 151
and cavity formation. 152
Experiments on elastic wedges with high deadrise angle entering the water at low velocity (R>100) 153
show that the panels are initially slightly deforming downwards (thus showing a convex shape), to 154
Figure 5.Deformation over time of a fibreglass/vinylester wedge with deadrise angle of 30◦entering the water at 4.2 m/s.
attributed to the effect of inertia: the hydrodynamic load acts on the wedge apex at first, leading the 156
free edge to deform downwards. As the wedge enters the water the hydrodynamic load covers a 157
larger area and the deformation due to the pressure exceeds the deformation due to inertia, leading the 158
panel to deform upwards. As an example, figure5shows the deformation in time of a flexible wedge
159
(β=30◦) entering the water at 4.2 m/s.
0 10 20 30 40
−2 000
−1 500
−1 000
−500 0 500
Time [ms]
0 10 20 30 40
−2 000
−1 500
−1 000
−500 0 500
Time [ms]
Strain
Figure 6.Signal recorded by two strain gauges during the water entry of a fiberglass/polyester wedge 4mm thick with deadrise angle of 35◦entering the water from an impact height of 1.5m (approx 5m/s). The graph on the right shows the strain measured at the center of the panel, while the graph on the left shows the strain close to the wedge tip. The full and the dashed lines represents two repetitions of the same experiment.
160
The strains at the vertex and at the middle of the panel assume a shape similar to those presented 161
in figure6, which shows the example of a fiberglass/polyester wedge 4mm thick with deadrise angle
162
of 35◦impacting from an impact height of 1.5m. Generally speaking, in all these cases the panels are
163
8 of 15
strain (hence the stress) is way lower than the maximum negative strain reached later, revealing that in 165
case of "soft" impact the influence of plates inertia is negligible. 166
Figure 7.Deformation over time of a fibreglass/vinylester wedge 2mm thick with deadrise angle of 20◦entering the water at 6.7 m/s.
0 10 20 30 40
−2 000
0 2 000
Time [ms]
0 10 20 30 40
−2 000
0 2 000
Time [ms]
Strain
Figure 8.Signal acquired by two strain gauges during the water entry. The graph on the right shows the strain measured at the center of the panel, while the graph on the left shows the strain close to the wedge tip. Full and dashed lines are two repetitions of the same experiment.
Conversely, moving to a stronger impact (R<100, by lowering deadrise angle and panel stiffness, 167
and increasing the impact velocity), the dynamic response shows very different results. Figure7
168
shows the deformation in time of a flexible wedge entering the water from an impact height of 2.5m. 169
Due to the flexibility of the wedge and the very severe impact load, the panel is largely deforming 170
downward at the beginning of impact. At its maximum deformation (top-right figure) the panel is 171
almost horizontal at its free edge. 172
The overall deformation of the panels can be better caught by looking at the recordings of the 173
strain gauges, reported in figure8. The two graphs show that the strain acquired by the gauge close to
174
the wedge tip (left graph) is always negative, indicating a local convex deformation, while the strain 175
gauge at the middle of the panel (right graph) is initially positive (suggesting that the deformation 176
case the maximum tensile stress, which is ruled by inertia, is in the same order of magnitude of the 178
compressive stress, which is ruled by the hydrodynamic load. It is thus necessary to consider the effect 179
of inertia in the initial stages of the impact. 180
5.2. Evidences of cavity formation from the high speed images 181
It has been mentioned before that increasing the severity of the impact increases the panels 182
deformation. The high speed images captured during the impact showed that the increasing 183
deformation serves as onset for the generation of cavities within the liquid. It was found that in the 184
most severe impacts, after the maximum concave deformation is reached, a clearly visible cylindrical 185
front of cavitating fluid is formed. Figures9to12show some examples of this phenomenon. Please
186
note that the cylindrical cavity does not extend along the entire width of the wedge, but is concentrated 187
at the front and back edges only, as shown in Section3.
188
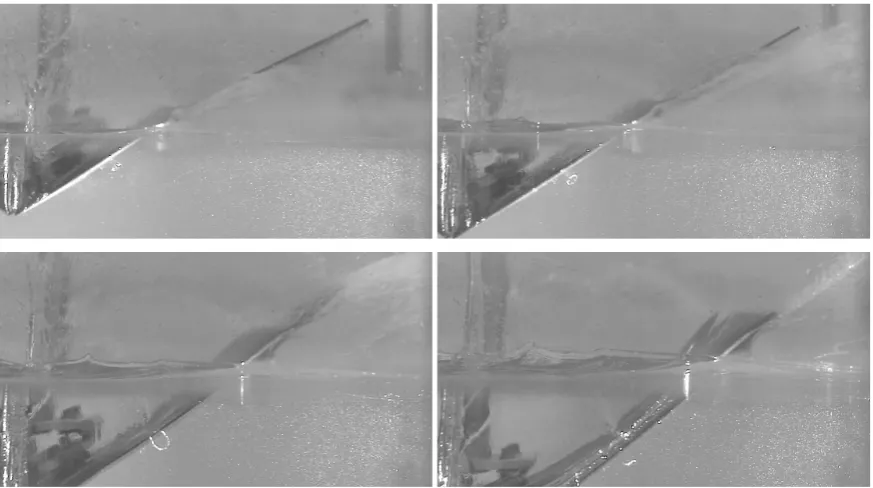
Figure 9.Evolution of the water entry of a wedge (W) (β=30◦) entering the water at≈4.2 m/s.
←−
cavit.Figure 10.Evolution of the water entry of a wedge (W) (β=15◦) entering the water at≈6.7 m/s. The arrow highlights the cylindrical front of the cavitating area.
←−
cavit.Figure 11.Evolution of the water entry of a wedge (V) (β=20◦) entering the water at≈4.3 m/s. The arrow highlights the cylindrical front of the cavitating area.
←−
cavitFigure 12.Evolution of the water entry of a wedge (V,β=20◦) entering the water at≈6 m/s. The arrow highlights the cylindrical front of the cavitating area.
Figure9is taken as reference. It shows a wedge with 30◦deadrise angle entering the water at
189
4.3m/s. In this case the deformation of the panels is very low and all the pictures show a smooth 190
and uniformly colored water region. As the severity of the impact increases it is found that a fluid 191
region with cylindrical waveform front generates in the fluid (right pictures in figures11to12). Such
10 of 15
phenomenon is always found to develop after the maximum concave deformation is attained (central 193
pictures). We comment that the cavity shape is not in line with the analytical predictions, as it does not 194
seem to originate at the keel, which is the location of minimum pressure. The cavity will eventually 195
collapse during the water entry. In the most severe impacts cases, successive pockets (with decreasing 196
amplitude) might generate and collapse. 197
Figure 13. Maximum dimension of the wavefront during the water entry of a wedge (V,β= 20◦) entering the water at 4.3, 6, and 6.7 m/s.
Figure13shows that for a given wedge (V,β=20◦) the maximum dimension of the wavefront
198
increases with the impact velocity, as so does the maximum deformation. Please note that the images 199
in figure13correspond to the same impact time. In fact, as mentioned before, the cavity formation
200
phenomena initiates after the maximum deformation of the wedge is reached; such deformation is 201
ruled by the first natural frequency of the panel, which is not influenced by the entry velocity. 202
It was previously shown that the cavity cross-sectional area increases with the impact velocity 203
and structural compliance. We here give some insights on its effect on the acceleration of the body 204
during the impact.
Figure 14.Graph of the recorded acceleration of a wedge (V,β=20◦, 2 mm thick) entering the water at 5.6 m/s and high speed camera images captured at 0, 5, 15, 20, 22.5, and 25 ms.
205
Figure14shows the time traces of acceleration recorded during the water entry of a composite
206
wedge (V2) withβ=20◦entering the water at 5.6 m/s. Three repetitions of the same experiment are
shown (solid, dashed, and dotted lines). Images from the high speed camera at characteristic time 208
instants of the impact are superimposed to the graph to get a better overview of the impact dynamics. 209
Notably, the acceleration suddenly turns negative at about 20 ms from the impact (positive acceleration 210
in the plot is opposite to gravity, and free fall is referenced as 0). Such behaviour is very uncommon in 211
water entry, as it represents a body being sucked into the water. The analysis of the high speed images 212
show that acceleration starts its decreasing trend to eventually attain negative values after the cavity is 213
generated within the fluid. It was further found that acceleration turns positive as the cavity pockets 214
collapse. Results thus evidence a strong relation between cavity evolution and impact dynamics. 215
6. Analysis of the fluid motion 216
The following section focuses on the evaluation of the fluid motion during the water entry, with 217
particular interest on the instants of cavity formation. To this effort, a numerical model based on a 218
coupled FEM/SPH scheme is utilized to gain further understanding of this peculiar FSI phenomenon. 219
The numerical solution bases on a coupled FEM-SPH technique, where the body is modeled with 220
FEM elements and the fluid with the SPH particles. In-depth details about the implementation of 221
the numerical scheme utilized here can be found in previous works by the authors [40,43] and are 222
not reported here for brevity. The numerical scheme utilized herein is the same one described and 223
validated in [40,43], and is here utilized to get further insights on the cavity formation phenomenon. 224
The results presented in the following are mainly qualitative and are not intended to be a validation 225
of the numerical model, as results are actually found to be faulty as soon as cavity is formed. It will 226
be commented in the following that the numerical scheme utilized here can not capture the physics 227
beneath the cavity formation process. Notwithstanding the incapability of the numerical scheme to 228
capture this particular FSI phenomena, its results are helpful when trying understanding its onset. 229
An example of a numerical simulation is shown in figure15. Similarly to the experimental
230
observations, once the maximum concave deformation is reached (central-left image), a void with 231
cylindrical wavefront is generated within the fluid. Results show that some portions of the panels 232
with higher amplitude of vibration might have a vertical velocity component that differs (not only in 233
magnitude but also in direction) from the local velocity of the fluid. There is therefore a tendency of 234
the fluid to move away from the wedge generating a void, as shown in figure16. The images show the
235
vector-plots of the absolute velocity (left) and the vertical component only (right). Due to the structural 236
vibration, after the maximum concave deflection is reached, the central portion of the wedge assumes 237
an instantaneous upward velocity, whereby the fluid maintains its motion due to inertia. Therefore, 238
the panel and the fluid beneath assume opposite directions, facilitating the cavity formation. 239
It thus appears that the wavefront observed during experiments is introduced by a local 240
discontinuity between the wedge and the fluid vertical velocities. It is realistic to assume that this 241
region will encounter an underpressure. However, the numerical model is not really capable of 242
correctly modeling the cavity formation phenomenon. We must note that the present results highlights 243
an important limitation of the coupled FEM/SPH model utilized here. In fact, the numerical model 244
represents a 2D section of the wedge. Results from the simulation should be therefore valid only at the 245
mid-span of the wedge, where the 2D approximation holds [44]. Therein, experimental findings do not 246
show any fluid detachment from the wedge. The cavity pocket formation is instead originating only at 247
the front and back sides of the wedge, where the water can not experience underpressure as it faces 248
air. The numerical model can not efficiently treat the contact between the fluid and the structure, not 249
being able to model the correct boundary condition for the fluid, which detaches from the structure 250
instead of going under-pressure. As a result, the numerical model better describes the physics at the 251
sides of the wedge rather than at its mid-span. However, in this vision, the model is neglecting 3D 252
effects, which indeed are important in the proximity of the front and back sides [44–46]. The model 253
12 of 15
Figure 15.Numerical simulation of the water entry of an aluminium wedge 2mmthick with deadrise angle of 15◦entering the water at 4.2 m/s. Once the maximum concave deformation is reached (in the fourth image) a void with a cylindrical wavefront generates.
Figure 16.Velocities in the wedge and the fluid obtained from the numerical simulation. Absolute (left) and vertical component only (right).
7. Conclusions 255
Experimental drop-tests of flexible wedges were performed to study the Fluid-Structure 256
Interaction phenomena that generate during the water entry, with particular attention to the cavity 257
formation process and its effect on impact dynamics. It was found that when the deflection of the wedge 258
is small, no fluid-structure interaction phenomena appear and established analytical formulations for 259
rigid bodies can be used to evaluate the impact force and the hydrodynamic pressure. However, large 260
structural deformations were found to have strong effects on the fluid motion. In particular, large 261
deformations might introduce air pockets characterized by a cylindrical wavefront originating at the 262
fluid/structure interface. Such cavity is found to equally originate from the front and rear faces of 263
the structure, and their shape is not in line with the analytical predictions, as it seems not to originate 264
from the keel, where pressure is supposed to be the lowest, but along the entire wet length of the 265
structure. The cavity will eventually collapse during the water entry, and in the most severe impacts 266
cases successive pockets (with decreasing amplitude) might generate and collapse repetitively. The 267
pockets are found to increase with the impact velocity and the flexibility of the wedge. The largest 268
cavities were further found to strongly affect the impact dynamics, up to the cases where the overall 269
acceleration of the body turns negative within the timeframe between the cavity formation and its 270
collapse. 271
Numerical simulations suggest that cavity formation is ruled by a differential between structure 272
FEM/SPH numerical model utilized here, which actually suffers similar drawbacks of many other 274
coupled numerical schemes utilized in the literature, is capable to predict the onset of cavity formation. 275
However, it can not correctly predict its evolution due to a weak coupling between SPH particles and 276
FEM elements, which can not fully treat the proper boundary condition for the fluid. 277
Author Contributions: Conceptualization, Giangiacomo Minak; Data curation, Riccardo Panciroli; Funding 278
acquisition, Riccardo Panciroli and Giangiacomo Minak; Resources, Tiziano Pagliaroli; Supervision, Giangiacomo 279
Minak; Visualization, Tiziano Pagliaroli; Writing – original draft, Riccardo Panciroli; Writing – review & editing, 280
Tiziano Pagliaroli. 281
References 282
1. Qin, Z.; Batra, R.C. Local slamming impact of sandwich composite hulls.International Journal of Solids and
283
Structures2009,46, 2011–2035. doi:10.1016/j.ijsolstr.2008.04.019. 284
2. Carcaterra, A.; Ciappi, E. Prediction of the Compressible Stage Slamming Force on Rigid and Elastic 285
Systems Impacting on the Water Surface.Nonlinear Dynamics2000,21, 193–220. 286
3. Carcaterra, A.; Ciappi, E. Hydrodynamic shock of elastic structures impacting on the water: theory and 287
experiments.Journal of Sound and Vibration2004,271, 411–439. doi:10.1016/j.jsv.2003.02.005. 288
4. Panciroli, R.; Minak, G. Experimental evaluation of the air trapped during the water entry of flexible 289
structures. Acta Imeko2014,3, 63–67. 290
5. Kapsenberg, G.K. Slamming of ships: where are we now? Philosophical Transactions of the Royal Society A:
291
Mathematical, Physical and Engineering Sciences2011,369, 2892–2919. doi:10.1098/rsta.2011.0118. 292
6. Faltinsen, O.M. Hydroelastic slamming. Journal of Marine Science and Technology 2000, 5, 49–65. 293
doi:10.1007/s007730070011. 294
7. Faltinsen, O.M.; Landrini, M.; Greco, M. Slamming in marine applications. Journal of Engineering
295
Mathematics2004,48, 187–217. doi:10.1023/B:engi.0000018188.68304.ae. 296
8. Fragassa, C. Engineering Design Driven by Models and Measures: The Case of a Rigid Inflatable Boat 297
2018. doi:10.20944/PREPRINTS201810.0131.V1. 298
9. Fragassa, C.; Minak, G. Measuring Deformations in a Rigid-Hulled Inflatable Boat. Key Engineering
299
Materials2017,754, 295–298. doi:10.4028/www.scientific.net/KEM.754.295. 300
10. Seddon, C.; Moatamedi, M. Review of water entry with applications to aerospace structures. International
301
Journal of Impact Engineering2006,32, 1045–1067. doi:10.1016/j.ijimpeng.2004.09.002. 302
11. Campbell, J.C.; Vignjevic, R. Simulating structural response to water impact. International Journal of Impact
303
Engineering2012,49, 1–10. doi:10.1016/j.ijimpeng.2012.03.007. 304
12. Hughes, K.; Vignjevic, R.; Campbell, J.; De Vuyst, T.; Djordjevic, N.; Papagiannis, L. From aerospace to 305
offshore: Bridging the numerical simulation gaps–Simulation advancements for fluid structure interaction 306
problems. International Journal of Impact Engineering2013,61, 48–63. doi:10.1016/j.ijimpeng.2013.05.001. 307
13. Wagner, H. {Ü}ber Sto{ß}- und Gleitvorg{ä}nge an der Oberfl{ä}che von Fl{ü}ssigkeiten.ZAMM - Zeitschrift
308
f{ü}r Angewandte Mathematik und Mechanik1932,12, 193–215. doi:10.1002/zamm.19320120402. 309
14. Chuang, S.L. Investigation of impact of rigid and elastic bodies with water. NSRDC report no. 32481970. 310
15. Panciroli, R.; Porfiri, M. Evaluation of the pressure field on a rigid body entering a quiescent fluid through 311
particle image velocimetry.Experiments in Fluids2013,54, 1630. doi:10.1007/s00348-013-1630-3. 312
16. Korobkin, A.; Parau, E.I.; Vanden-Broeck, J.M. The mathematical challenges and modelling of 313
hydroelasticity. Philosophical transactions. Series A, Mathematical, physical, and engineering sciences2011, 314
369, 2803–2812. doi:10.1098/rsta.2011.0116. 315
17. Korobkin, A.; Guéret, R.; Malenica, Š. Hydroelastic coupling of beam finite element model 316
with Wagner theory of water impact. Journal of Fluids and Structures 2006, 22, 493–504. 317
doi:10.1016/j.jfluidstructs.2006.01.001. 318
18. Das, K.; Batra, R.C. Local water slamming impact on sandwich composite hulls. Journal of Fluids and
319
Structures2011,27, 523–551. doi:10.1016/j.jfluidstructs.2011.02.001. 320
19. Zhao, R.; Faltinsen, O.; Aarsnes, J. Water entry of Arbitrary Two-Dimensional sections with and without 321
flow separation. Twenty-First Symposium on Naval Hydrodynamics, 1997. 322
20. Scolan, Y. Hydroelastic behaviour of a conical shell impacting on a quiescent-free surface of an 323
14 of 15
21. Wu, G.X.; Sun, H.; He, Y.S. Numerical simulation and experimental study of water entry of a wedge in free 325
fall motion. Journal of Fluids and Structures2004,19, 277–289. doi:10.1016/j.jfluidstructs.2004.01.001. 326
22. Von Karman, T. The impact on seaplane floats, during landing.NACA-TN-3211929. 327
23. Backer, G.D.; Vantorre, M.; Beels, C.; Pré, J.D.; Victor, S.; Rouck, J.D.; Blommaert, C.; De Backer, G.; 328
Vantorre, M.; Beels, C.; De Pré, J.; Victor, S.; De Rouck, J.; Blommaert, C.; Van Paepegem, W. Experimental 329
investigation of water impact on axisymmetric bodies. Applied Ocean Research 2009, 31, 143–156. 330
doi:10.1016/j.apor.2009.07.003. 331
24. El Malki Alaoui, A.; Nême, A.; Tassin, A.; Jacques, N.; Alaoui, A.E.M.; Nême, A.; Tassin, A.; Jacques, N. 332
Experimental study of coefficients during vertical water entry of axisymmetric rigid shapes at constant 333
speeds. Applied Ocean Research2012,37, 183–197. doi:10.1016/j.apor.2012.05.007. 334
25. Chuang, S.L.; Milne, D.T. Drop tests of cone to investigate the three-dimensional effect of slamming.NRDC
335
report no. 35431971. 336
26. Korobkin, A. Cavitation in liquid impact problems. Fifth International Symposium on Cavitation ( 337
CAV2003 ); , 2003; Vol. 2, pp. 1–7. 338
27. Faltinsen, O.M. The effect of hydroelasticity on ship slamming.Philosophical Transactions of the Royal Society
339
A: Mathematical, Physical and Engineering Sciences1997,355, 575–591. doi:10.1098/rsta.1997.0026. 340
28. Reinhard, M.; Korobkin, a.a.; Cooker, M.J. Cavity formation on the surface of a body entering water with 341
deceleration. Journal of Engineering Mathematics2015. doi:10.1007/s10665-015-9788-8. 342
29. Bivin, Y.K.; Glukhov, Y.M.; Permyakov, Y.V. Vertical entry of solids into water. Fluid Dynamics1986, 343
20, 835–841. doi:10.1007/BF01049923. 344
30. Yadong, W.; Xulong, Y.; Yuwen, Z. Natural Cavitation in High Speed Water Entry Process. Proceedings of 345
the 1st International Conference on Mechanical Engineering and Material Science; Atlantis Press: Paris, 346
France, 2012; Number Mems, pp. 46–49. doi:10.2991/mems.2012.18. 347
31. Korobkin, A.A.; Khabakhpasheva, T.I.; Wu, G.X. Coupled hydrodynamic and structural analysis 348
of compressible jet impact onto elastic panels. Journal of Fluids and Structures2008, 24, 1021–1041. 349
doi:10.1016/j.jfluidstructs.2008.03.002. 350
32. Korobkin, A.; Ellis, A.S.; Smith, F.T. Trapping of air in impact between a body and shallow water. Journal
351
of Fluid Mechanics2008,611, 365–394. doi:10.1017/S0022112008002899. 352
33. Hicks, P.D.; Ermanyuk, E.V.; Gavrilov, N.V.; Purvis, R.; Mechanics, F. Air trapping at impact of a rigid 353
sphere onto a liquid. Journal of Fluid Mechanics2012,695, 310–320. doi:dx.doi.org/10.1017/jfm.2012.20. 354
34. Cuomo, G.; Piscopia, R.; Allsop, W. Evaluation of wave impact loads on caisson breakwaters 355
based on joint probability of impact maxima and rise times. Coastal Engineering 2011, 58, 9–27. 356
doi:10.1016/j.coastaleng.2010.08.003. 357
35. Panciroli, R.; Porfiri, M. Hydroelastic impact of piezoelectric structures. International Journal of Impact
358
Engineering2014,66, 18–27. doi:10.1016/j.ijimpeng.2013.12.007. 359
36. Jalalisendi, M.; Porfiri, M. Water entry of compliant slender bodies: Theory and experiments.International
360
Journal of Mechanical Sciences2017,000, 1–16. doi:10.1016/j.ijmecsci.2017.07.041. 361
37. Panciroli, R.; Porfiri, M. Analysis of hydroelastic slamming through particle image velocimetry. Journal of
362
Sound and Vibration2015,347, 63–78. doi:10.1016/j.jsv.2015.02.007. 363
38. Shams, A.; Zhao, S.; Porfiri, M. Water impact of syntactic foams. Materials 2017, 10. 364
doi:10.3390/ma10030224. 365
39. Mei, R.; Luo, L.S.; Shyy, W. An Accurate Curved Boundary Treatment in the Lattice {{}B{}}oltzmann 366
Method. Journal of Computational Physics1999,155, 307–330. 367
40. Panciroli, R.; Abrate, S.; Minak, G.; Zucchelli, A. Hydroelasticity in water-entry problems: 368
Comparison between experimental and SPH results. Composite Structures 2012, 94, 532–539. 369
doi:10.1016/j.compstruct.2011.08.016. 370
41. Panciroli, R.; Abrate, S.; Minak, G. Dynamic response of flexible wedges entering the water. Composite
371
Structures2013,99, 163–171. doi:10.1016/j.compstruct.2012.11.042. 372
42. Panciroli, R. Hydroelastic impacts of deformable wedges. PhD thesis, Alma Mater Studiorum Università 373
di Bologna, 2012. doi:10.6092/unibo/amsdottorato/4594. 374
43. Panciroli, R. Hydroelastic Impacts of Deformable Wedges. InSolid Mechanics and its Applications; Abrate, S.; 375
Castanié, B.; Rajapakse, Y.D.S., Eds.; Springer Netherlands: Dordrecht, 2013; Vol. 192,Solid Mechanics and
376
44. Jalalisendi, M.; Shams, A.; Panciroli, R.; Porfiri, M. Experimental reconstruction of three-dimensional 378
hydrodynamic loading in water entry problems through particle image velocimetry. Experiments in Fluids
379
2015,56, 1–17. doi:10.1007/s00348-015-1895-9. 380
45. Yu, P.; Ong, M.; Li, H. Effects of Added Mass and Structural Damping on Dynamic Responses of a 3D 381
Wedge Impacting on Water. Applied Sciences2018,8, 802. doi:10.3390/app8050802. 382
46. Jalalisendi, M.; Osma, S.J.; Porfiri, M. Three-dimensional water entry of a solid body: A particle image 383