Cancer Management and Research 2018:10 2757–2765
Cancer Management and Research
Dove
press
submit your manuscript | www.dovepress.com 2757
O R i g i n a l R e s e a R C h
open access to scientific and medical research
Open Access Full Text Article
high spy1 expression predicts poor prognosis
in colorectal cancer
Qin Jin1,*
gang liu2,*
luri Bao3,*
Yuzhen Ma4
huidong Qi5
Zhizhong Yun4
Yanfeng Dai2
shu Zhang1
1Department of Pathology, affiliated hospital of nantong University, nantong, People’s Republic of China; 2state Key laboratory of Reproductive Regulation and Breeding of grassland livestock, College of life science, inner Mongolia University, hohhot, People’s Republic of China; 3Department of Pathology, inner Mongolia Medical University, hohhot, People’s Republic of China; 4Centre of Reproductive Medicine, inner Mongolia hospital, hohhot, People’s Republic of China; 5Medical school of nantong University, nantong, People’s Republic of China
*These authors contributed equally to this work
Background: Spy1 (SPDYA) is a new discovered cell cycle protein capable of promoting cell
proliferation dependent on cyclin-dependent kinase-2 activation. However, to the best of our knowledge, the expression of Spy1 in colorectal cancer (CRC) tissues remains virtually unknown. Materials and methods: In this retrospective study, we investigated the mRNA and protein
expression levels of Spy1 in CRC tissues and corresponding non-cancerous tissues with the analyses of quantitative real-time polymerase chain reaction, western blotting, and immuno-histochemistry. In our research, the prognostic significances of Spy1 expression were further explored by univariate and multivariate survival analyses of 203 patients who were followed up. Results: The results demonstrated that the levels of Spy1 mRNA were significantly higher in
CRC tissues compared with corresponding non-cancerous tissues (p=0.0002). The results of immunohistochemistry demonstrated that the expressions of Spy1 were significantly associ-ated with clinicopathological parameters, including T stage (c2=7.126, p=0.028) and TNM
stage (c2=9.461, p=0.009). Kaplan-Meier analysis results indicated that high Spy1 expression
(HR=2.573, p<0.001) and TNM stage (HR=1.494, p=0.011) were independent factors to predict poor prognosis for patients with CRC.
Conclusion: We concluded that high Spy1 expression is significantly associated with
unfavor-able prognosis in CRC and could serve as a potential prognostic marker in clinical diagnosis of CRC.
Keywords: Spy1, colorectal cancer, prognostic marker, clinical diagnosis
Introduction
Colorectal cancer (CRC) is the third most common cancer worldwide, and is also associated with the second highest malignancy mortality worldwide. In 2014, there were projected to be 136,830 individuals newly diagnosed with CRC and 50,310 CRC deaths in the United States, with over 2.4 million new cases expected to be diagnosed worldwide by 2035.1,2 The incidence of CRC is increasing each year, with decreasing
age of CRC patients. Therefore, CRC has become a major public health issue. The fecal occult blood test (FOBT)3 and serum diagnostic biomarkers such as
carcinoembryonic antigen4 and carbohydrate antigen 19-95 are used for CRC diagnosis
in clinics, but the accuracies of the FOBT and these biomarkers remain unsatisfactory and require improvement.6 Alternatively, colonoscopy could significantly improve the
diagnosis of CRC.7 However, this diagnostic method has shortcomings, such as cost,
risk, and inconvenience.8 CT colonography is highly sensitive for CRC detections in
clinical, but there is still some limitations such as heterogeneous sensitivity.9
There-fore, it is vital to discover new CRC biomarkers with high specificity and sensitivity.
Correspondence: gang liu
state Key laboratory of Reproductive Regulation and Breeding of grassland livestock, College of life science, inner Mongolia University, 235 West Univ. Road, hohhot, inner Mongolia 010021, People’s Republic of China
Tel +86 471 499 2944 email liugang@life.imu.edu.cn shu Zhang
Department of Pathology, Affiliated hospital of nantong University, 20 Xisi Road, nantong 226001, Jiangsu, People’s Republic of China
Tel +86 513 8505 2222) email tzyfzs@163.com
Journal name: Cancer Management and Research Article Designation: Original Research Year: 2018
Volume: 10
Running head verso: Jin et al
Running head recto: High Spy1 expression predicts poor prognosis in colorectal cancer DOI: http://dx.doi.org/10.2147/CMAR.S169329
Cancer Management and Research downloaded from https://www.dovepress.com/ by 118.70.13.36 on 20-Aug-2020
For personal use only.
Dovepress
Jin et al
Cell cycle progression is regulated by sequential activa-tion and inactivaactiva-tion of a series of cyclin-dependent kinases (CDKs).10 Spy1 (speedy/RINGO cell cycle regulator family
member A; also known as SPDYA) is a member of the Speedy/ Ringo families of cell cycle regulators, which control cell proliferation and survival through the atypical activations of CDKs.11 The expression of Spy1 enhances CDK2-dependent
p27kip1 degradation during late G1 phase and throughout S phase
by directly promoting p27 degradation.12 Furthermore, Spy1 has
been shown to override DNA damage response,13 functions to
inhibit DNA damage-induced apoptosis, and promote mamma-lian cell survival in response to a number of genotoxic agents, including hydroxyurea, cisplatin, and camptothecin.14 Spy1
expression has been associated with breast cancer,15,16 ovarian
cancer,17 hepatocellular carcinoma,18 and multiple myeloma.19
However, to the best of our knowledge, the expression of Spy1 in CRC remains virtually unknown. Therefore, in the present study, we compared the expression of Spy1 protein in CRC tissues and adjacent tissues (as corresponding non-cancerous tissues) using quantitative real-time polymerase chain reaction (qRT-PCR), immunohistochemistry, and western blot analysis. We also investigated its associations with clinical and pathologic factors, as well as the prognostic implications.
Materials and methods
Patients
In total, 40 pairs of fresh CRC tissues and adjacent tis-sues were collected from the Department of Pathology, Affiliated Hospital of Nantong University. Simultane-ously, a total of 203 paraffin-embedded CRC tissues and 203 matched adjacent tissues were collected from the Department of Pathology, Affiliated Hospital of Nantong University between January 2009 and June 2011. Diagnoses of CRC were validated by two independent pathologists in the department, according to the International Union Against Cancer and the TNM Classification of Malignant Tumors 7th edition. None of the included patients received radiotherapy or chemotherapy before surgery. Each patient signed written informed consent for this present study. All cases had corresponding clinical data and follow-up records. The follow-up rate was 100%. The study protocol was approved by the Ethics Committee of the Affiliated Hospital of Nantong University, and all experiments were performed in accordance with approved guidelines of the Affiliated Hospital of Nantong University.
qRT-PCR analyses
In total, 30 pairs of the collected fresh CRC tissues and adjacent tissues were used for qRT-PCR analysis.
Total RNA was extracted from tissues with TrizolTM
(79306, Gibco, Shanghai, People’s Republic of China), and cDNA was synthesized using commercial kits (Prime ScriptTM RT reagent Kit with gDNA Eraser, RR047A;
TaKaRa, Beijing, People’s Republic of China). Amplifica-tions were performed in an ABI Verti 96 well thermal cycler or a Thermo Pikoreal using commercial kits (Premix Taq™; TaKaRa) and specific synthesized primers. The ubiquitously expressed b-actin gene was used as an internal control. The integrity of all the DNA fragments amplified by PCRs was confirmed by sequencing. All experiments were performed in triplicate.
The primers for Spy1 were as follows: forward primer 5’-ATT GGG AAA CCA AAA TGA GGC-3’ and reverse primer 5’-TCC TGG TAT GCT CAC TTA TAG-3’. b-actin was used as an internal control, and the primers for b-actin were as follows: forward primer 5’-TAA TCT TCG CCT TAA TAC TT-3’ and reverse primer 5’-AGC CTT CAT ACA TCT CAA-3’. The relative Spy1 mRNA expression was calculated using the 2−ΔΔCt method.
antibodies and western blotting
Quantified protein lysates from 40 pairs of fresh CRC tissues and adjacent tissues were measured with a Protein BCA assay kit (163-2086; Bio-Rad Laboratories Inc., Hercules, CA, USA) according to manufacturer’s instructions. The proteins in lysates were resolved on SDS-PAGE gels (P1200; Solarbio, Beijing, People’s Republic of China), transferred onto polyvinylidene fluoride membranes (IPVH00010; EMD Millipore, Billerica, MA, USA), and immunoblotted with anti-human antibodies to GAPDH (ab8245; Abcam, Shanghai, People’s Republic of China) and Spy1 (ab153965; Abcam). The blots were visual-ized with enhanced chemiluminescence (Amersham Biosci-ences, Shanghai, People’s Republic of China) after exposure to X-ray films. GAPDH was stained as a loading control.
immunohistochemistry analysis
A total of 203 CRC and adjacent tissue paraffin sections were deparaffinized with xylene and rehydrated in graded ethanol (100-95-85-75%), and then washed with phosphate-buffered saline solution (PBS, 0.01 M, pH 7.0). Antigen retrieval was achieved by boiling under pressure in citrate buffer (0.01 M, pH 6.0). Non-specific binding was blocked through incuba-tion with 5% goat blocking serum (SL039; Solarbio) in PBS for 30 min at 37°C. All paraffin sections were incubated with rabbit anti-Spy1 antibody (1:300, ab153965; Abcam) and subsequently with goat rabbit HRP secondary anti-body (ZDR-5306; ZSGB-BIO, Beijing, People’s Republic of China). For a color reaction, sections were incubated with the
Cancer Management and Research downloaded from https://www.dovepress.com/ by 118.70.13.36 on 20-Aug-2020
Dovepress high spy1 expression predicts poor prognosis in colorectal cancer
DAB substrate chromogen solution (DA1010; Solarbio) for 8 minutes. Subsequently, sections were counterstained with hematoxylin.
Immunostained sections were scored by two independent pathologists under blinded experimental conditions accord-ing to intensity and percentage of Spy1-positive cells under light microscope (Axio imager A2; Zeiss, Shanghai, People’s Republic of China). The intensity of Spy1-positive cells was scored as follows: 0 (0%, negative), 1 (1%–33%, poor), 2 (34%–66%, moderate), and 3 (≥67%, strong).20 The
multipli-cation of the intensity and percentage scores led to the final Spy1 staining score and was defined as follows: staining score less than 3 was considered as low expression, while staining score of 4 or more was considered as high expression.
Comparison of spy1 genes expression
level in different cancers
The GEPIA (http://gepia.cancer-pku.cn/index.html) is a newly developed interactive web server for analyzing the RNA sequencing expression data of 9,736 tumors and 8,587 normal samples from the TCGA and the GTE projects using a standard processing pipeline.21 It provides customizable functions such as
tumor and normal differential expression analysis, and we could demonstrate the Spy1 gene expression levels in different cancers such as adrenocortical carcinoma (ACC), kidney renal clear cell carcinoma (KIRC) and colon adenocarcinoma (COAD).
statistical analysis
The expression levels of Spy1 mRNA in fresh CRC tissues and adjacent tissues were calculated by the Wilcoxon signed-rank nonparametric test. We used Pearson’s c2 to examine
the correlations between Spy1 protein expression and clini-copathological parameters. Kaplan-Meier and log-rank test were performed to calculate the survival curves. Factors of prognostic significance in the univariate analysis were further analyzed by the model of multivariate Cox regression. For all tests, p-values less than 0.05 were considered significant. All statistical data were analyzed by the Statistical Package for the Social Sciences software (SPSS, IBM, version 19.0). All data are represented as mean±SEM.
Results
spy1 mRna expression in CRC tissues
by qRT-PCR analysis and western blotting
The mRNA expression levels of Spy1 were detected by qRT-PCR analyses of 30 pairs of CRC tissues and their cor-responding adjacent tissues. Compared with the transcript levels in adjacent tissues, the transcript levels of Spy1 were
significantly higher in CRC tissues (0.8157±0.1289 vs 0.6993±0.1149, 1.95-fold, p=0.0002, with Wilcoxon signed-rank nonparametric test) (Figure 1).
The expression of Spy1 protein in the CRC tissues and adjacent tissues was confirmed by western blot analysis. The representative results are shown in Figure 2. There were 27 cases (90%) of CRC tissues with higher protein level of Spy1 and two cases (6.67%) of CRC tissues with similar expression level of Spy1 protein, compared with the adjacent tissues. There was one case (3.33%) of CRC tissue with lower protein level of Spy1 than that of adjacent tissue. The results indicated that the expressions of Spy1 protein in CRC tissues were significantly higher than those in adjacent tissues.
The location and expression of
spy1 protein in CRC tissues by
immunohistochemistry
The immunohistochemistry analyses were performed to determine the protein location and expression of Spy1 in CRC
1.00
Spy1
mRNA expression levels relative to
b
-acti
n
0.90
0.80
0.70
0.60
0.50
Adjacent tissues Tumor tissues
Figure 1 Quantitative real-time polymerase chain reaction (qRT-PCR) analysis was used to detect Spy1 mRna expression levels in colorectal cancer (CRC) tissues and the adjacent tissues.
Note: The Spy1 mRNA levels in CRC tissues were significantly higher than those
in the adjacent tissues.
Figure 2 The representative spy1 expression levels in colorectal cancer (CRC) tissues were detected by western blot assay and compared with adjacent tissues.
Note: The Spy1 levels in CRC tissue were significantly overexpressed compared to
those in the adjacent tissues, and gaPDh was used as a loading control.
Abbreviations: a, adjacent tissues; C, cancer tissues.
Patient 1
Spy1
GAPDH
A C A C
A C A C
Patient 2 Patient 3 Patient 4
Cancer Management and Research downloaded from https://www.dovepress.com/ by 118.70.13.36 on 20-Aug-2020
Dovepress
Jin et al
tissues and adjacent tissues. As shown in Figure 3, the location of Spy1 expression was mainly detected in the cell nucleus of of CRC tissues. High Spy1 expression level was detected in 61.08% (124/203) of CRC tissues, which was significantly higher (c2=19.951, p<0.05) than that in adjacent tissues (38.92%
[79/203]).
Correlations between spy1 protein
expression and clinicopathological
attributes of CRC patients
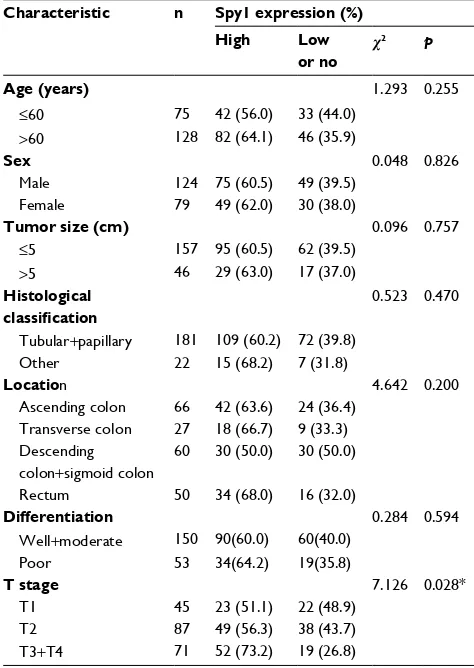
The correlations between Spy1 protein levels and clinico-pathological attributes of CRC patients were investigated (Table 1). Higher expressions of Spy1 were significantly associated with T stage (c2=7.126, p=0.028) and TNM stage
(c2=9.461, p=0.009). However, Spy1 protein expressions in
CRC were not significantly associated with age, sex, tumor size, histological type, location, and differentiation (Table 1).
high spy1 protein expression predicts
poor prognosis of CRC patients
Subsequently, univariate analyses were conducted to evaluate Spy1 protein expressions and clinicopathological factors on prognosis of CRC patients. The result showed that the high expression level of Spy1 (HR=2.846, p<0.001), T stage (HR=1.335, p=0.026), and TNM stage (HR=1.609, p=0.003) were significantly associated with poor overall survival
Figure 3 The representative images of the spy1 protein location and expression in colorectal cancer (CRC).
Notes: (A) no immunohistochemistry (ihC) staining of spy1 in the cell nucleus of normal intestinal mucosa. (B) ihC staining of spy1 in the nuclear of normal intestinal mucosa. (C) no ihC staining of spy1 in the nuclear of CRC cells. (D) Moderate ihC staining of spy1 in the nuclear of CRC cells. (E) high ihC staining of spy1 in the nuclear
of CRC cells. Original magnification, ×400 in a–e.
A B
C D E
Table 1 association of spy1 expression with clinical
characteristics and selected biological markers of CRC
Characteristic n Spy1 expression (%)
High Low
or no
c2 p
Age (years) 1.293 0.255
≤60 75 42 (56.0) 33 (44.0)
>60 128 82 (64.1) 46 (35.9)
Sex 0.048 0.826
Male 124 75 (60.5) 49 (39.5)
Female 79 49 (62.0) 30 (38.0)
Tumor size (cm) 0.096 0.757
≤5 157 95 (60.5) 62 (39.5)
>5 46 29 (63.0) 17 (37.0)
Histological classification
0.523 0.470
Tubular+papillary 181 109 (60.2) 72 (39.8)
Other 22 15 (68.2) 7 (31.8)
Location 4.642 0.200
ascending colon 66 42 (63.6) 24 (36.4) Transverse colon 27 18 (66.7) 9 (33.3) Descending
colon+sigmoid colon
60 30 (50.0) 30 (50.0)
Rectum 50 34 (68.0) 16 (32.0)
Differentiation 0.284 0.594
Well+moderate 150 90(60.0) 60(40.0)
Poor 53 34(64.2) 19(35.8)
T stage 7.126 0.028*
T1 45 23 (51.1) 22 (48.9)
T2 87 49 (56.3) 38 (43.7)
T3+T4 71 52 (73.2) 19 (26.8)
(Continued)
Cancer Management and Research downloaded from https://www.dovepress.com/ by 118.70.13.36 on 20-Aug-2020
Dovepress high spy1 expression predicts poor prognosis in colorectal cancer
of CRC patients (Table 2). These prognostic factors were further evaluated by multivariate Cox proportional hazards regression model analysis. With the Kaplan-Meier analysis, high Spy1 expression (HR=2.573, p<0.001) and TNM stage (HR=1.494, p=0.011) were found to be independent prog-nostic markers of poor 5-year overall survival (Table 2). CRC patients with high expression of Spy1 protein had sig-nificantly shorter overall survival compared with those with low or no Spy1 expression (Figure 4). CRC patients with TNM stage III+IV had significantly shorter overall survival compared with those with stage I and stage II (Figure 4).
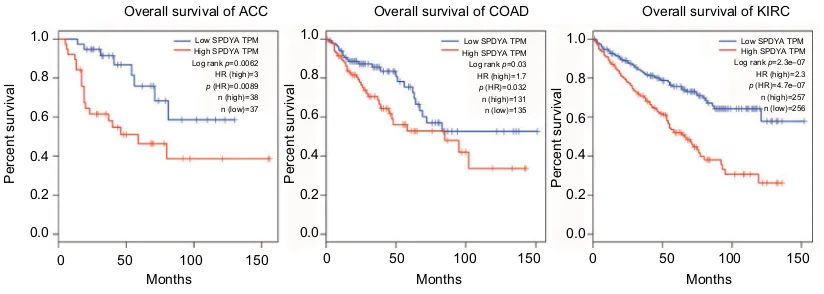
survival analysis of target genes
High expressions of Spy1 confer survival disadvantages to ACC patients (log rank p=0.0062, HR [high]=3), COAD patients (log rank p=0.03, HR [high]=1.7) and KIRC patients [(log rank p=2.3e-07, HR [high]=2.3) in the GEPIA dataset with TCGA samples (Figure 5).
Discussion
CRC is the most malignant disease in developed and develop-ing countries, largely because of its propensity to metastasize. The therapeutic regimens of fluoropyrimidine chemotherapy (parenteral 5-fluorouracil/leucovorin or oral capecitabine) in combination with oxaliplatin (FOLFOX or XELOX) or irinotecan (FOLFIRI) and bevacizumab (Avastin; Genentech, Inc., South San Francisco, CA, USA) have improved overall survival of CRC.22 Furthermore, targeted treatments like
anti-VEGF, anti VEGFR, or anti-EGFR depending on the all-RAS status23,24 and anti-PDL-1 (pembrolizumab)
accord-ing to the microsatellite instability (MSI) status and PDL-1 expression25,26 have been used for clinical trials. However, the
therapeutic responses vary individually. Additional genetic targeted therapies for CRC still need exploration.27
Tumor cells accumulate alterations that result in con-stitutive mitogenic signaling and defective responses to anti-mitogenic signals that contribute to unscheduled
Characteristic n Spy1 expression (%)
High Low
or no c
2 p
N stage 5.334 0.069
n0 122 78 (63.9) 44 (36.1)
n1 56 36 (64.3) 20 (35.7)
n2 25 10 (40.0) 15 (60.0)
TNM stage 9.461 0.009*
i 24 10 (41.7) 14 (58.3)
ii 53 27 (50.9) 26 (49.1)
iii+iV 136 87 (69.0) 39 (31.0)
Note: *p<0.05.
Abbreviation: CRC, colorectal cancer.
Table 1 (Continued)
Table 2 Univariate and multivariate analysis of prognostic factors in CRC for 5-year overall survival
Univariate analysis Multivariate analysis
HR p-value 95% CI HR p-value 95% CI
Expression of Spy1
high vs low or no expression 2.846 <0.001* 1.828–4.429 2.573 <0.001* 1.647–4.019
Age (years)
≤60 vs >60 1.031 0.879 0.696–1.527
Sex
Male vs female 0.874 0.501 0.592–1.292
Tumor size (cm)
≤5 vs >5 1.133 0.584 0.724–1.772
Histological classification
Tubular+papillary vs other 0.897 0.732 0.481–1.673
Location
ascending colon vs transverse colon vs descending colon + sigmoid colon
0.873 0.103 0.742–1.028
Differentiation
Well+moderate vs poor 0.765 0.168 0.522–1.120
T stage 1.266 0.075 0.977–1.641
T1 vs T2 vs T3+T4 1.335 0.026* 1.034–1.723
N stage
n0 vs n1 vs n2 1.203 0.201 0.906–1.597
TNM stage
i vs ii vs iii+iV 1.609 0.003* 1.178–2.197 1.494 0.011* 1.096–2.037
Note: *p<0.05.
Abbreviation: CRC, colorectal cancer.
Cancer Management and Research downloaded from https://www.dovepress.com/ by 118.70.13.36 on 20-Aug-2020
Dovepress
Jin et al
Figure 4 The survival analysis of colorectal cancer (CRC) patients by Kaplan-Meier analysis.
Notes: Overall survival rates in CRC patients with high expression level of spy1 (green line) were statistically lower than those in CRC patients with low or no spy1 expression (blue line). Overall survival rates in CRC patients with high expression levels of TnM stage iii+iV (yellow line) were statistically lower than those in CRC patients with TnM stage i (blue line) and ii (green line).
1.0
Survival function
Survival function
Spy1 expression Low or no expression High expression
Low or no expression-censored
High expression-censored
Cumulative surviva
l
Cumulative surviva
l
0.8
0.6
0.4
Log rank Chi-square=23.830, p<0.001
Log rank Chi-square=9.478, p=0.009 Month
Month
TNM I II III+IV
I-censored II-censored III+IV-censored
0 20 40 60
0 20 40 60
0.2
0.0
1.0
0.8
0.6
0.4
0.2
0.0
Cancer Management and Research downloaded from https://www.dovepress.com/ by 118.70.13.36 on 20-Aug-2020
Dovepress high spy1 expression predicts poor prognosis in colorectal cancer
proliferation. These mutations, taken together, result not only in proliferative advantages but also in increased susceptibil-ity to the accumulation of additional genetic alterations that contribute to tumor progression and acquisition of more aggressive phenotypes.
In addition, most tumors acquire genomic instability (GIN) that leads to additional mutations. The acquisition of GIN is a crucial feature in tumor development, and there are at least three distinct pathways in CRC: the CIN, MSI, and CpG island methylator phenotype pathways.28,29 Most
cases of CRC arise through the CIN pathway by widespread imbalances in chromosome number (aneuploidy) and loss of heterozygosity due to the defects in chromosomal segrega-tion, telomere stability, and the DNA damage response.
The basic cell cycle defects such as GIN or CIN are mediated, directly or indirectly, by misregulations of CDKs. During the past two decades, a vast body of literature has illustrated the relevance of cell cycle deregulation in human cancer, and targeting the cell cycle in general and CDK in particular presents unique opportunities for drug discovery.30
Firstly, isolated in Xenopus, Xenopus-Spy1 could induce rapid meiotic maturation and premature activation of CDKs.15,31
Subsequently, Spy1 was found to be expressed in a variety of human tissues, and its overexpression enhances G1-S phase progression, p27kip degradation,12 and cellular proliferation
by activating CDK2.32,33 Spy1 is also required for cell-cycle
re-entry in maturing vertebrate oocytes.34 There are multiple
isoforms of Spy1 that are now classified into a larger family of proteins, known as the Spy1/RINGO family. Furthermore, abrogation of Spy1 expression through the use of siRNA hinders cell proliferation, thus demonstrating that Spy1 is an essential
component of cell proliferation pathways.18 These findings open
up new possibilities that this gene may be involved in human cell cycle disorders such as oncogenesis.35 To date, no study has
been performed for Spy1 expression using the group of CRC specimens, and the present study is the first to analyze the Spy1 expression in CRC, with respect to possible associations with clinicopathological data as well as patients’ poor prognosis.
In this study, the expression levels of Spy1 in CRC tissues, with adjacent tissues, were detected with the observation that both Spy1 mRNA and protein levels were significantly higher in CRC tissues than those in the adjacent tissues. High Spy1 protein level was associated with poor overall survival for CRC patients, which indicated that Spy1 protein level may be used as an independent clinical marker in predicting unfavorable prognosis.
GEPIA is an interactive web application for gene expres-sion analysis based on 9,736 tumors and 8,587 normal samples from the TCGA and the GTE databases.21 Using the
GEPIA datasets, we have revealed that Spy1 expression levels are positively correlated with the survival of ACC, COAD, and KIRC cancer patients. Combined with the expression model, we predict that Spy1 plays an important role in cancer progression and may be a candidate biomarker.
Taken together, we analyzed the Spy1 expression in CRC and demonstrated that Spy1 was involved in CRC development. The findings indicated that Spy1 may act as an oncogene during CRC development and it could be identified as a novel prognostic biomarker in CRC clinical treatment. Related studies concerning the potential mechanisms of Spy1 in CRC and other kinds of human cancers are being performed by our research group.
Figure 5 expression of spy1 in cancers.
Notes: Overall survival rates in adrenocortical carcinoma (aCC), colon adenocarcinoma (COaD) and kidney renal clear cell carcinoma (KiRC) patients with high expression levels of spy1 (red line) were statistically lower than those in patients with low and no spy1 expression (blue line).
Abbreviations: sPaDY, spy1; TPM, transcripts per kilobase of exonmodel per million mapped reads; hR, hazard ratio.
Overall survival of ACC
Months
0 50 100 150 0 50 100 150 0 50 100 150
0.0 0.2 0.4 0.6 0.8 1.0
Percent surviva
l
0.0 0.2 0.4 0.6 0.8 1.0
Low SPDYA TPM High SPDYA TPM Log rank p=0.0062 HR (high)=3
p (HR)=0.0089 n (high)=38 n (low)=37
Low SPDYA TPM High SPDYA TPM Log rank p=0.03 HR (high)=1.7
p (HR)=0.032 n (high)=131 n (low)=135
Low SPDYA TPM High SPDYA TPM Log rank p=2.3e–07 HR (high)=2.3
p (HR)=4.7e–07 n (high)=257 n (low)=256
Percent surviva
l
0.0 0.2 0.4 0.6 0.8 1.0
Percent surviva
l
Months Months
Overall survival of COAD Overall survival of KIRC
Cancer Management and Research downloaded from https://www.dovepress.com/ by 118.70.13.36 on 20-Aug-2020
Dovepress
Jin et al
Acknowledgment
This work was supported by the Inner Mongolia Science and Technology Research Project (2017ZD04 to Yanfeng Dai and 201502107 and 2017MS08137 to Yuzhen Ma).
Disclosure
The authors report no conflicts of interest in this work.
References
1. Siegel R, Desantis C, Jemal A. Colorectal cancer statistics, 2014. CA Cancer J Clin. 2014;64(2):104–117.
2. Day LW, Velayos F. Colorectal cancer screening and surveillance in the elderly: updates and controversies. Gut Liver. 2015;9(2):143–151. 3. Zavoral M, Suchanek S, Majek O, et al. Colorectal cancer screening:
20 years of development and recent progress. World J Gastroenterol. 2014;20(14):3825–3834.
4. Bajenova O, Chaika N, Tolkunova E, et al. Carcinoembryonic antigen promotes colorectal cancer progression by targeting adherens junction complexes. Exp Cell Res. 2014;324(2):115–123.
5. Wang YR, Yan JX, Wang LN. The diagnostic value of serum carcino-embryonic antigen, alpha fetoprotein and carbohydrate antigen 19-9 for colorectal cancer. J Cancer Res Ther. 2014;10 Suppl:307–309. 6. Shibutani M, Maeda K, Nagahara H, et al. Significance of CEA and
CA19-9 combination as a prognostic indicator and for recurrence monitoring in patients with stage II colorectal cancer. Anticancer Res. 2014;34(7):3753–3758.
7. Brenner H, Stock C, Hoffmeister M. Effect of screening sigmoidoscopy and screening colonoscopy on colorectal cancer incidence and mortality: systematic review and meta-analysis of randomised controlled trials and observational studies. BMJ. 2014;348:g2467.
8. Byun JY, Yoon SJ, Oh IH, Kim YA, Seo HY, Lee YH. Economic burden of colorectal cancer in Korea. J Prev Med Public Health. 2014;47(2):84–93.
9. Pickhardt PJ, Hassan C, Halligan S, Marmo R. Colorectal cancer: CT colonography and colonoscopy for detection—systematic review and meta-analysis. Radiology. 2011;259(2):393–405.
10. Lim S, Kaldis P. Cdks, cyclins and CKIs: roles beyond cell cycle regula-tion. Development. 2013;140(15):3079–3093.
11. McAndrew CW, Gastwirt RF, Donoghue DJ. The atypical CDK activator Spy1 regulates the intrinsic DNA damage response and is dependent upon p53 to inhibit apoptosis. Cell Cycle. 2009;8(1):66–75.
12. McAndrew CW, Gastwirt RF, Meyer AN, Porter LA, Donoghue DJ. Spy1 enhances phosphorylation and degradation of the cell cycle inhibitor p27. Cell Cycle. 2007;6(15):1937–1945.
13. Ferraiuolo RM, Tubman J, Sinha I, Hamm C, Porter LA. The cyclin-like protein, SPY1, regulates the ERα and ERK1/2 pathways promoting tamoxifen resistance. Oncotarget. 2017;8(14):23337–23352. 14. Barnes EA, Porter LA, Lenormand JL, Dellinger RW, Donoghue DJ.
Human Spy1 promotes survival of mammalian cells following DNA damage. Cancer Res. 2003;63(13):3701–3707.
15. Al Sorkhy M, Ferraiuolo RM, Jalili E, et al. The cyclin-like protein Spy1/RINGO promotes mammary transformation and is elevated in human breast cancer. BMC Cancer. 2012;12:45.
16. Zucchi I, Mento E, Kuznetsov VA, et al. Gene expression profiles of epi-thelial cells microscopically isolated from a breast-invasive ductal carci-noma and a nodal metastasis. Proc Natl Acad Sci U S A. 2004;101(52): 18147–18152.
17. Lu S, Liu R, Su M, et al. Spy1 participates in the proliferation and apoptosis of epithelial ovarian cancer. J Mol Histol. 2016;47(1):47–57. 18. Ke Q, Ji J, Cheng C, et al. Expression and prognostic role of Spy1 as a
novel cell cycle protein in hepatocellular carcinoma. Exp Mol Pathol. 2009;87(3):167–172.
19. Fei M, Hang Q, Hou S, Ruan C. Cell adhesion to fibronectin down-regulates the expression of Spy1 and contributes to drug resistance in multiple myeloma cells. Int J Hematol. 2013;98(4):446–455. 20. Patel SH, Kneuertz PJ, Delgado M, et al. Clinically relevant
biomark-ers to select patients for targeted inhibitor therapy after resection of hepatocellular carcinoma. Ann Surg Oncol. 2011;18(12):3384–3390. 21. Tang Z, Li C, Kang B, Gao G, Li C, Zhang Z. GEPIA: a web server for
cancer and normal gene expression profiling and interactive analyses. Nucleic Acids Res. 2017;45(W1):W98–W102.
22. Berlin J, Bendell JC, Hart LL, et al. A randomized phase II trial of vis-modegib versus placebo with FOLFOX or FOLFIRI and bevacizumab in patients with previously untreated metastatic colorectal cancer. Clin Cancer Res. 2013;19(1):258–267.
23. Wang JX, Wu HL, Zhu M, Zhou R. Role of anti-epidermal growth factor receptor therapy compared with anti-vascular endothelial growth factor therapy for metastatic colorectal cancer: an update meta-analysis of randomized clinical trials. Pathol Oncol Res. Epub 2018 Jan 30. 24. Khattak MA, Martin H, Davidson A, Phillips M. Role of first-line
anti-epidermal growth factor receptor therapy compared with anti-vascular endothelial growth factor therapy in advanced colorectal cancer: a meta-analysis of randomized clinical trials. Clin Colorectal Cancer. 2015;14(2):81–90.
25. Sehdev A, Cramer HM, Ibrahim AA, Younger AE, O’Neil BH. Patho-logical complete response with anti-PD-1 therapy in a patient with mic-rosatellite instable high, BRAF mutant metastatic colon cancer: a case report and review of literature. Discov Med. 2016;21(117):341–347. 26. Toh JWT, de Souza P, Lim SH, et al. The potential value of
immuno-therapy in colorectal cancers: review of the evidence for programmed death-1 inhibitor therapy. Clin Colorectal Cancer. 2016;15(4): 285–291.
27. Zhang J, Zhou L, Zhao S, Dicker DT, El-Deiry WS. The CDK4/6 inhibi-tor palbociclib synergizes with irinotecan to promote colorectal cancer cell death under hypoxia. Cell Cycle. 2017;16(12):1193–1200. 28. Pino MS, Chung DC. The chromosomal instability pathway in colon
cancer. Gastroenterology. 2010;138(6):2059–2072.
29. Issa JP. Colon cancer: it’s CIN or CIMP. Clin Cancer Res. 2008;14(19): 5939–5940.
30. Vermeulen K, Van Bockstaele DR, Berneman ZN. The cell cycle: a review of regulation, deregulation and therapeutic targets in cancer. Cell Prolif. 2003;36(3):131–149.
31. Karaiskou A, Perez LH, Ferby I, Ozon R, Jessus C, Nebreda AR. Dif-ferential regulation of Cdc2 and Cdk2 by RINGO and cyclins. J Biol Chem. 2001;276(38):36028–36034.
32. Porter LA, Kong-Beltran M, Donoghue DJ. Spy1 interacts with p27Kip1 to allow G1/S progression. Mol Biol Cell. 2003;14(9):3664–3674. 33. Porter LA, Dellinger RW, Tynan JA, et al. Human Speedy: a novel cell
cycle regulator that enhances proliferation through activation of Cdk2. J Cell Biol. 2002;157(3):357–366.
34. Arumugam K, MacNicol MC, Wang Y, et al. Ringo/cyclin-dependent kinase and mitogen-activated protein kinase signaling pathways regulate the activity of the cell fate determinant Musashi to promote cell cycle re-entry in Xenopus oocytes. J Biol Chem. 2012;287(13): 10639–10649.
35. Nebreda AR. CDK activation by non-cyclin proteins. Current Opinion in Cell Biology. 2006;18(2):192–198.
Cancer Management and Research downloaded from https://www.dovepress.com/ by 118.70.13.36 on 20-Aug-2020
Dovepress
Cancer Management and Research
Publish your work in this journal
Submit your manuscript here: https://www.dovepress.com/cancer-management-and-research-journal
Cancer Management and Research is an international, peer-reviewed open access journal focusing on cancer research and the optimal use of preventative and integrated treatment interventions to achieve improved outcomes, enhanced survival and quality of life for the cancer patient. The manuscript management system is completely online and includes
a very quick and fair peer-review system, which is all easy to use. Visit http://www.dovepress.com/testimonials.php to read real quotes from published authors.
Dove
press
high spy1 expression predicts poor prognosis in colorectal cancer
Cancer Management and Research downloaded from https://www.dovepress.com/ by 118.70.13.36 on 20-Aug-2020