ISSN 2286-4822
www.euacademic.org DRJI Value: 5.9 (B+)
Effect of Different Wheat Genotypes Differed by
Date of Sowing and Establishment Methods
R. ACHARYA S. MARAHATTA S.K. SAH SANDESH BHATTA Agriculture and Forestry University (AFU) SURYA DHUNGANA Institute of Agriculture and Animal Science, TU
Abstract:
A field experiment with three wheat varieties at different sowing dates on two crop establishment methods was accomplished to identify the optimum sowing date at AFU Rampur during winter season of 2014/2015. Three wheat varieties namely: Tillotama, Danfe and Vijay sown on three dates: 14th November, 29th November, and 14th December under two crop establishment practices: Conservational and conventional agriculture were evaluated with strip –split plot design in three replications. The field data on, crop growth and development, yield attributes and yields were collected. Earlier sowing on 14th November gave the highest yield (3427.15 kg ha-1), total dry matter (8154.44 kg ha-1),with longest days to crop maturation (133.11 days). In case of varieties, Vijay gave the highest grain yield (3458.61 kg ha-1) and total dry weight (4456.11 and 8832.42 kg ha-1 respectively) with earliest days to heading and maturity. The straw yield was the highest for 29th November sowing (5821 kg ha-1) and for Danfe variety (5756 kg ha-1). Vijay variety recorded the highest test weight (43.60 g) and highest harvest index (35.89%) even though with the lowest effective tillers per square meter (320.83), it proved to be the most promising variety.
1 INTRODUCTION
Wheat (Triticum aestivum L.) is one of the principal cereal crops of the world, growing in almost 215 million hectares of the land each year. It is the major staple food for the 2.5 billion people in 89 countries of the world and is the first in major three cereal crops for protein source in developing countries. The global wheat production for the year 2013 was 716 million tons which was higher by 18.35% in comparison to the year 2007(CIMMYT, 2013). China ranked the first among the wheat producers in the world with its share of 17.03% followed by India(FAO, 2013). Nearly US $50 billion-worth of wheat is traded globally each year (CIMMYT, 2013).
As wheat is the third important cereal crop after rice and maize in Nepal it plays a vital role in food security of the country. The area under wheat cultivation in Nepal is 0.7 ha and the production is 1.8 millionmetric ton with the average productivity of 2.50 metric ton per hectare for the year 2013/14. This is mere 0.03% increase in area, but 9.01% increase in production comparing to the previous year (MoAD, 2015). The productivity of the wheat is far below than the world productivity i.e. 3.33 metric ton per hectare. The area under wheat production for the Chitwan district was 10100 hectare and the production was 20700 metric ton with productivity of 2.04 metric ton per hectare for the year 2001/02. After 11 years on 2012/13, the area had decreased but the production had increased instead. The area, production and productivity for the year 2012/2013 were 8,750 hectare, 30125 metric ton and 3.44 metric ton per hectare respectively (CBS, 2013).
2001).With the increasing population and purchasing power, demand on food has also increased which is impossible to meet with the present varieties, technologies and management practices. Use of resource-conserving technologies, innovations on residue use, use of suitable agronomic practices not only increase productivity and profitability but also reduce risk due to environmental and economic factors (Chauhan et al., 2012).
Conservation agriculture (CA) defined as the minimal soil disturbance (no-till or minimum till), and permanent soil cover (mulch or residue retention) combined with diversified rotations is a more sustainable cultivation system for the future (Hobbs, Gupta & Meisner, 2006). Adoptions of conservation agriculture based technology not only reduce the cost of cultivation and increased profit but also conserve the soil moisture for late stages of crops (Thierfelder& Wall, 2009).Wheat in case of Nepal is sown after rice and it grows and survives on the residual soil moisture, late monsoon rains and winter rain. Shrestha, Raes, Vanuytrecht, &Sah(2013) simulated the rain fed yields of the wheat (1.7 t ha-1) and showed that yields were predominantly constrained by water stress. Wheat in Nepal is generally sown in November to late December and harvested in March/April (Joshi, Mishra, Charath, Ferrara & Singh, 2007). The late planting is often due to difficulty in land preparation resulting by excess or lack of moisture, late maturing rice varieties or longer window period between rice harvesting and wheat sowing. So it is necessity to identify the optimum sowing dates for different varieties.
2. MATERIALS AND METHODS
2.1 Location
temperature and the average minimum temperature for the cropping duration were 24.990C and 13.090C. The total rainfall during the cropping period was 119.70 mm. The maximum relative humidity for the cropping period was 69.24% and minimum was 17.15%.
2.2 Experimental details
The experiment was laid out in Strip-split block design with the combination of 18 treatments comprising of two crop establishment methods in horizontal factor (conservation agriculture and conventional agriculture), three dates of sowing as vertical factor (November 14, November 29 and December 14) and three varieties as subplot factors (Tillotama, Danfe and Vijay). Each treatment was replicated thrice. Each individual subplot had 25 rows with spacing of 20 cm apart and total area of 4 m x 5 m. The central 10 rows with 8m2 area (10 x 0.2 m x 4m) was treated as the net plot whereas inner 5 rows on the both sides of the plot were used for biometrical and phenological observations leaving single rows on both sides as the check boarder.
2.3 Crop management practices
2.4 Observation recorded
Phenological observations: The phenological stages, i.e.
emergence, anthesis and physiological maturity were recorded in fixed sample plants of 0.2 m2 (1.00 m × 0.20 m) area. Approximately 75% development of each of the stage was treated as completion of that particular stage and the data was expressed as days after sowing (DAS) for all treatments. The vegetative growth period was recorded as the number of days from planting to anthesis. The grain filling period was determined as the number of days from anthesis to maturity.
Total dry matter: It was carried out at 30 DAS and then after
steadily at an interval of 15 days to physiological maturity stages from the plants of the above mentioned row strip of destruction row from each plot. Dry matter deposition was determined by drying plant organs at a temperature of 700C in hot oven till constant weight.
Yield and yield attributing characters: (i) Before
Sterility percentage = –
Grain and straw yield: The net plot consisting of 10 rows
each 4m length was harvested for the record of grain yield. The net crop was dried, threshed, cleaned and sundried for 2 days to maintain moisture percentage. The yield obtained was computed for each treatment to obtain the yield per hectare. The straw yield was obtained by deducting the grain yield from total biomass yield. The grain yield from each net plot was checked for moisture percentage using moisture meter and then the grain yield from all the plots were adjusted at 12% moisture.
Grain yield (Kgha-1) at 12% moisture =( ) ( )
( ) Where MC = moisture content of the grain
Harvest index: The harvest index (HI) was obtained by
dividing the grain yield with the biological yield.
HI= (grain yield ×100)/ (grain yield +straw yield).
2.5 Statistical analysis
All the collected data were entered into MS- Excel and further subjected to analysis of variance. Genstat and MSTAT-C package were used for the data analysis. All the data analyzed were put to DMRT for mean comparison by selecting 5% level of significance.
3 RESULTS
3.1 Phenological observations
time interval between main stem leaves. Unlike events include the interval between the plant emergence and formation of flower bud, flower, or mature fruit (Reddy & Reddi, 2005). In this experiments unlike events i.e. the interval between wheat sowing and emergence, flowering and maturity stages were observed under different establishment methods, sowing dates and rice varieties.
3.1.1 Emergence
The data in the table revealed the mean days to 50% emergence was 7.65 days (Table 1). The establishment methods, sowing date and varieties all have significant effect on the emergence of the wheat seed. The emergences of the wheat seeds were found to be significantly higher in the conservational agriculture without residue than no till plots with residue application. The emergence of the seeds were significantly faster with earlier planting of November 14 than 29thNovember followed by 14thDecember date of planting. Incase of varieties, Danfe was found to have significantly lower no of day for 50% days to emergence than both of the other varieties, Tillotama and Vijay whereas they are equal with each other.
Table 1: Phenological stages (Days to 50% emergence, flowering and physiological maturity) of wheat as influenced by establishment methods, sowing dates and varieties in 2014-15 at AFU, Rampur, Chitwan, Nepal
Treatments Phenological stages
Emergence Anthesis Maturity
Establishment methods
CA 8.22b 84.51 118.52
ConA 7.07a 85.06 118.44
SEm (±) 0.14 0.07 0.25
LSD (=0.05) 0.83 0.41 ns
Sowing date
14th Nov 6.56 a 86.09b 124.11
29th Nov 7.11 b 86.45b 119.61
14th Dec 9.28 c 81.82a 111.72
SEm(±) 0.11 0.14 0.24
LSD(=0.05) 0.43 0.55 0.93
Varieties
Tillotama 8.00b 80.61b 116.06
Note: CA, Conservation agriculture; ConA, conventional agriculture; ns, non-significance. Treatments means followed by common letter (s) are not significantly different among each other based on DMRT at 5% level of significance
3.1.2 Anthesis
The mean days for the 50% days to flowering fell on 84.78thday (Table 1). The establishment methods showed no significant effect on the days to flowering. The wheat planted on 14thDecember showed earlier flowering by 5 days which was significant over early planted wheat on 14th and 29th December. Variety Vijay had significantly earlier flowering on 77.84thday followed by Tillotama (80.61 days) and Danfe (95.90 days) which were significantly late heading for each other. The interaction effect of sowing dates and varieties was significant (Table 2).
Table 2: Flowering and physiological maturity (days to 50%) of wheat as influenced by interaction between sowing dates and varieties in 2014-15 at AFU, Rampur, Chitwan, Nepal
Treatments Flowering Physiological maturity
Tillotama Danfe Vijay Tillotama Danfe Vijay 14th Nov 79.83b 101.83f 76.60a 120.67c 131.33e 120.33c 29th Nov 83.45c 95.42e 80.46 117.17b 125.00d 116.67 14th Dec 78.54ab 90.45d 76.46a 110.33a 115.17b 109.67a
SEm (±) 0.56 0.40
LSD (=0.05) 1.62 1.18
Note: Treatments means followed by common letter (s) are not significantly different among each other based on DMRT at 5% level of significance.
3.1.3 Physiological maturity
The average day to maturity was found 118.48 days and both establishment methods has similar effect on days to maturity whereas delayed in sowing of wheat significantly early maturity of the crop (Table 1). The early sown wheat on 14th
Vijay 8.00b 77.84a 115.56
SEm (±) 0.33 0.38 0.23
LSD (=0.05) 0.96 1.11 0.66
CV, % 18.10 1.90 0.80
November had significantly longer growth duration (124.11days) followed by wheat sown at November 29 and December 14 with maturation days of 119.61 and 111.72 days respectively. Variety Danfe had longest days to maturity of 123.83, significantly higher than two other varieties Tillotama and Vijay which were at par with each other. The interaction effect of sowing dates and varieties was significant (Table 2).
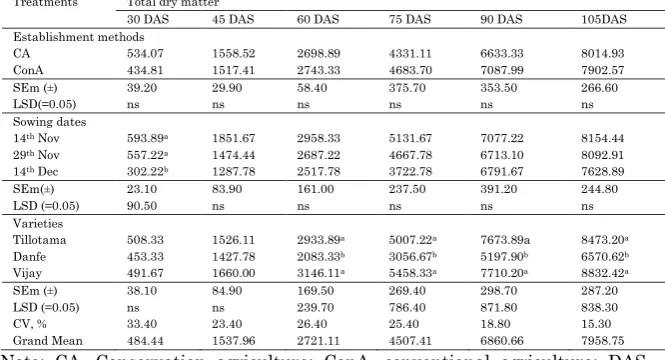
Table 3: Total dry matter (kg ha-1) as influenced by establishment
methods, sowing dates and varieties of wheat in 2014-15 at AFU, Rampur, Chitwan, Nepal
Treatments Total dry matter
30 DAS 45 DAS 60 DAS 75 DAS 90 DAS 105DAS
Establishment methods
CA 534.07 1558.52 2698.89 4331.11 6633.33 8014.93
ConA 434.81 1517.41 2743.33 4683.70 7087.99 7902.57
SEm (±) 39.20 29.90 58.40 375.70 353.50 266.60
LSD(=0.05) ns ns ns ns ns ns
Sowing dates
14th Nov 593.89a 1851.67 2958.33 5131.67 7077.22 8154.44
29th Nov 557.22a 1474.44 2687.22 4667.78 6713.10 8092.91
14th Dec 302.22b 1287.78 2517.78 3722.78 6791.67 7628.89
SEm(±) 23.10 83.90 161.00 237.50 391.20 244.80
LSD (=0.05) 90.50 ns ns ns ns ns
Varieties
Tillotama 508.33 1526.11 2933.89a 5007.22a 7673.89a 8473.20a
Danfe 453.33 1427.78 2083.33b 3056.67b 5197.90b 6570.62b
Vijay 491.67 1660.00 3146.11a 5458.33a 7710.20a 8832.42a
SEm (±) 38.10 84.90 169.50 269.40 298.70 287.20
LSD (=0.05) ns ns 239.70 786.40 871.80 838.30
CV, % 33.40 23.40 26.40 25.40 18.80 15.30
Grand Mean 484.44 1537.96 2721.11 4507.41 6860.66 7958.75
Note: CA, Conservation agriculture; ConA, conventional agriculture; DAS, days after sowing; ns, non-significance. Treatments means followed by common letter (s) are not significantly different among each other based on DMRT at 5% level of significance
3.2 Total dry matter
but wheat sown on 14th Nov and 29th Nov had total dry matter at par with each other. Though date of sowing showed no significant variation in total dry matter for date of sowing, 14th November date of sowing had higher total dry matter for throughout the cropping period. Variety showed no significant difference in total dry matter at 30 and 45 DAS but varieties Tillotama and Danfe were seen to have significantly higher total dry matter than Danfe for rest of the growth period and were at par with each other.
3.3 Yield attributing characters
3.3.1 Number of effective tillers per square meter
The number of effective tillers per meter square was also found insignificant for crop establishment methods and date of sowing. But it was higher in conservational agriculture than conventional one. The early sowing of wheat on 14th November produced higher numbers of effective tillers than sowing at 29th November and 14th December. Variety Tillotama produced significantly higher effective tillers (344.15) than Vijay (307.58) but at par with Danfe (332.63). The average number of effective tillers per meter square was 328.12.
Table 3: Number of effective tillers per square meter, number of grains per panicle, thousand grain weight (g) and sterility percentage (%) as influenced by establishment methods, sowing dates and varieties of wheat in 2014-15 at AFU, Rampur, Chitwan, Nepal
Treatments Number of effective tillers per square
Number of grains per spike
Thousand grain weight (g)
Sterility percentage Establishment methods
CA 329.35 30.38 36.66 42.23
ConA 326.88 28.98 38.71 41.17
SEm (±) 7.86 0.81 0.83 1.36
LSD(=0.05) ns ns ns ns
Sowing dates
14th Nov 343.87 31.88 38.06 39.54
29th Nov 330.45 30.57 38.02 43.44
14th Dec 310.04 26.59 36.96 42.11
SEm(±) 9.78 0.18 0.95 1.55
LSD(=0.05) ns 0.70 ns ns
Note: CA, Conservation agriculture; ConA, conventional agriculture; ns, non-significance. Treatments means followed by common letter (s) are not significantly different among each other based on DMRT at 5% level of significance.
3.3.2 Number of grains per spike
The number of grains per spike was insignificant to establishment methods and sowing dates but varieties had significant influenced. Comparatively higher number of grains per spike was recorded under conservation agriculture and delaying on sowing reduced the grains per spike. Vijay (43.60) had significantly higher number of grains per spike than Tillotama (34.59) and Danfe (34.85).
3.3.3 Thousand grain weight
The thousand grain weight showed no influence by the difference crop establishment techniques and date of sowing but only by the cultivars. The thousand grain weight was higher for conventional agriculture than conservational agriculture and in case of sowing date the thousand grain weight decreased gradually with delay in seeding. The varieties showed significant effect on thousand grain weight and Vijay had highest thousand grain weight measured 43.60 g followed by Danfe and Tillotama while they are at par with each other weighing 34.85 and 34.59 g. The average thousand grain weight was found to be 37.68 g.
3.4 Grain and straw yield and harvest index
3.4.1 Grain yield
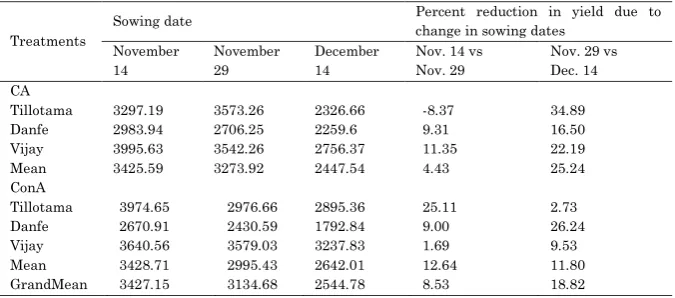
Among the two tillage practices comprising conservational and conventional, no any significant difference was seen on yield.
Danfe 332.63a 27.45 34.85b 43.44b
Vijay 307.58b 29.07 43.60 a 42.46b
SEm (±) 14.13 0.98 1.34 1.09
LSD (=0.05) 25.16 2.87 3.90 3.18
CV, % 8.62 14.00 15.10 11.10
However, Wheat sown on 14th Nov had significantly higher yield of 3427.15 kg per hectare followed by 29th Nov and 14th Dec date of sowing with recorded yield of 3134.68 and 2544.78 kg per hectare respectively. Variety Vijay proved to be the highest yielder with yield 3458.61 kg per hectare which was at par with Tillotama with 3173.96 kg per hectare yield. Variety Danfe was significantly lower for yield than both of the varieties with the lowest recorded yield of 2474.02 kg per hectare.
Table 4: Grain yield (kg ha-1) as influenced by establishment methods,
sowing dates and varieties of wheat in 2014-15 at AFU, Rampur, Chitwan, Nepal
Treatments
Sowing date Percent reduction in yield due to change in sowing dates
November 14
November 29
December 14
Nov. 14 vs Nov. 29
Nov. 29 vs Dec. 14 CA
Tillotama 3297.19 3573.26 2326.66 -8.37 34.89 Danfe 2983.94 2706.25 2259.6 9.31 16.50 Vijay 3995.63 3542.26 2756.37 11.35 22.19 Mean 3425.59 3273.92 2447.54 4.43 25.24 ConA
Tillotama 3974.65 2976.66 2895.36 25.11 2.73 Danfe 2670.91 2430.59 1792.84 9.00 26.24 Vijay 3640.56 3579.03 3237.83 1.69 9.53 Mean 3428.71 2995.43 2642.01 12.64 11.80 GrandMean 3427.15 3134.68 2544.78 8.53 18.82
Note: CA, Conservation agriculture; ConA, conventional agriculture; ns, non-significance.
3.4.2 Straw yield
3.4.3 Harvest index
The mean harvest index was found 32.32 percent and the tillage system had no effect on harvest index. The harvest index was seen maximum for the wheat sown on 14th Nov (35.02) which were significantly higher than wheat sown on 29th Nov (31.74). The harvest index of wheat on late planted condition, 14th Dec was found to be the lower significantly (30.21). Variety Vijay had significantly higher harvest index than variety Danfe but Tillotama was at par with it.
Table 5: Grain and straw yield (kg ha-1) and harvest index (%) as
influenced by establishment methods, sowing dates and varieties of wheat in 2014-15 at AFU, Rampur, Chitwan, Nepal
Treatments Grain yield (kg ha-1) Straw yield (kg ha-1) Harvest index (%) Establishment methods
CA 3049.02 5427.00 32.63
ConA 3022.05 5494.00 32.02
SEm (±) 25.00 160.90 0.90
LSD(=0.05) ns ns ns
Sowing dates
14th Nov 3427.15a 5442.00ab 35.02c 29th Nov 3134.68b 5821.00a 31.74b 14th Dec 2544.78c 5118.00b 30.21a
SEm(±) 53.40 97.20 0.22
LSD(=0.05) 209.8 381.80 0.87
Varieties
Tillotama 3173.96b 5314.00b 33.94b
Danfe 2474.02c 5756.00a 27.15a
Vijay 3458.61a 5312.00b 35.89b
SEm (±) 103.10 192.20 1.21
LSD (=0.05) 301.00 ns 3.54
CV, % 14.40 14.90 15.90
Grand Mean 3035.53 5461.00 32.32
Note: CA, Conservation agriculture; ConA, conventional agriculture; ns, non-significance. Treatments means followed by common letter (s) are not significantly different among each other based on DMRT at 5% level of significance.
5 DISCUSSIONS
5.1 Crop phenology
Emergence of any seed is influenced by many factors as tillage system (Buhler, Mester & Kohler, 1996), quality of seed, availability of soil moisture, adequate temperature and soil conditions (Mohler & Galford, 1997; Webster et al., 1998). The result shows faster rate of emergence in conventional agriculture practice which may be due to friability of soil resulted by tillage practice which lacked on conservation agriculture and make it easy for the coleoptiles to penetrate the soil. Moreover, the crop residues on the surface lowers the temperature, fluctuates the light stimuli and obstruct the hypocotyls elongation (Buhler et al.,1996) causing the delay in emergence in conservational system. Rebetzke, Bruce & Kirkegaard(2005) also mentioned that surface retained residue mulch cause mechanical barrier for emergence. The days to 50% emergence showed an increment with delay in seeding date which may be due to progressively depleting soil moisture and decreasing temperature (Quasim et al.,2008). Similar result was obtained by Benjamin (1990) and Munif (2015). The difference in seedling emergence on the varieties could be due to their genetic makeup.
due to the differential genetic characters that respond differently under diverse agro-climatic condition which was also reported by Araus, Ferrio, Buxo, & Voltas(2007).
The variation brought by date of sowing in total dry matter on 30 DAS is due to the lower winter temperature on delayed sowing that arrest the growth of plant and total dry matter at 30 DAS comprises of almost the tillers. The genotypic variation has existed for total dry matter of the plant which has been also reported by Ahamed, Nahar & Fujita (2010). The total dry matter of varieties Tillotama and Vijay could also be related with their higher economic yield than variety Danfe.
5.2Yield attributing characters
5.2.1 Effective tillers per square meter
5.2.2 Number of grains per spike
Number of grains per spike is one of the yield components which determine the grain yield. The decreasing number of grains per ears with delay in sowing date could be explained by the decreasing number of days from booting to ear emergence available for them due to change in weather conditions. As Bradley et al.(2008) mentioned number of grains per spike are determined before flowering, the temperature plays crucial role on prolonging the ear formation period. Fischer (2011) and Hochman (1982) also reported that 10-15 days prior to anthesis is crucial for the grain number formation and Dolferus (2011) revealed that abiotic stress like increasing temperature minimizes the grain number. The less number of days avail for grain number formation could also be evident by significant difference in days to heading for 3rddate of sowing than earlier sowing. The variation in number of grains per spike for varieties is controlled by the genetic factors as Tillotama showed better performance than Danfe and Vijay.
5.2.3Thousand grain weight
5.3Grain and straw yield and harvest index
The grain yield had been higher for conventional agriculture which might be attributed by higher number of effective tillers per panicle produced and higher number of grains per spikes. As all the yield attributing characters as number of effective tillers per square meter, number of grains per spike and thousand grain weight is higher for earlier sowing at 14thNovember, it is obvious and logically correct to have significantly greater grain yield than sowing at 29thNovember followed by 14thDecember. The longer crop duration and chance of escaping from terminal stress due to early sowing had been another reason for significant variation in grain yield. The variation within the varieties is purely genetic which showed Vijay is high yielder followed by Tillotama and Danfe.
The straw yield showed almost no difference for tillage differences whereas significant difference is seen for sowing date and varieties. The difference for straw yield for sowing date might be due to shorter vegetative period for delayed sowing which resulted in less number of leaves, less tillers and less growth and development for delayed on sowing that resulted less straw yield. The varieties also showed the variation for straw yield. The variety Danfe had greater straw yield, significantly greater than Tillotama and Vijay could be the controlled by inbuilt genetic character. Moreover, the less harvest index of variety Danfe(27.15%) is evident enough to know that it had less photosynthates redistribution efficiency from stem and leaves to straw than two other variety.
6 CONCLUSION
week of December. Earlier planting of the wheat in November 14 yield the highest production for the sowing date. Variety Vijay exceed the two other varieties for the wheat grain production but Danfe variety had highest straw production. The establishment method had no any influence on wheat yield and straw yield.
REFERENCES
1. Bradley, S., Berry, P., Blake, J., Kindred, D., Spink, J., Bingham, I., McVittie, J., &Foulkes, J. (2008).The wheat growth guide, HGCA
2. CIMMYT (2013).Wheat the vital grain of civilization and food security, Wheat Annual report.
3. CBS. (2013). Central Beaureau of Statistics, Statistical Year Book of Nepal 2013
4. Chauhan, B. S., Mahajan, G., Sardana, V., Timsina, J., &Jat, M. L. (2012). Productivity and sustainability of the rice-wheat cropping system in the Indo-Gangetic Plains of the Indian subcontinent: problems, opportunities, and strategies. Advances in Agronomy, 117(1), 315-369. 5. Dolferus, R., Ji, X., & Richards, R. A. (2011). Abiotic
stress and control of grain number in cereals. Plant Science, 181(4), 331-341.
6. FAO.(2013). Food and Agriculture Organization of the United Nations, 2012. Available online at
http://www.fao.org/ag/ca/6c.html
7. Fischer, R. A. (2011). Wheat physiology: a review of recent developments. Crop and Pasture Science, 62(2), 95-114.
9. Hochman, Z. V. I. (1982). Effect of water stress with phasic development on yield of wheat grown in a semi-arid environment. Field Crops Research, 5,55-67.
10.Joshi, A. K., Mishra, B., Chatrath, R., Ferrara, G. O., & Singh, R. P. (2007). Wheat improvement in India: present status, emerging challenges and future prospects. Euphytica, 157(3), 431-446.
11.MoAD, (2015).Statistical information on Nepalese Agriculture 2015. Ministry of Agriculture and Development, Agribusiness Promotion and Statistics Division, Kathmandu, Nepal
12.Reddy, T.Y. and G.H. SankaraReddi. 2005. Principles of agronomy. Kalyani Publishers, Ludhiana, India.
13.Shrestha, N., Raes, D., Vanuytrecht, E., &Sah, S. K. (2013).Cereal yield stabilization in Terai (Nepal) by
water and soil fertility management
modeling.Agricultural water management, 122, 53-62. 14.Thierfelder, C., & Wall, P. C. (2009). Effects of