Technical Evaluation:
VIRCON Task 12 Report
Steve North, Graham M Winch, Nash Dawood,
Dave Heesom, John Kelsey, Eknarin Sriprasert and Zaki Mallasi
Manchester Centre for Civil and Construction Engineering UMIST
2003
This research is funded by the Engineering and Physical Sciences Research Council’s research programme award no GR/N00876 as part of the Innovative Manufacturing Initiative
Manchester Centre for Civil and Construction Engineering UMIST
CONTENTS
1: Introduction...5
2: The VIRCON Vision ...7
3: System development ...15
4: An ‘idealised’ development sequence for the System utilising information modelling techniques...19
5: Evaluation of the VCS ‘as recommended’ and ‘as built‘ ...23
5.1 VIRCON System ‘as recommended’ ...23
5.2 VIRCON System ‘as built’...23
6: Evaluation of the VCS Against the Current State of the Art in Construction IT...27
6.1 Industry Foundation Classes ...27
6.2 XML ...28
7: Evaluation of the VCS Against the State of the Art in Construction Project Planning...31
7.1 4D Planning software tools...31
7.2 Multi-constraint Optimisation for Construction Project Scheduling...35
7.3 Developments in Construction Space Scheduling Research...37
7.4 Developments in Project Planning ...42
7.5 Issues in the VIRCON Approach...43
8: Possible directions for future research...45
9: Conclusions...47
References...49
FIGURES
Figure 1 The VIRCON Vision ...7Figure 2 Overview of VIRCON Tools 16
Figure 3 Example High-level UML Use Case Model for VIRCON 22
Figure 4 Example High-level Static UML Class Model for VIRCON 22
Figure 5 VIRCON System Set-up Phase 24
Figure 6 VIRCON System Analysis Phase 25
Figure 7 Level 0 IDEF Diagram for VIRCON System 37
TABLES
Table 1 VIRCON System Tools 15Table 2 VIRCON System Version History 16
Table 3 VIRCON System Compared to 4D Planning Packages Currently in Use 34
1: Introduction
The purpose of this research report is to provide an overview of the development of the VIRCON system (VCS), and to provide a technical evaluation of the delivered VCS software as the task 12 deliverable. The VCS consists of various software components developed by the research teams at UMIST, University College London, University of Teesside and University of Wolverhampton in collaboration with a number of industry partners. This report will first summarise the original objectives of the VIRCON project, and then describe the delivery of the research against those objectives. The report will then go on to evaluate the delivered prototype system in a number of ways :
Ø against an “idealised” development utilising information modelling techniques;
Ø against the “as recommended” criteria which are the outputs from task 3;
Ø against the current state of the art in information environments for construction project planning;
2: The VIRCON Vision
The VIRCON Vision is rooted in two principal observations :
Ø There is increasing pressure on the construction planning process : clients are demanding much improved performance in the construction process; the generation of construction planners with detailed site experience is retiring; and new techniques are being developed for the construction planning process.
Ø New software tools – particularly those associated with virtual reality (VR) - are providing new opportunities to develop and enhance the tools available to construction planners, thereby giving much more intelligence to the process.
Nam
e IDTask SubtitleEarliesL a t e s t F i n i sht StartS l a c kAtctual SFixed CosttarSubprojectMonthsActual MoneE l a p s e d T i mthsL e v e l i n g P r i o r i t yResourceWorkMonthNumber-s% EffoD u r a t i onrtResoueWorkMontrcResource-hsMonthWorkResource-sWorkMoeRnthesourc-sWoMork-nthseResourcWoMonrk-thsReesourcMonWork-thsResoeWorMonurck-ths
workben ch spec WP2.1 6662 5 1/ 93 10/9 3 01/ 93 0. 00
991010
0 pre project workplan WP1.1 66 615 1 /93 10 /93 01 /93 0 .00
991
0 1 00 Cartesian object classes WP2.2
66630 10/9310/93 010/930.00 0.450.451100
Urban Design tool Spec WP4.1 66601210/93 4/940.1810/930.00 100 F a c i l i t i e s t o o l S p e c WP5.1 66611 5 10/9 3 4/940.1 8 10/9 3 0.0 0 100 Virtual index Spec WP6.1 66651310/93 4/940.1810/930.00 100
project manageme nt WP1
66620 10/9310/96 010/930.0
0
363637100 Attribute manager WP2.5 6664 5 10/9 3 11/9 3 010/9 3 0. 0 0 0. 9 0 0. 9 0 110 0 intelligen ce manager WP2.3 66 63 5 10 /9 3 12 /9 3 010 /9 3 0 . 00 1 . 81 1 . 81 21 0 0 Interface manager WP2.4 6664 0 10/9 3 12/9 3 010/9 3 0. 00 1. 81 1. 81 210 0 Script manager WP2.7 66 655 10 /93 12 /93 010 /93 0 .0 0 1 .8 1 1 .8 1 21 00 Data manager WP2.6
66650 11/9312/93 011/930.00 0.900.901100 Intelligent Workbench Kernal WP2
66660 12/9312/93 012/930.00 0.450.451100 Intelligent Agent toolkit WP3.1
66665 12/93 3/9
4
012/930.0
0
334100 Met
a-layer toolkit WP3.2
66670 12/93 3/94 012/930.00 334100 Attribute
visualisation tools WP3.4
66680 12/93 3/94 012/930.00 334100 Construct ion toolkit WP3.5 66 685 12 /93 3 /9 4 012 /93 0 .0 0
3341
00 Interface builders WP3.7 6669 5 12/9 3 3/ 94 012/9 3 0. 00
33410
0
Early Prototype Workbench WP2 & WP3 66 6110 3 /94 4 /94 03 /94 0 .00 0 .45 0 .45 11 00 Urban early prototype WP4.2 66 61 25 4 / 94 10 /9 4 04 / 94 0 . 00
6671
0 0 Facilities early prototype WP5.2 66 6130 4 /94 10 /94 04 /94 0 .00
6671
00
Virtual index early prototype WP6.2
6661404/9410/94 04/940.00 667100RA1 61.00100 6 Urban v.1
prototype WP4.2
66626010/94 4/9
5
010/940.0
0
667100 Facilities v.1 prototype WP5.2 6662 55 10/9 4 4/ 95 010/9 4 0. 00
66710
0
Virtual index v.1 prototype WP6.2
66625010/94 4/95 010/940.00 667100 Report on early prototype workbench 6661654/9 5 5/9 5 04/9 5 0.0 0 0.4 5 0.4 5 1100 Urban testing
WP4.3 66601510/94 511/99.6710/940.00 100 F a c i l i t i e s T e s t i n g WP5.3 66615 5 10/9 4 11/9 5 9.6 7 10/9 4 0.0 0 100 Virtual index testing WP6.3 66601610/94 511/99.6710/940.00 100
File import/ex port WP3.3 66 675 5 /95 11 /95 05 /95 0 .00
6671
00 R A1 31 .00 1 00 3
Rendering and animation toolkit WP3.6
66690 5/9511/95 05/950.00 667100 Computati onal tools WP3.8 6661 00 5/ 95 11/9 5 05/ 95 0. 00
66710
0
Constraint based objects toolkit WP3.9 66 6105 5 /95 11 /95 05 /95 0 .00
6671
00
Report on urban EP 6665171/9511/959.671/950.00 0.220.22 100 R e p o r t o n f a c i l i t i e s EP 6660181/9511/959.671/950.00 0.220.22 100 Report on Virtual Ind EP 6665181/9511/959.671/950.00 0.220.22 100
Full Prototype Workbenc h 66 6170 11 /95 11 /95 011 /95 0 .00 0 .45 0 .45 11 00
Urban full prototype WP4.4
66623011/95 5/96 011/950.00 667100 Facilities full prototype WP5.4
66622511/95 5/9
6
011/950.0
0
667100 Virtual index full prototype WP6.4
66622011/95 5/96 011/950.00 667100 Urban
testing WP4.3
6662155/96 9/96 05/960.00 445100 Facilitie s Testing WP5.3 66 6210 5 /96 9 /96 05 /96 0 .00
4451
00 Virtual index testing WP6.3 6662055/9 6 9/9 6 05/9 6 0.0 0
445100 Report urban Prototyp e 6662 00 9/ 96 10/9 6 09/ 96 0. 00 0. 45 0. 45 110 0 Report facility Prototype 6661 95 9/ 96 10/9 6 09/ 96 0. 00 0. 45 0. 45 110 0 Report Virtual Ind Prototype 66 6190 9 /96 10 /96 09 /96 0 .00 0 .45 0 .45 11 00 Fina l Repo rt 6662355/9 6
10/96 05/9
6 0.0 0 4.4 5 4.4 5 5100
Figure 2.3 Intelligent Architecture Project Task Time line Figure 2.3 Intelligent Architecture Project Task Time line
Information Task 1 Analysis and decision support
Space -Time Broker Task 6
Visualisation Task 7
Figure 2.2 Intelligent Architecture Project Schedule Chart
workbench spec WP2.1
1/93 9 pre project workplan WP1. 1 1/93 9 Cartesian object classes WP22.
10/9
3
0.4
5
Urban Design t o o l Spec WP14. 10/9 3F a c i l i t i e s 6 t o o l Spec WP15. 10/9
3
6
V i r t u a l i n d e x Spe c WP6.
1
10/9
3
6
project manageme nt WP1
10/9
3
36
Attribut e manage
r WP2. 5 10/9 3 0.9 0
i n t e l l i g e n c e manage
r WP2. 3 10/9 3 1.8 1 Interface manage r WP2. 4 10/9 3 1.8 1 Script manager WP2. 7 10/9 3 1.8 1 Data maWP26nag.er
11/9
3
0.9
0
I n t e l l i g e n
t Workbenc h Kernal WP2 12/9 3 0.4 5
I n t e l l i g e n t Agentoolkit WP31t .
12/9
3
3
Meta-layer t o o l k i t WP32.
12/9
3
3
Attribut e v i s u a l i s a t i o n tools WP34.
12/9 3Construction toolkit WP353.
12/9
3
3
Interface b u i l d e r s
WP3. 7 12/9 3 3 Early Prototype Workbenc h WP2 & WP3
3/94 0.4
5
Urban early prototyp e WP24.
4/94
F a c i l i t i e s e a r l y pe WPrototyp25.
4/94
V i r t u a l i n d e x early proWP2totype 6.
4/94
Urban v.1 prototyp e WP42.
10/9
4
F a c i l i t i e s v . 1 prototyp e WP52.
10/9
4
V i r t u a l i n d e x v.1 proWP62totype .
10/9
4
Report on early protoe workbh typenc
4/95 0.4 5 Urban testing WP4. 3 10/9 4F a c i l i t i e s T e s t i ng WP533. 10/9
4
3
V i r t u a l i n d e x t e s t i n g WP6.
3
10/9
4
3
F i l e import/expor t WP33.
5/95
6
Rendering and animation t o o l k i t WP63.
5/95
6
Computation a l tools WP83.
5/95
6
Constraint based objects t o o l k i t WP93.
5/95 6 Report on urban EP 1/95 0.2 2 Report on f a c i l i t i e s E P
1/95 0.2 2 Report on Virtual Ind EP 1/95 0.2 2
F u l l Prototype Workbenc h
11/9
5
0.4 5U r b a n f u l l prototyp e WP44.
11/9 5F a c i l i t i e s f u l l pe WPrototyp465.
11/9
5
6
V i r t u a l i n d e x f u l l prototypeWP46.
11/9 5 6 Urban testing WP4. 3 5/96 4
F a c i l i t i e s T e s t i n g WP5.
3
5/96
4
V i r t u a l i n d e x t e s t i n g WP6.
3
5/96
4
Report urban Prototype
9/96 0.4
5
Report facility Prototype
9/96 0.4
5
Report V i r t u a l Ind Prototype
9/96 0.4
5
F i n a l Report
5/96 4.4
5
Critical path analysis Task 5
Critical space analysis Task 4 feedback changes Project database CAD Resources Methods Resource visualisation Timeline visualisation
3D visualisation space/time critical events
Critical space visualisation
Figure 1 The VIRCON Vision
source Kelsey et al (2000)
and CSA. Figure 1 presents the original VIRCON vision for construction project planning, and its principal components.
The VCS comprises three main elements:
Ø a project database which integrates relevant geometric, method, resource and task information;
Ø the analysis of time critical and space critical tasks, and the brokering of these two aspects in project planning;
Ø the visualisation of the project process with respect to time and space.
The VCS was planned to be delivered through 12 tasks, shared between the three collaborating universities. The move of the Principal Investigator from UCL to UMIST during the project meant that UCL’s responsibilities were shared with UMIST. The unfortunate incapacitation of the designated project manager from Carillion also meant significant changes to task 1, and this task became, in effect, a UMIST responsibility.
Task 1 Project Management
Task Manager : Carillion/UMIST
This task covered overall project management of the research and co-ordination of the team, and responsibility for chairing the Steering Committee.
Task 2 : Data Capture and Data Base Development
Task Manager : Teesside.
Research Resource : Teesside
Collaboration AMEC; Bond Bryan; Services Design Associates; ABB The principal activity here was the development of the VIRCON database which is at the heart of the VIRCON system. This was developed in MS Access following a literature review which suggested that object-orientated data bases were less suited to this task than relational databases, and that the excellent interconnectivity and widespread diffusion of MS Access offered considerable advantages. The use of industry foundation classes (IFCs) was also rejected due to their limited level of development in 2000, and lack of diffusion in
industry. AutoCAD was selected as the CAD software due to its widespread diffusion, and good database interconnectivity. The interface using OLE DB was written as a macro in AutoCAD called DataExtractMan. An important decision was made to fully adopt industry information standards, and so the VIRCON data base is fully compliant with the BS 1192-5 standard for information layers in CAD, and the Uniclass project information classification standard.
Building at the University of Teesside and input as 2D drawings and a construction programme in MS Project.
Deliverables:: a structured relational data base and 2D (x & y) model of the Centuria Building project for use in tasks 5, 6 & 7.
See: Dawood, Sriprasert, and Mallasi (2003a)
Task 3 : Technology Opportunities and Potential
Task Manager : Wolverhampton.
Research Resource : Wolverhampton
The aim of this task was to review the state of the art at project
commencement, both in construction and more broadly. Three reports were produced. The first reviewed current research, and identified three relevant bodies of work :
Ø
4D planning research focused on developing techniques for visualising the construction of the 3D product model through time;Ø
research focused on various aspects of planning the use of space on construction sites, focusing on both site layout and taskexecution;
Ø
research on clash detection between differing spatial requirements. The second report reviewed 12 critical path analysis (CPA) software packages, and recommended the adoption of MS Project due to its excellent functionality, widespread diffusion, and excellentinterconnectivity.
The third report cast its net more widely, and identified the use of drag-and-drop templates for construction plant, the use of IFCs, and web applications for project information management.
Deliverables: three reports on the potential applications of
manufacturing process visualisation techniques; choice of MS Project for the VCS; evaluation protocol for task 12.
See: Heesom and Mahdjoubi (2002 a, b, c)
Task 4 Understanding Planning Decisions : Requirements Capture
Task Manager : UCL.
Research Resource : UCL
Collaboration : Skanska; Carillion; Balfour Beatty; AMEC
This task constituted the main requirements capture phase of work. Detailed interviews were conducted with a sample of 18 experienced planners across the four principal collaborators to identify current practice, and to elicit their requirements for the VCS, supported by process maps. The most striking findings were how little time there was for the effective planning of the job (because of very short tender
within current planning practice to have any hope of being
implemented, and needed to allow broad-brush analysis. From this we developed our specification of the VIRCON system as a “quick and dirty” (QUAD) system, which would allow frequent amendment and would not require major changes in current planning practice, thereby allowing allow speedy implementation. Critically, the tool has to be easy to use requiring little additional training. In addition it should interface easily with other software in current use by the contractor. The planners interviewed reported that they would strongly welcome such a system. Deliverables : report on the state of the art in construction planning ; evaluation protocol for task 10.
See: Kelsey, Winch and Penn (2001).
Task 5 Prototype Critical Space Analysis System Development
Task Manager : UMIST
Research Resource : UMIST
Our early work identified the requirement for a mark-up tool that would allow the definition of the spaces available on site. The CAD files in the database only provide the building as intended by the designers. For much of the project life-cycle, many of the components in the building do not exist. Therefore, the CAD drawings alone cannot be used to define available space, and they require further manipulation. A simple-to-use mark-up tool called AreaMan was developed which takes the weekly 2D AutoCAD drawings produced by PlantMan and allows the planner to mark them up for space availability week by week, producing 2D drawings in .dxf format. If necessary, AreaMan can work
independently of the database, taking .dxf format inputs directly from the designers’ CAD files. The rationale for this tool is based on the conclusion that spatial planning on construction sites is essentially a 2D problem. Any work at height would “sterilise” the area below it for both practical reasons of providing access, and safety reasons.
Conceptual work building on the recent literature on construction space planning was also undertaken to develop a terminology for construction space use, and “critical space” was defined as any space with a loading of 100 where this is calculated as a ratio of required space to available space.
Deliverable: space mark-up tool : AreaMan See:North and Winch (2002)
Task 6 : Visualisation Development: Whole Building Visualisation
Task Manager : Teesside.
Research Resource : Teesside
Collaboration : AMEC
structural works. This task sought to develop a methodology for integrating standard scheduling software with the 2D model for
visualisation purposes. First, this model was manipulated to produce a 3D effect – sometimes known as 2½D, to distinguish it from true 3D product models. This first step in this manipulation is to ensure that all objects are drawn as polylines. Then the change property feature in AutoCAD can be used to allow the input of elevation and thickness
values to give the third dimension. The grouping of these objects then allows their linkage with the MS Project programme. After populating the database with DataExtractMan, the 4D effect (3½D) simulation can then be run either in AutoCAD itself, or using a VR interface such as DDDoolz. This tool was dubbed ProVis.
Deliverables: 3½D space and time visualisations in an AutoCAD environment.
See: Dawood, Sriprasert, and Mallasi (2003b).
Task 7: Visualisation Development: Specialist Trades Visualisation
Task Manager: Wolverhampton.
Research Resource: Wolverhampton.
Collaboration : Balfour Beatty; ABB
This task was executed in close collaboration with task 6. Two specialist trades were selected which are particularly challenging for planners – groundworks, and mechanical and electrical services. Data for the former visualisation came from Balfour Beatty’s University College Hospital site, while Centuria Building data from ABB were used for the latter. A number of tools were developed :
Ø ResourceMan is a database tool to allow the development of a library of the spatial requirements of human and plant resources;
Ø PlantMan is used to develop weekly spatial layouts of the project. These layouts can be populated using drag and drop templates of plant and temporary structures from ResourceMan. Plant
movement paths can also be assigned. There is also the facility to specify datum levels for the various floors of the building.
Ø ClashMan allows the identification of clashes between the temporary objects positioned in PlantMan and the permanent objects of the building completed to date derived from the database.
Ø SpaceVis provides a VRML visualisation of the progress of the building week by week. This is a platform independent tool which can be run using any standard VRML player.
Task 8 Prototype Space/Time Broker
Task Manager UMIST.
Research Resource : UMIST
This task takes the data provided by AreaMan and PlantMan on spatial allocations, and then analyses them in relation to the programme to identify areas of spatial overload. This is visualised through a traffic-light interface which simultaneously shows the loading on the space, and the status of the tasks allocated to that space for that week in relation to the critical path. This space/time brokering system was developed as a client/server application dubbed SpaceMan. The system can be used either in terms of decision support to identify spatial overloads, or it can be asked to attempt to resolve these overloads by using a “brute force” rescheduling algorithm. The results of this analysis are then used to update the database for use in the visualisations developed in tasks 6 and 7, and also to update the MS Project file.
Deliverable: prototype Space/Time Broker software : SpaceMan. See: North and Winch (2002)
Task 9 System Integration
Task Manager : UMIST.
Research Resource : UMIST; Teesside; Wolverhampton.
This brought together existing CPA software together with the results of tasks 2, 5, 6, 7 & 8 and tested the prototype of the whole decision support system in the form of the Virtual Construction System. This identified a number of software glitches which were resolved
collaboratively by the whole VIRCON team. In addition, systems architecture and IDEF0 maps were drawn, and a VCS toolbar was developed to allow easy movement between the various VIRCON tools. Deliverable : prototype VIRCON System v. 1.3.
See: North and Winch (2003).
Task 10 User Evaluation and Testing
Task Manager : Teeside
Research Resource : Teesside; UMIST
Collaboration Balfour Beatty; Skanska; AMEC.
A live project being constructed by Skanska – the Westmoreland School in Stockport - was chosen to provide the data for evaluation sessions. This was chosen because of its use of the CLASP
approach and the value of the tools developed. Both strengths and weaknesses of the system were identified, and suggestions for further improvements made.
Deliverable: report on VCS in use and recommendations for further development.
See: Dawood, Sriprasert, and Mallasi (2003c).
Task 11 Dissemination
Task Manager : Teesside.
Research Resource : Teesside; UMIST; Wolverhampton. This task is current at the time of the preparation of this report.
Task 12 Technical Evaluation and Review
Task Manager : UMIST
Research Resource : UMIST, Teesside, Wolverhampton, UCL
This task provides an overview and evaluation of the achievements of the VIRCON project. In addition to summarising the task outputs and describing the development process, it evaluates the output of task 9 against two benchmarks:
Ø The system as proposed in the grant application;
Ø Research in the area over the last two years.
It concludes that the objectives of the proposal have been substantially achieved, and where objectives have not been fully achieved, there are very good reasons for this. It also includes that, compared to other current research, the VIRCON system represents both a significant contribution to our knowledge in the area of VR applied to construction planning, and a distinctive approach which is led by the requirements of construction firms, rather than technical possibility. Limitations of the system as delivered are also identified, and avenues for further work indicated.
Deliverables: overview of VIRCON project achievements, and report on potential for further development of the VCS.
3: System development
The chosen development approach for the VIRCON System utilised existing third-party applications, such as AutoCAD, Microsoft Project, and Microsoft Access. The advantage of this method is that maximum effort can be applied to research-related software development. The alternative is to develop the entire system from the ground up, without any reliance on existing software. A stand-alone development route would necessitate the duplication of
existing functionality, such as CAD editing and data handling. This might best be described as ‘reinventing the wheel’. However, it does offer the advantage that all bugs are addressable by the research developers. Section 4 will describe an idealised, hypothetical approach to developing the VIRCON System from scratch.
1. VIRCON tool bar (launch buttons for all components) 2. AutoCAD
3. Microsoft Access
4. PBS exporter macro (AutoCAD to Microsoft Access)
5. ResourceMan (stand-alone database management tool for legacy collection of resource data including Required Space)
6. Resource Standards Database (Microsoft Access format for use with Resource Man)
7. Microsoft Project
8. Microsoft Project interface (a set of VBA macros, views, mappings and toolbars for importing, exporting data)
9. VIRCON Database (Microsoft Access format)
10. PlantMan (a stand-alone 2D tool for adding temporary/plant template objects)
11. ClashMan (a stand-alone tool for detecting clashes with temporary/ plant
13. SpaceMan Client (stand-alone CSA tool)
15. SpaceVis (VRML 4D Project Visualiser) 16. ProVis (AutoCad 4D Product Visualiser)
12. AreaMan (a mark-up tool for identifying Available Spaces)
14. SpaceMan Server (stand-alone CSA tool)
Table 1 VIRCON System Tools
source : North and Winch (2003).
team’s focus had to be on component interoperability. Figure 2 provides an overview of the VIRCON tools, which are listed in table 1.
VIRCON Database
Uniclass AutoCAD (2D/3D)
MS Project (CPM Schedule) ResourceMan (Resources)
Set Up
Project Data
PlantMan (Assign Plants) ClashMan (Detect Clashes) AreaMan (Mark-up Spaces)
Space
Planning
SpaceMan
- Check spatial overload - Manual/Automatic space optimisation
Analysis and Optimisation
ProVis (4D CAD)
SpaceVis (4D VRML)
Visualisation
Figure 2 Overview of the VIRCON Tools
source : Dawood et al 2003c
Several of the tools were developed both concurrently and incrementally. However, it is possible to approximate the development sequence as follows:
Ø VIRCON Database (vircon.mdb)
Ø DataExtractMan (PBS exporter macro- AutoCAD to MS Access)
Ø SpaceMan Client
Ø SpaceMan Server
Ø PlantMan
Ø AreaMan
Ø Microsoft Project Interface
Ø ProVis (AutoCad 3½D Product Visualiser)
Ø SpaceVis (VRML 3½D Project Visualiser)
Ø Resource Standards Database (ResourceStandards.mdb)
Ø ResourceMan
Ø ClashMan
Ø VIRCON tool bar
VIRCON System release
Release date VIRCON task purpose
v1.0 Aug 2002 Task 9 Testing-UMIST
development team
v1.1 Aug 2002 Task 9 Testing- broader
development team
v1.2 Sept 2002 Task 10 User evaluation
v1.3 Feb 2003 Task 11/Task 12 Post-evaluationdissemination
Table 2 VIRCON System Version History
source : North and Winch (2003)
the VIRCON project. The release CD also contained all 10 VIRCON research reports.
The VIRCON system utilised a range of programming languages, protocols and standards. These included :
Ø ActiveX controls (for DXF functionality and implementation of the SpaceMan Client/Server architecture)
Ø C++ (programming language for SpaceMan, AreaMan and VIRCON Tool Bar)
Ø CAD layering standards ISO DIS 13567 (ISO 1998a, 1998b, 1998c) and BS 1192-5:1998 (British Standards Institute 1998)
Ø DXF (AutoDesk 2000)
Ø HTML (used for help pages)
Ø Microsoft Data Access Objects (DAO) v3.6 (Microsoft 2001)
Ø Microsoft Jet v4.0 (underlies Microsoft Access database technology)
Ø Microsoft ODBC (used by components for data exchange)
Ø Structured Query Language (SQL)- used by SpaceMan for requests to the VIRCON database and internally to the database for content processing.
Ø Microsoft Foundation Classes (MFC) - used with C++ in the construction of SpaceMan, AreaMan and the VIRCON Tool Bar.
Ø UNICLASS (Crawford et al 1997) - used as information model on the database.
Ø User Datagram Protocol (UDP) from TCP/IP (used as a message transport for SpaceMan Client / Server).
Ø Virtual Reality Modelling Language (VRML) - used by SpaceVis for the 3½D visualisation.
Ø Visual Basic (programming language of choice for all University of Wolverhampton components).
4: An ‘idealised’ development sequence for the
System utilising information modelling techniques
In Section 3, it was noted that the VIRCON System was developed using a reliance on third-party software. This is one of two possible approaches that could have been adopted for developing VIRCON. The chosen methodology can be summarised as, ‘use third-party solutions and fill in the gaps with new components’. The main advantage of this was having more time to
concentrate on software coding that directly addressed the research problem. Recent researchers such as Calvet and his colleagues (2002) support the VIRCON conclusion that the ready availability of Microsoft tools amongst SMEs, provides an ideal platform for rapid software prototyping.
This section considers the development of the VIRCON System from an alternative, idealised, perspective. The purpose of this is to consider whether further development work might be approached in a different manner. The proposed alternative development route is idealised in two ways. Firstly, it has the benefit of prior knowledge about the actual VIRCON System that emerged through many prototyping iterations. Secondly, it assumes that there will be no reliance on third-party software. This assumes that research resources are available to model, specify and develop a new system in its entirety. For example, much of AutoCAD’s functionality of would need to be replicated.
The biggest advantage to this method is that development teams would not be trying to workaround third-party limitations. Any bugs would be completely accessible to programmers.
Where an entire system is being coded from the ground up, it is desirable to move from generalised information models (the client’s ‘real-world’ problem) to automatic code generation. There is also the reverse case, where an existing application is ‘reverse engineered’ back to diagrammatic form. The computer science field of Object-Oriented Analysis and Design has
"The Unified Modeling Language (UML) is a graphical language for visualizing, specifying, constructing, and documenting the artifacts of a software-intensive system. The UML offers a standard way to write a system's blueprints, including conceptual things such as business processes and system functions as well as concrete things such as programming language statements, database schemas, and reusable software components." (Object Management Group 2002).
UML has several "models" or "diagrams" that are used to describe a software system. Each model represents a different aspect:
Ø The Use Case Model (Diagram) - a particular activity that an actor performs. The emphasis is on what a system does rather than how.
Ø The Class Model (Diagram) - this is the static architectural representation of software i.e. classes, values and methods. The Class Model shows what interacts but not what happens when they do interact.
Ø The Sequence Model (Diagram) - this describes the flow of messages being passed from object to object. Unlike the Class Model, the Sequence Model represents dynamic messages passing between instances of classes, rather than just a static structure of classes.
Ø The State Model (Diagram) - shows the possible system states in response to varying user or system generated events.
Ø The Activity Model (Diagram) - a combination of State Model, Use Case Model and a flowchart.
Ø The Collaboration Model (Diagram) has a similar function to the Sequence Model. The primary difference is that a Sequence Model illustrates the actual message/request sent and a Collaboration Model shows the effect of one object on another (“user PUSHES button” etc.).
Ø The Component Model (Diagram) - represents the graphical user interface components and their related messaging architecture.
Microsoft Visual Studio .NET Enterprise Architect includes the ability to reverse engineer Visual Studio projects (Visual Basic .NET, C++, C#, Visual Basic 6.0 and Visual C++ 6.0) into Visio UML class diagrams. It can also generate code skeletons for Visual Basic .NET, C++, and C# from UML. Microsoft Visio Professional 2002 does not feature code generation but it can reverse engineer Visual Studio projects (Visual Basic .NET, C++, C#, Visual Basic 6.0 and Visual C++ 6.0) into Visio UML class diagrams. As an
The procedure for using Microsoft Visio Professional 2002 to reverse engineer applications into UML static Class Models (classes, values and methods) is reasonably straightforward. For example, in Microsoft Developer Studio using Visual C++ 6.0 the steps are as follows (this assumes Microsoft Visio Professional 2002 is installed) :
Ø Tools menu->Customize
Ø Customize dialog box->Add-Ins And Macro Files tab
Ø Add-Ins And Macro Files list->Visio UML Add-In.
Ø Visio UML Add-In->check mark
Ø Click Close
Ø Visio UML Add-In toolbar appears.
Ø Dock toolbar by dragging it to the toolbar area (to make sure visible next time)
Ø Open the Visual C++ project
Ø Generate a Browse Information file
Ø Reverse Engineer UML Model toolbar button on the Visio UML Add-In toolbar
Ø It may take several seconds to extract the class information from the Browse Information file. When the extraction is complete, the Visio UML Model Diagram solution opens with a blank static structure diagram drawing page and a tree view in the Model Explorer, populated with icons that reflect the class definitions in the source code.
Ø In the Visio UML Model Diagram solution, drag icons from the tree view onto the drawing page to create a static structure diagram that represents a view of the model.
The architecture of the existing VIRCON system has been largely determined by the third-party components. Therefore, there is not much value in reverse-engineering the components as a prelude to improving the architecture. It is possibly more useful to manually deconstruct the functions of the completed system (including the third-party elements) and then redesign the system in UML. The generally accepted sequence for UML software design, is to produce Use Case Models (often with a client) and then use this information to identify objects and hence Class Models. It is common practice to increase the granularity of these UML models, working from the general to the
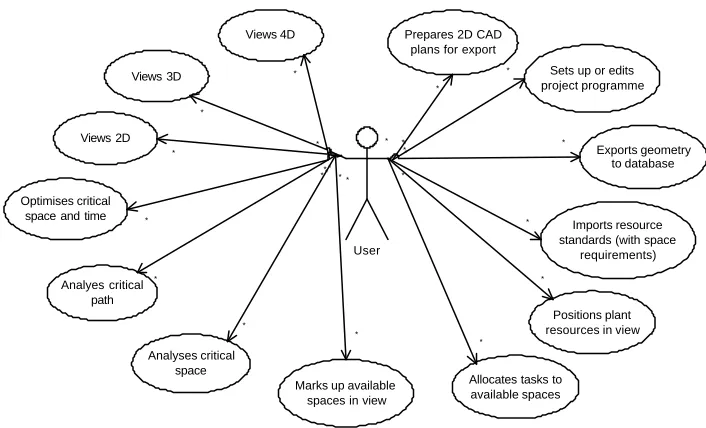
User
Views 4D Prepares 2D CAD
plans for export
Sets up or edits project programme
Exports geometry to database
Imports resource standards (with space
requirements)
Positions plant resources in view
Marks up available spaces in view
Allocates tasks to available spaces Analyses critical space Analyes critical path Optimises critical space and time
Views 2D Views 3D * * * ** * * * * * * * * * * * * * * * * * * * * *
Figure 3 Example high-level UML Use Case Model for VIRCON
Standard Resource
Space Drawing Programme
View
2D View 3D View 4D View
Database Project End1 End2 End3 End4 End5 End6 End7 End8 End9 End10 End13 End14 End11 End12 End15 End16 End17 End18
5: Evaluation of the VCS ‘as recommended’ and ‘as
built‘
This section will review the system “as recommended” by the conclusions from our early work in tasks 3 and 4 and compare it with the system as delivered at the end of task 9.
5.1 VIRCON System ‘as recommended’
The following list represents key elements of the VIRCON System ‘as recommended’. This is compiled from Kelsey, Winch and Penn’s VIRCON requirements capture report for Task 4 (2001) and Heesom & Mahdjoubi’s technology potential Task 3 reports (2002a, 2002b, 2002c):
Ø Microsoft Project should be utilised.
Ø Templates for plant and temporary works should be included in space layouts.
Ø A space density or space capacity factor should be included.
Ø VIRCON should be decision support system rather than an expert system.
Ø System should generate dynamic simulations of space and time.
Ø System should be web-enabled.
Ø System should integrate with other systems used by contractors
Ø System should be able to receive CAD drawings on CD-ROM from architects in order to reduce initial set-up time.
Ø Industry Foundation Classes should not be used.
Ø the system should be a “quick and dirty” (QUAD) one, making the maximum use of existing technologies that are already widely
diffused, rather adopting theoretically ideal approaches which are, as yet, not implemented in practice.
5.2 VIRCON System ‘as built’
Ø Microsoft Project 2000 was utilised for project planning and space allocation.
Ø The PlantMan component allows plant and temporary works templates to be included in space layouts.
Ø A space capacity factor was addressed in the development of Critical Space Analysis.
Ø The System maintains a balance between decision support and expert functionality.
Ø The System generates dynamic 3½D visualisations in both VRML and AutoCAD using the SpaceVis and ProVis components respectively.
Ø Utilising standard third-party tools, such as Microsoft Access, allows greater compatibility with tools used by contractors.
Ø The System is able to work with standard CAD drawings, received by the planners on CD-ROM from architects.
Ø User evaluation showed ease of use and ready comprehension of the potential of the system.
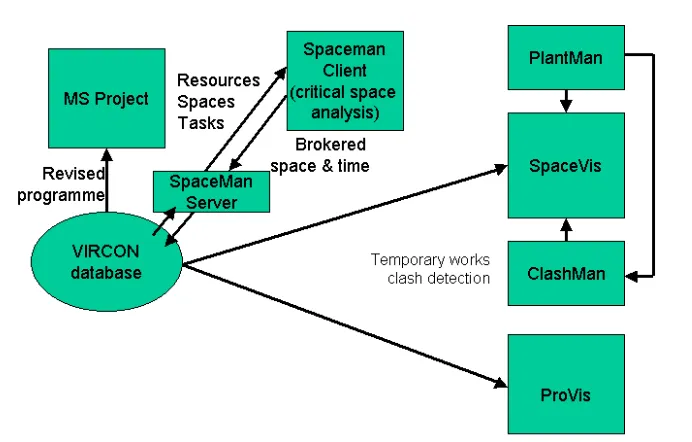
Figures 5 and 6 show the architecture of the delivered system in terms of the set-up phase and the analysis phase. If these are compared with the
VIRCON vision shown in figure 1, it can be seen that the system as originally proposed has been largely delivered, even if the precise architecture is somewhat different. The set-up phase architecture in figure 5 shows the way in which the VIRCON database is at the centre of the VCS, taking inputs from CAD and CPA software, as well as our own ResourceMan tool to store process planning information. This is then enhanced through methods information input using PlantMan, and identification of available spaces using AreaMan.
Figure 5 VIRCON System Set-up Phase
source : North and Winch (2003)
extrusion results in what is sometimes known as 2½D (e.g. McCarthy 1999), to distinguish it from a true 3D wire frame or solid model. Such models have the considerable advantage that they require much less work in building the original CAD model, and are appropriate where a 3D model is not justified for other reasons, such as analysis of product performance. Our programme visualisation model has, therefore, been dubbed a 3½D visualisation tool, to distinguish it from current true 4D approaches. ProVis is also capable of visualising critical spaces by using colour coding, an approach that is being developed in the doctoral work by Mallasi.
Figure 6 VIRCON System Analysis Phase
6: Evaluation of the VCS Against the Current State of
the Art in Construction IT
Since the review of the state of the art in construction IT reported in Heesom and Mahdjoubi (2002a,c), it has – perhaps inevitably - moved on. The two main technical developments are the widening diffusion of industry foundation classes (IFCs), and eXtensible Markup Language (XML). This section will review the implications of these two developments for the VIRCON research project.
6.1 Industry Foundation Classes
At research commencement, IFCs were starting to be used in research and pilot implementation environments, but we believed that to attempt to make the VCS fully compatible would be a diversion from our QUAD approach derived from our requirements capture work. However, there are substantial and growing efforts directed towards information standardisation and integration under the direction of the International Alliance for Interoperability (IAI). This is an industry association dedicated to embracing standardisation and develop tools associated with it. The objective is to provide a universal basis for process improvement and information sharing in the construction and facilities management industries. A number of IFC development projects are now working hard to complete their work in time for inclusion in the IFC 2x Edition 2 release proposed for Spring 2003. Their inclusion will mark the largest ever increase in functionality for the IFC model and will expand its capabilities into areas where there is a known demand for high quality information exchange.
Looking at the future, the IFC standard keeps improving and immediate release of IFC 2x2 and IFC 3 (expected in 2-3 years) should enhance the capabilities of IFCs and encourage the industry to use them. Furthermore, the database tools for IFC are improving and been developed using SQL servers, with which the VIRCON database is fully compatible.
The development of the VIRCON system did not ignore the IFC standard, however. Several trials were conducted using the currently available standards and tools. These developments includes:
Ø The deployment of Uniclass/ISO 14177 which is the UK classification standard for structuring product, process, and resource data. This standard obviously is supported by the IFC called IFCClassification.
Ø The development of ProVis, a 3½D visualisation tool, as a plug-in to Architectural Desktop 3.3. This tool can be used to visualise an IFC based product model (Dawood et al 2003b).
In conclusion, the research team believe that the right approach was used in the project and VIRCON tools can be further developed to cater for IFC standards. This obviously will depend on the level of industrial support for IFC.
6.2 XML
Since the start of the VIRCON research, eXtensible Markup Language (XML) has reinforced its position as a realistic technology for implementing
information models. Recent construction industry researchers, such as Katranuschkov et al. (2002), have described XML as the 'glue' between users and data. Whereas three years ago at the start of the VIRCON project, XML would have been just one of several choices for developing interfaces and data maps, it is now clearly emerging as a standard. It is becoming increasingly common to combine XML with IFC technology. Adachi (2002) provides an excellent description of implementing a project database server using both of these technologies.
XML has been widely adopted for construction software development. However, there are no clear leaders in terms of the many construction-specific XML dialects (for example bcXML).
The key element of XML is its ability to separate raw data from presentation format. The implication of this is that the either the data or the format can be revised without the need to change both. XML has a variety of
specifications, the main one - XML Specification v1.0 (2nd Edition) (W3C 2000) - describes the overall syntax for creating documents with data-specific tags.
(within syntactical limits) as required by the user. However, there are sometimes advantages to agreeing a set of tags that may be applied to a specific task or industry. This is called a 'schema'. XML documents can then be validated against a schema, to ensure their compliance with the
requirements of a particular domain. The schema does not contain any data itself; it simply provides the tag names and structure that are permissible within an XML document in this domain. Schemas provide both an information design reference for developers addressing data exchange issues and a more literal 'run-time' validation, if required.
XML documents can be required to compare themselves with the schema at run-time to check for compliance. This might prove particularly useful where XML documents are generated 'on the fly'. It is important to understand that it is perfectly possible to use XML without schema validation. The schema itself is a separate document, similar to an XML document but without any data. Confusingly, two standards have emerged for defining schemas. The first of these, Document Type Definition (DTD), appeared as a part of the original XML 1.0 specification. This allowed a developer, or standards body, to specify the XML elements, attributes, structure and nesting to be used in a particular type of XML document. This is sometimes also called the 'content model'.
If an XML document conforms with the content model defined by a DTD, it is said to be valid with respect to that DTD. DTD is slowly being replaced by XML Schema (W3C 2001b and 2001c). This is an ongoing effort by the W3C to supplant DTDs with a more flexible and powerful system to describe the structure of conforming XML documents, including provisions for defining datatypes. XML, DTD and XML Schema all relate to data handling. As
previously stated, the strength of XML is in the separation of data and format. XML may be used for data exchange between all types of applications (not just HTML web pages). Where XML is used on the web, formatting is handled by the eXstensible Stylesheet Language (XSL). XSL (W3C 2001a) describes how the XML data is laid out on the page. It is possible to have different XSL documents for the same XML data, allowing layout variations. Although, there are various ways to structure the components of an XML web page, the simplest example follows. There is one HTML page (say
index.html). This page does not contain any data or formatting. It just references and loads both the XML document (say data.xml) and the format (say format.xsl). In addition, the XML document (data.xml) may be required to validate itself against either a DTD (say schema.dtd) or increasingly an XML Schema document (say schema.xsd).
7: Evaluation of the VCS Against the State of the Art
in Construction Project Planning
Following on from comparing the VCS system as delivered to the state of the art in construction IT, this section compares it to a number of different
developments in construction planning. These are 4D planning; constraint optimisation; construction space planning, and developments in project planning methods. The section will close with a discussion of some of the implications of the VCS approach as a broader contribution to debate.
7.1 4D Planning software tools
With the emergence of 4D CAD as a tool to assist the visualisation of
construction project plans, various software packages have been developed. However most of these concentrate on the utilisation of 4D CAD as a
visualisation tool, rather than something that can be used for analytical purposes. Typically, they build the product breakdown structure (PBS) through time, rather than visualise the progress with the work breakdown structure (WBS), and are, therefore, dumb with respect to process. The 3½D visualisation tools developed in the VIRCON project are an interface to allow the construction planner to visualise space usage at various points during the programme. This section presents a technical review of existing 4D
visualisation software packages with the 3½D visualisation packages produced during the VIRCON project.
Schedule Simulator – Bentley Systems
The Bentley Schedule Simulator emerged from the PlantSpace Schedule Simulator initially developed by Jacobus Technology. The schedule simulator uses the Bentley Enterprise Navigator 3D environment to perform 3D graphic simulations of the construction process. Raw 3D design data can be
imported from various CAD based design packages. The schedule data can be obtained from either Primavera Project Planner (P3) or Microsoft Project. To incorporate data from these packages the system utilises OLE2
Automation, dynamically linking schedule data. With this system, any amendments made to the schedule in P3 or MS Project can immediately be visualised in the 4D environment. In addition, the system also provides the option to use Open Database Connectivity (ODBC) to import schedule and CAD information.
Once the CAD and schedule information is imported or linked to the
using various relationships including one-to-one, one-to-many or many-to-many.
SmartPlant Review – Intergraph
The construction module of the SmartPlant review contains ScheduleReview. This is an engine that allows 4D simulations to be generated by linking
information from the project schedule to objects in the CAD display. The 3D objects for the simulation are generated and shown using the SmartPlant Review engine. Whilst this provides the visual elements, the temporal information can be imported and used through either Primavera Project Planner or Microsoft Project. Using Primavera Project Planner, Object Linking and Embedding (OLE) technology can be utilised for the updating of temporal activity information. This enables updated information to be directly related and visualised in the 4D simulation.
Groups of 3D CAD model elements can be defined either automatically or manually and these can then be associated with activities defined in the imported project schedule. Once associated the objects can be user defined according to their status during the simulation, for example objects not yet constructed can be displayed as wireframe whilst completed objects can be shaded.
Project Navigator 2000 – VirtualSTEP
The software is a browser-based application providing the ability to
dynamically link schedule information and AutoCAD based drawing objects to present a simulation of the construction schedule. The software utilises a central control panel as an addition to the standard Internet Explorer
browser. From here, schedule and CAD information can be entered and the critical path of the schedule can be analysed using a CPM engine. In addition to this, the user also has the ability to input resources and costs to monitor these as the project progresses.
FourDviz – BALFOUR Technologies LLC / Infinity Technologies
Within FourDviz, virtual reality objects can be generated to create the visual scene. This provides a real time environment that can be navigated by the user, allowing movement through any part of the visulaisation. In addition to the 3D creation of the objects, temporal characteristics can also be
attributed. Once a date has been attributed manually to each of the objects in the 3D world, a simulation is compiled for the duration of a specified period.
Common Point 4D
Common Point 4D is a tool that has emerged from the research activities undertaken at the Centre for Integrated Facility Engineering (CIFE) at
Stanford University, USA. This tools uses 3D IFC compliant models that can be generated from AutoCAD .dwg or .dxf formats. Schedule information is read from Primavera or Microsoft Project file formats. The linking of product to process is undertaken manually using the PBS to WBS linker tool.
The transparency of objects in the simulation can be varied to show various product groups, and objects can be manually grouped together and attached to one of multiple tasks. The time scale of the simulation can be varied to provide a level of detail and annotations can be added to each 4D product group to provide an explanation of the 3D objects during the simulation. Tasks can be edited in the 4D software in order for alternative scenarios to be investigated.
Visual Project Scheduler
VPS can import various 3D .dxf files into a common database so that objects can be reviewed. Objects in the overall model can then be broken into parts and regrouped as construction objects. The colour of objects or pieces of those objects can be changed to display specific meaning. Using an ‘Activity Wizard’, activities can be generated automatically for all 3D objects in the model by selecting objects in the sequence of construction. The number of labourers and a calculated duration will be automatically assigned if the object is assigned a construction class.
VPS can import activities and relationships from external databases. These activities can then be graphically associated to objects in a model. VPS utilizes an OpenGL rendering interface to display models as solid or wire frame images. Using a control panel the user can move in and around the model and whilst moving through a model, snap shots can be generated and saved as files. A built-in AVI generator can create video files of the output including the path taken around the model.
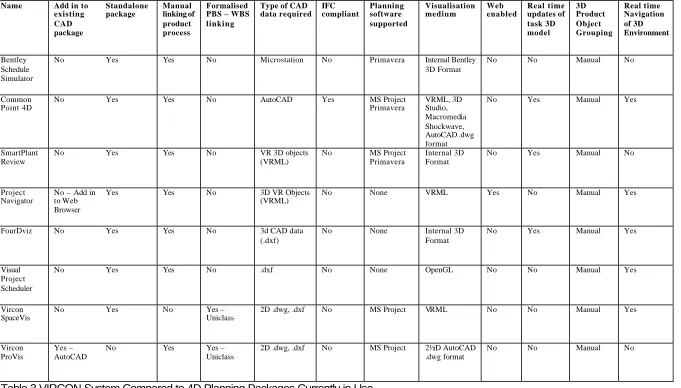
An overview of the performance of these systems compared to SpaceVis and ProVis is provided in table 3. A more detailed analysis can be found in
Name Add in to existing CAD package Standalone package Manual linking of product process Formalised PBS – WBS linking
Type of CAD data required IFC compliant Planning software supported Visualisation medium Web enabled Real time updates of task 3D model 3D Product Object Grouping Real time Navigation of 3D Environment Bentley Schedule Simulator
No Yes Yes No Microstation No Primavera Internal Bentley
3D Format
No No Manual No
Common Point 4D
No Yes Yes No AutoCAD Yes MS Project
Primavera VRML, 3D Studio, Macromedia Shockwave, AutoCAD .dwg format
No Yes Manual Yes
SmartPlant Review
No Yes Yes No VR 3D objects
(VRML)
No MS Project
Primavera
Internal 3D Format
No Yes Manual No
Project Navigator
No – Add in to Web Browser
Yes Yes No 3D VR Objects
(VRML)
No None VRML Yes No Manual Yes
FourDviz No Yes Yes No 3d CAD data
(.dxf)
No None Internal 3D
Format
No Yes Manual Yes
Visual Project Scheduler
No Yes Yes No .dxf No None OpenGL No No Manual Yes
Vircon SpaceVis
No Yes No Yes –
Uniclass
2D .dwg, .dxf No MS Project VRML No No Manual Yes
Vircon ProVis
Yes – AutoCAD
No Yes Yes –
Uniclass
2D .dwg, .dxf No MS Project 2½D AutoCAD .dwg format
No No Manual No
7.2 Multi-constraint Optimisation for Construction Project Scheduling Sriprasert and Dawood (2002) classify construction constraints into four major groups, which include:
(1) Contractual constraints – time, cost, quality, and special agreements; (2) Physical constraints – technological dependency, space, safety, and
environment;
(3) Resource constraints – availability, capacity, perfection, and continuity;
(4) Information constraints – availability and perfection.
Despite this classification of construction constraints, all previous studies in the domain of construction scheduling and optimisation appear to consider and model the problem as a trade-off between a limited set of constraints. Examples of these classical problem models are the time-cost trade-off, resource allocation, and resource levelling problems. Recently, a new
problem of time-space trade-off is becoming an important area of research in the construction industry.
The SpaceMan tool uses a “brute-force algorithm” A brute force algorithm is a systematic search strategy that does not use information about the problem to help direct the search (Bigus and Bigus 2001). ‘Brute-force’ simply means that every solution is attempted, even if logic precludes it as the goal state. It is the starting point for finding any solution before a more refined algorithm can be designed. It is a simple algorithm that requires no pre-processing phase yet requires a huge number of steps (perhaps an unfeasibly large number of steps) to complete. However, the simplest algorithm (i.e. brute-force) is sometimes the best. A good example is the victory of chess computers over grand-masters. This tends to be achieved by a ‘brute-force’ assessment of every move, rather than an ‘intelligent’ programme that more closely simulates human strategy. After all, throwing processor cycles at problems is what computers are good at.
SpaceMan’s ‘brute-force’ algorithm attempts to find an optimal solution by throwing the power of the computer at the problem, rather than designing a more elegant search strategy. In the ‘Auto-optimisation’ feature, it tries less drastic solutions initially and then moves on to modifications that may impact other tasks or resource allocations. In short, it tries permutations of task dates and spatial requirements until either a solution is found or in-built limits are reached. If it finds a solution, a message box will appear. The usual outcome is an improvement but some tasks are left overloaded. When the auto-optimisation fails, it always resets the changes that it has made to the original values (North and Winch 2002).
Optimise without changing resources :
1. Move task start and end dates within constraints of task earliest and latest start dates;
2. Move task start and end dates within constraints of space creation/destruction dates;
3. Move task start and end dates without constraints.
Optimise by changing resources :
4. Shorten task durations;
5. Reduce task spatial requirements without changing task start and end dates
Previous studies of construction space planning using constraint
optimisation, such as Zouein and Tommelein (1999); Elebeltagi et al (2001); Zouein et al (2002); and Mawdesley et al (2002), all focus on schedule-dependent site layout planning rather than the dynamic planning of task execution space. More intelligent algorithms such as genetic algorithms are employed in those studies. The SpaceMan project is, so far as we are aware, the first attempt to optimise jointly the problem of critical path and critical space dynamically, and, therefore, we believe that the use of a simple brute-force approach is justified. There are, however, limitations to this approach :
Ø The brute-force algorithm is widely criticised for its absurdly inefficient processing time especially for the size of real world construction scheduling problem. It should be noted that for a problem of 15 activities of which each activity has 15 scheduling alternatives, the size of the total search space already yields 1,307,674,368,000 possible solutions. Future research should address this problem by developing more intelligent algorithms for the optimisation of critical time and dynamic working space problem.
Ø Instead of allowing the algorithm to move task start and end dates without reference to CPA dependencies and shorten task durations, future research could maintain the relationships and consider the optimisation as the negotiation between extension of project duration and degree of space overload.
Ø The algorithm used in SpaceMan does not aim at arriving at the optimum solution but simply suggest one of the feasible solutions.
locating the globally optimal solution and therefore significantly reduces searching time and becomes feasible for the real world problems.
Several studies have successfully applied GA for optimisation problems in construction scheduling, for instance, time-cost trade-off problem (Feng et al
1997; Li et al 1999; Que 2002), resource allocation and levelling problem (Hegazy 1999), and a combination of these two problems (Leu and Yang 1999). However, none of these efforts has been able to simultaneously solve and optimise the four groups of construction constraints identified earlier. There is, therefore, a great need to develop a practicable GA-based application that is particularly capable of optimising such the complex problem. This is the subject of current doctoral research by Sriprasert.
7.3 Developments in Construction Space Scheduling Research
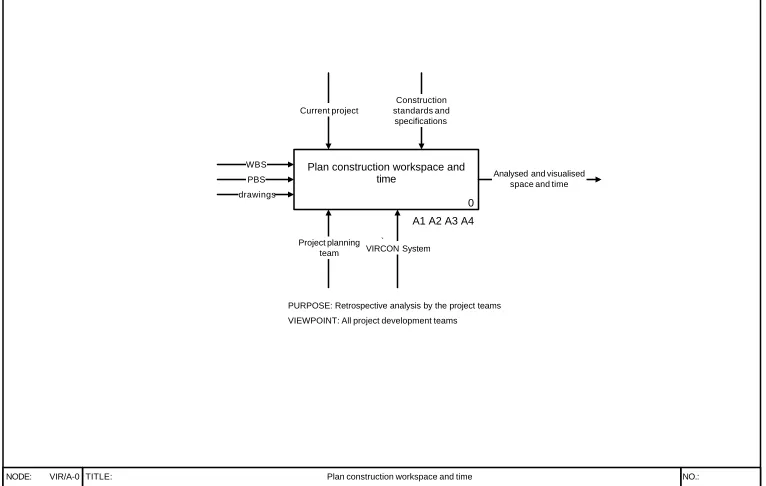
0 A1 A2 A3 A4 Plan construction workspace and
time
TITLE:
`
NODE: VIR/A-0 Plan construction workspace and time NO.:
WBS
Project planning team
PURPOSE: Retrospective analysis by the project teams
VIEWPOINT: All project development teams PBS
drawings
Analysed and visualised space and time Current project
Construction standards and specifications
VIRCON System
Figure 7 Level 0 IDEF Diagram for VIRCON System
Source : North and Winch (2003).
SightPlan its derivatives represents a sustained attempt to apply the latest modelling techniques to the problem. Much of the recent work relies genetic algorithms for analysis (e.g. Elbeltagi et al 2001; Mawdesley et al 2002; Tam
et al 2002; Tawfik et al 2002; Zouein and Tommelein 1999; Zouein et al
2002). Others such as Cheng and O’Connor have used Geographical Information Systems (GIS), while Retik and Shapira (1999) have applied Virtual Reality (VR) techniques to this problem.
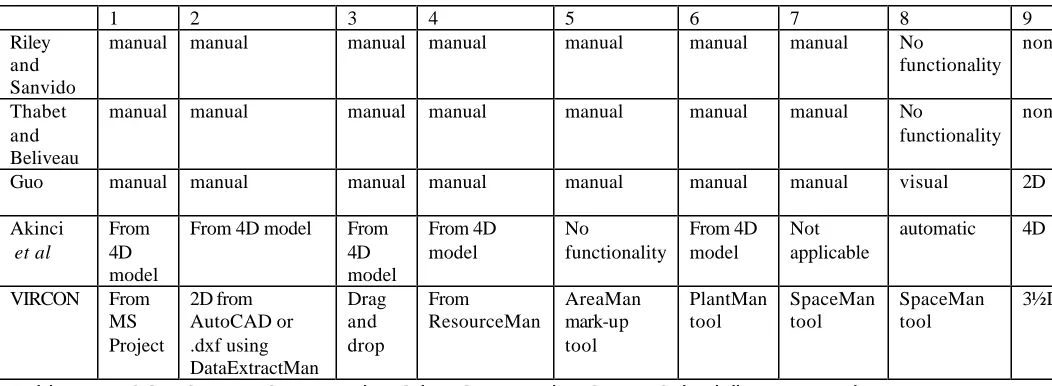
There is relatively less work on the space scheduling problem. In order to complete the process shown in figure 7, a variety of different functions have to be provided by the space scheduling system. Table 4 provides an
indicative comparison of VIRCON functionality with other recent research outputs. The numbers in the headings relate to these functionality criteria :
1. Import programme information. This is typically takes the form of a work breakdown structure (WBS i.e. the schedule of all tasks that need to be executed for the building to be completed) arrayed in a critical path network. This provides data on t.
2. Import product information. This is typically in the form of a product breakdown structure (PBS i.e. the schedule of all components that make up the completed building) arrayed in a spatial configuration. This can be in 2 dimensions, providing data on x & y, or 3 dimensions providing data on x, y, & z.
3. Import facilities information. The term “facilities” is used generically to encompass spatial data on the site installations, access platforms, lay down areas, movement paths and the like.
4. Import resource information. A library of the spatial requirements of task execution and associated materials storage, plant operations and the like needs to be available.
5. Identify available spaces at the level of the planning period. This cannot be done directly from the data at 2, because many of the product components will not be placed for most of the project life-cycle. A tool is required for manipulating product data to identify its process relevance.
6. Populate available spaces with facilities information. Overall site layout needs to be determined, and its evolution at the level of the planning period shown. This could include the output of site layout analysis.
7. Relate the planned sequence of tasks to the available space. This function is at the heart of any space scheduling tool, relating 1, 2, 3, 4, 5 and 6. Unless this is provided in an easy-to-use manner, then any other functionality is unlikely to be used by planners.
reporting. Where clash detection is achieved purely through visualisation, then the functionality is included at 9.
9. Visualise schedule information in terms of space and time. Whether this is done in 3D (x, y + t) or 4D (x ,y ,z + t) will depend on the inputs at 2.
10. Resolve spatial clashes. Functionality can be provided to propose solutions to any clashes identified at 9.
A fully specified system would handle all these functions in an IT
environment, taking data seamlessly from the appropriate input data sets, and allow analysis and visualisation within that environment. In table 4, this criterion is 11 - level of IT integration. As discussed in section 5, our requirements capture phase also identified the importance of good integration with existing systems in use by construction planners, and the data formats currently used by architects. In table 4, this criterion is 12 - level of system integration. A third issue is the planning horizon used – in essence whether the tool is a strategic planning tool at the weekly level or above to support approaches such as Last Planner, or it attempts to plan at the level of the day or less. This is criterion 13. We now turn to the individual
contributions to research in spatial scheduling, and attempt to evaluate them against these criteria.
Following the pioneering work on defining the problem and categorising space use types, Riley and Sanvido (1997) developed a methodology for spatial planning on construction sites, and then applied it to detailed planning using data collected from interviews. The methodology is captured in IDEF0 diagrams for the process “create construction sequence” which contains four sub-processes : identify required spaces; generate layouts; sequence
activities; and resolve conflicts. The outputs from each of these steps are displayed graphically. The methodology is focused on detailed planning at the daily activity level, and the data are taken from empirical cases, although the methodology was not used for actual planning on the live projects.
There are a number of limitations to this approach :
Ø The methodology is not supported by any IT ;
Ø It is not clear what the source of spatial information is, either in terms of available space or amount of required.
Ø Planning is at the daily level despite comments by more than one informant that formal planning at this level of detail was not appropriate;
Ø Only the areas enclosed by the envelope of the completed building are used in analysis.