Please Don’t Move - Evaluating Motion Artefact from pQCT Scans Using Textural Features
Timo Rantalainen1,2, Paola Chivers2,3, Belinda R Beck4, Sam Robertson5, Nicolas H. Hart2,6, Sophia Nimphius2,7, Benjamin K. Weeks4, Fleur McIntyre2,8, Beth Hands2,3, Aris
Siafarikas2,8,9,10
1 Deakin University, Geelong, Australia, Institute for Physical Activity and Nutrition (IPAN), School of Exercise and Nutrition Sciences.
2 Western Australian Bone Research Collaboration, Perth, Australia.
3Institute for Health Research, The University of Notre Dame Australia, Fremantle, Australia 4Menzies Health Institute Queensland, Bone Densitometry Research Laboratory, School of Allied Health Sciences, Griffith University, Gold Coast, Australia
5Institute for Sport, Exercise & Active Living, Victoria University, Melbourne, Australia 6Exercise Medicine Research Institute, Edith Cowan University, Perth, Australia 7School of Medical and Health Sciences, Edith Cowan University, Perth, Australia
8School of Health Sciences, The University of Notre Dame Australia, Fremantle, Australia 9 Department of Endocrinology, Princess Margaret Hospital, Perth, Australia.
10School of Paediatrics and Child Health, University of Western Australia, Nedlands, Australia
Running title: pQCT motion artefact
Address for Correspondence and Reprints:
Dr Timo Rantalainen
Deakin University, Melbourne Burwood Campus, 221 Burwood Highway, Burwood, VIC 3125, Australia
Abstract
Most imaging methods, including peripheral Quantitative Computed Tomography (pQCT), are susceptible to motion artefacts particularly in fidgety paediatric populations. Methods currently used to address motion artefact include manual screening (visual inspection) and objective assessments of the scans. However, previously reported objective methods either cannot be applied on the reconstructed image or have not been tested for distal bone sites. Therefore, the purpose of the present study was to develop and validate motion artefact classifiers to quantify motion artefact in pQCT scans. Whether textural features could provide adequate motion artefact classification performance in two adolescent datasets with pQCT scans from tibial and radial dia- and epiphysis was tested. The first dataset was split into training (66% of sample) and validation (33% of sample) datasets. Visual classification was used as the ground truth. Moderate to substantial classification performance (J48 classifier, kappa-coefficients from 0.57 to 0.80) was observed in the validation dataset with the novel texture-based classifier. In applying the same classifier to the second cross-sectional dataset, slight to fair (κ = 0.01 to 0.39) classification performance was observed. Overall, this novel
textural analysis based classifier provided moderate to substantial classification of motion artefact when the classifier was specifically trained for the measurement device and population. Classification based on textural features may be used to pre-screen obviously acceptable and unacceptable scans, with subsequent human-operated visual classification of any remaining scans.
1. Introduction
It is widely acknowledged that computed tomography scans are susceptible to methodological issues such as partial volume effect and beam hardening, operating errors such as positioning errors, and movement of the individual during a scan, the last of which manifests as movement artefact (1). While some methodological issues are unavoidable, operator errors can be minimised with training, and movement artefacts can be rectified by re-scanning. However, re-scanning is not always desirable or practical given the additional radiation dose and time required. Moreover, re-scanning may occasionally not be required as it is well-established that a limited amount of visible motion artefact does not invalidate a scan (1–5). Anecdotally, children are particularly fidgety (1) and the operator is often left with a scan that has conspicuous signs of motion artefact (streaking, discontinuity of cortical structure (1–6)) and the decision of whether or not to re-scan. The acceptable levels of motion artefact have been defined for both high-resolution (2–5) and regular computed tomography
(1). However, the method developed for regular peripheral computed tomography (pQCT) (1)
is only applicable to bone shafts and not distal or proximal bone sites with narrow cortices.
All computed tomorgraphy devices measure the sinogram, but the sinogram cannot be extracted from some devices and hence is not an applicable method in all cases. Although the agreement between raters for visual scaling is rather good for normal and high-resolution pQCT (1, 4, 5), an automated method may prove helpful in optimising consistency and reliability, particularly in very large datasets and multisite studies.
Since visual scaling is based on the appearance of the image after reconstruction, and the motion artefact typically includes streaking and discontinuities of the bone cortex (6), textural analysis could provide a suitable option for semi-quantitative detection of motion artefact from computed tomography scans in the absence of the measured sinogram. Many textural analysis approaches capturing various properties of texture in medical imaging have been presented in the literature (e.g. reviewed in (8, 9)). Of the various approaches, local binary patterns (LBP) appear particularly well-suited for motion artefact detection because LBP capture streaking in images (10), have been successfully applied in automated radiographic image measurement site annotation in the past (11), and is computationally efficient to implement (10). However, LBP has yet to be tested as a feature to quantify motion artefact.
2. Materials and Methods
The present study is a reanalysis of previously published AMPitup (12) (described below) and Griffith University Bone Densitometry Research Laboratory (13–20) datasets (described in section 2.7).
2.1.AMPitup dataset
The AMPitup Program is an exercise intervention program for adolescents with a movement disorder (21), being conducted at the University of Notre Dame Australia, and is reported as the AMPitup dataset in the present paper. The initial bone results of the program have been published previously (12). In brief, participants were aged between 12 and 18 years and were eligible for the AMPitup program if they had a Neuromuscular Development Index (NDI) of 85 or below (≤ 1SD compared to the healthy mean) (mild motor disability) using the McCarron
Assessment of Neuromuscular Development (MAND) (22, 23), and/or a history of movement difficulties (such as poor coordination or clumsiness, slowness and inaccuracy of motor skills that negatively impact daily living, school, leisure and play activities (24)). Participants with significant intellectual or physical disabilities that limited their ability to participate in the exercise program were excluded. This study was approved by the University of Notre Dame Australia Human Research Ethics Committee. Prior to enrolment, written informed consent was provided by the primary caregiver and assent was given by the adolescents.
2.2.Anthropometry
2.3.Bone assessments
Peripheral Quantitative Computed Tomography (pQCT, XCT-3000, Stratec Medizintechnik GmbH, Pforzheim, Germany) was used to evaluate cross-sections of the tibia and radius at 4% and 66% (defined from a scout view) of the tibial (from medial malleolus towards the knee joint cleft) and ulnar (from styloid process of ulna towards the olecranon) lengths from the distal endplates respectively (in-plane pixel size 0.4 x 0.4 mm, slice thickness 2.3 mm). All AMPitup participant scans were conducted at Princess Margaret Hospital for Children in the Department of Radiology, Perth, Western Australia. Participants were seated in a stationary chair, adjusted to their height. The pQCT scans were taken from the stance leg during kicking and the dominant hand used for writing.
2.4.pQCT analysis
All pQCT analyses were conducted using a custom-written Matlab (R2015b, Mathworks, Inc., Natick, MA, USA) script (see supplementary materials). A 3 x 3 median filter was applied prior to further analysis. Thereafter, cortical bone area and density were measured by creating binary masks. The first step was to identify the limb by applying a threshold of ≥ -40 mg/cm³
2.5.Motion artefact quantification
Analysis for three different motion artefact features was implemented: 1) ‘positive movement’ proposed by Blew et al. (1), 2) objective translation and rotation based on the measured sinogram per Pauchard et al. (2), and 3) novel textural analysis (using rotation invariant local binary pattern [LBPriu] histogram (25)) developed in the present study.
In brief, two thresholds, low (149 mg/cm³) and high (710 mg/cm³), were applied to quantify positive movement artefact. The number of pixels within the limb mask above the threshold was counted and multiplied by pixel area (0.4 mm x 0.4 mm) to produce cortical areas with low and high thresholds (Ct.Arlow and Ct.Arhigh, respectively). The ratio of Ct.Arlow to Ct.Arhigh was used as the positive movement motion artefact feature.
The rotation and translation measures developed by Pauchard et al. only work on the sinogram prior to reconstruction (2), and the sinogram is not stored in the files produced by the Stratec measurement system used in the present study. Instead, Stratec stores the projections recorded by the 12 detectors for each of the 15 rotational translations the device makes during scanning. The sinograms for the AMPitup dataset were reassembled from the recorded projections using the projection files from scans categorised as I (no motion artefact, section 2.6) as a calibration dataset to calculate the rotation centres of the recorded projections for each of the 12 detectors using the approach described by Azevedo et al (26). In brief, attenuation was calculated from the recorded detector values as
𝑔𝑔(𝑠𝑠,𝜃𝜃) =𝑙𝑙𝑙𝑙 �𝐼𝐼0(𝑠𝑠,𝜃𝜃)
where g = attenuation, s = position along the linear translation along a projection, 𝜃𝜃 = rotational translation for a given projection, 𝐼𝐼0= transmitted radiation (the median of detector values higher than 90% of the range of measured values was used), I = detector value. The centre of rotation was calculated based on the attenuation values for each of the 15 rotations recorded by a given detector, and the 15 projection centre of mass locations were used to solve Equation 2.
𝑠𝑠𝑟𝑟(𝜃𝜃𝑖𝑖) = 𝑐𝑐𝑠𝑠+𝑥𝑥cos𝜃𝜃𝑖𝑖 +𝑦𝑦sin𝜃𝜃𝑖𝑖 (Equation 2)
Where 𝑠𝑠𝑟𝑟= projection centre of mass, 𝜃𝜃 = rotational translation angle of a given projection, i = index of the projection, 𝑐𝑐𝑠𝑠= detector centre of rotation, and x and y are the object centre of mass coordinates. This overdetermined linear group of equations was solved using the least squares method. During experimentation it was noticed that noise in the sinogram led to a jagged centre of mass location trace and a cut-off value based on trial-and-error experimentation was utilised. It was found that setting attenuation values less than 10% of the attenuation range to zero prior to calculating the projection centres of mass produced a smooth sinogram.
The detector centres of rotations sinograms were subsequently reassembled by linearly
interpolating values from −√21 ∗ 𝑝𝑝𝑝𝑝𝑝𝑝𝑝𝑝𝑝𝑝𝑐𝑐𝑝𝑝𝑝𝑝𝑝𝑝𝑙𝑙 𝑙𝑙𝑝𝑝𝑙𝑙𝑔𝑔𝑝𝑝ℎ to √21 ∗ 𝑝𝑝𝑝𝑝𝑝𝑝𝑝𝑝𝑝𝑝𝑐𝑐𝑝𝑝𝑝𝑝𝑝𝑝𝑙𝑙 𝑙𝑙𝑝𝑝𝑙𝑙𝑔𝑔𝑝𝑝ℎ around
PLEASE INSERT FIGURE 1 AROUND HERE
The reconstructed sinogram was used to quantify translational (εT) and rotational motion (εR)
in the scans following the approach described by Pauchard et al (2). Again, 10% of the low-end attenuations were zeroed prior to further calculations. Briefly, projection centres of mass and second central moments were calculated. For εT, projection centres of mass were least
squares fitted to a sinusoid (the same equation used for centre of rotation, i.e. 𝑠𝑠𝑟𝑟(𝜃𝜃𝑖𝑖) =
𝑐𝑐𝑠𝑠+𝑥𝑥cos𝜃𝜃𝑖𝑖 +𝑦𝑦sin𝜃𝜃𝑖𝑖) and εT was calculated as the root mean squared difference between the measured and the fitted projection centres of mass. For εR projection second central
moments were calculated and least-squares fitted to Equation 3:
𝜎𝜎2(𝜃𝜃) =𝐴𝐴+𝐵𝐵cos(2𝜃𝜃) +𝐶𝐶sin(2𝜃𝜃) Equation 3
Where 𝜎𝜎2 = projection second central moment, 𝜃𝜃 = rotational translation angle, and A, B, and C are fit coefficients. εR was subsequently calculated as the root mean squared difference
between the calculated and fitted second central moments normalised to the resultant of B and C fit coefficients. εT and εR were used as the Pauchard et al. objective motion artefact
features.
described in detail in (25) and the only deviation in the present implementation was to use 10 mg/cm³ as the intensity difference (as opposed to 1 mg/cm3) in identifying the local patterns. Such modification makes the measure less sensitive to noise. LBPriu results in 10 possible local patterns for each pixel (refer (25) and supplementary material for further details) (Figure 2). A histogram of the whole image LBPriu was calculated and normalised to the number of pixels within the image resulting in a 10 bin histogram with a sum of one. The histogram was used as the textural analysis motion artefact feature.
PLEASE INSERT FIGURE 2 AROUND HERE
2.6.Developing a classifier
The bone scans were visualised and manually categorised into five levels according to the amount of visible motion artefact by one rater (TR) following the scaling reported by Blew et al. (1) (Figure 3). The five categories were subsequently recategorised as: I through III = acceptable, IV and V = unacceptable, as has been reported previously (1, 4, 7). This classification was used as the ground truth classification for subsequent machine learning classifier training and validation. All AMPitup dataset scans were computer-randomised into training and validation datasets using a 66% training 33% validation split.
PLEASE INSERT FIGURE 3 AROUND HERE
Decision tree classifiers (J48 classifier from Weka package version 3.8 (27), confidence threshold = 0.25, minimum number of instances = 2) were trained using the training dataset
objective translation and rotation, and texture-based). Decision trees were chosen as the machine learning approach due to the ease of human interpretation of the classifier. During analysis other approaches were tested. For example logistic regression, which would also offer ease of human interpretation, provided poorer classification performance. None of the other approaches matched the overall classification performance of the decision tree
classifiers, and hence the decision tree classifier results are reported.
2.7.Griffith dataset
As an additional external validation step, we applied the objective translation and rotation, and novel texture-based classifiers trained with the AMPitup training dataset to the second pQCT dataset collected in the Bone Densitometry Research Laboratory at Griffith University (QLD, Australia) (Griffith dataset). The Griffith dataset comprised scans from healthy ambulant adolescents and young adults recruited for a number of cross-sectional and prospective studies through advertisements in the local community (data previously reported in (13–20)). We extracted scans from individuals aged between 11 and 19 years-of-age to match the age-span used to train the classifier. The scan sites were, and the measurement device brand and type were the same as in the AMPitup dataset, but the in-plane voxel size was 0.5x0.5 mm. The bone scans were subsequently visualised and manually categorised for motion artefact (TR) following the procedure explained above for the AMPitup dataset.
2.8.Statistical analysis
kappa-coefficients (< 0 poor, 0.00 – 0.20 slight, 0.21 – 0.40 fair, 0.41 – 0.60 moderate, 0.61-0.80 substantial, ≥0.81 almost perfect (28)) from the validation datasets were presented to describe classification performance.
3. Results
3.1.AMPitup dataset
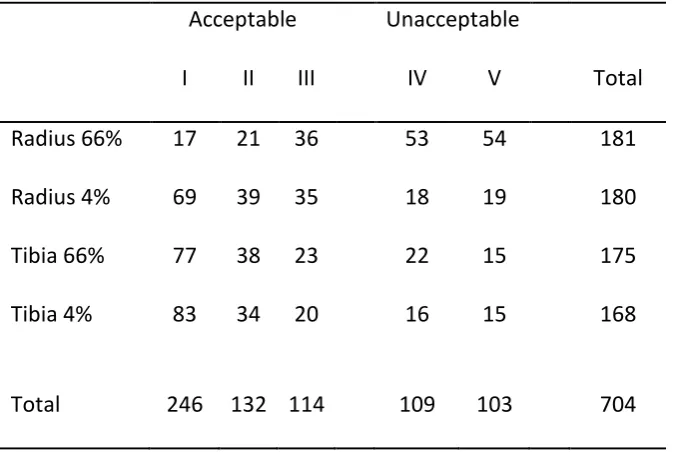
A total of 704 scans (for measurement sites, see Table 1) from N = 16 girls/women, and N = 28 boys/men aged 12 to 18 years-of-age (age = 14.5 (SD 1.4) years, height = 166 (11) cm, body mass = 65.4 (17.3) kg) were analysed from the AMPitup database. Some individuals had been scanned on multiple occasions and one or more bone sites may have been scanned more than once at the same visit (e.g. if motion artefact was noticed). The split of different visual motion artefact classifications for the four bone sites is given in Table 1.
PLEASE INSERT TABLE 1 AROUND HERE
PLEASE INSERT TABLE 2 AROUND HERE
3.2.Griffith dataset
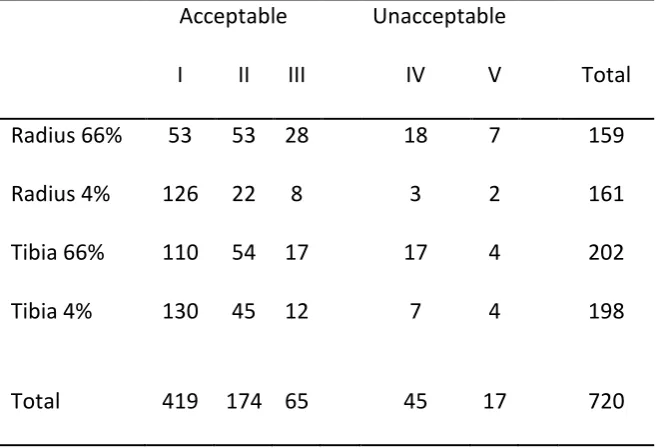
A total of 720 scans (for a split between measurement sites see Table 3) from N = 88 girls/women, and N = 116 boys/men aged 11 to 19 years-of-age (height = 164 (12) cm, body
mass = 56.5 (17.7) kg) were analysed. Some individuals had been scanned on multiple occasions and one or more bone sites may have been scanned more than once at the same visit (e.g. if motion artefact was noticed). The split of different visual motion artefact classification for the four bone sites is given in Table 3.
PLEASE INSERT TABLE 3 AROUND HERE
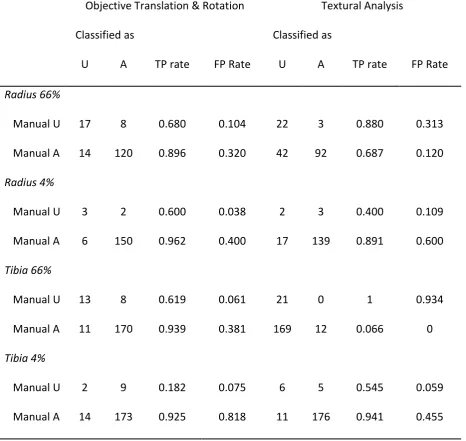
At the 66% radial shaft, the objective translation and rotation classifier trained on AMPitup data identified 86% (κ = 0.52), and textural analysis classifier identified 72% (κ = 0.35) of the Griffith dataset correctly (Table 4). The corresponding values for 4% distal radius were 95% (κ = 0.40) and 88% (κ = 0.23), respectively. For the 66% tibial shaft, the objective translation and
rotation classifier trained on AMPitup data identified 91% (κ = 0.53), and textural analysis classifier identified 16% (κ = 0.01) of the Griffith dataset correctly. The corresponding values at 4% distal tibia were 88% (κ = 0.09) and 92% (κ = 0.39), respectively.
4. Discussion
The aim of the current work was to examine classification performance of three methods of quantifying motion artefact from pQCT scans. We found that our novel textural analysis based classifier outperformed or was on par with both the positive motion (suggested by Blew et al.
(1)) and the objective translation and rotation (developed by Pauchard et al. (2)) based
classifiers at three of four bone sites. In contrast, at the tibial shaft (66% site), both of the pre-existing motion artefact feature-based classifiers outperformed the novel texture-based classifier developed in the present study. Application of the novel texture-based classifier to an independent dataset with similar participant characteristics to the training dataset resulted in overall poor classification performance, suggesting that the classifier is sensitive to variations in the relative area of the scan. That is, the proportion of area taken up by the limb varies depending on the site of the scan, which affects the proportion of various textural features captured by the LBPriu histogram and affects the classification.
As reports of previous attempts to develop an objective measure for automated motion artefact classification have not included true or false positive rates, or confusion matrices (1, 4), it is difficult to compare the present results to the existing literature. In the present study,
evaluate this somewhat unexpected finding in more detail we replicated Yang et al. (6) motion artefact simulation (please see Figure 4 for visualisation and supplementary material for the implementation). In line with Yang et al. (6) we observed that with the same amount of rotation or translation, motion artefact was more easily visually discernible at the shaft compared to distal bone sites (Figure 4). Because manual classification used as the ground truth is based on visual information this could explain why our novel texture-based classifier exhibited better classification performance in comparison with the objective translation and rotation classifier.
PLEASE INSERT FIGURE 4 AROUND HERE.
measurement protocols between laboratories. The AMPitup dataset did not contain anything other than the measured limb in the distal tibia scan, whereas some Griffith dataset scans had a support visible in the distal tibia scan. All of the scans with the support were classified as having motion artefact due to the projection centres of mass becoming non-smooth due to the support. This could be a side-effect of the way the projection centres were calculated and the need to set the value of paths through air to a constant or possibly attributable to a beam hardening effect, although we did not explore this in detail. The end result was a discontinuity in the projection centres of mass and subsequent increased value of the objective translation estimates. Otherwise on the other measurement sites, the objective translation and rotation method performed well when applied to the external validation dataset and thus may be relatively independent of the specific measurement device and measurement parameters used for the scan.
extracting the projections from a reconstructed scan by taking a radon transform, the approach developed by Pauchard et al. (2) only works on the sinogram prior to reconstruction (computed tomography images are reconstructed from the recorded projections with filtered back projection, which is typically implemented with an inverse radon transform). On the other hand, the novel texture-based method developed in the present study operates on the reconstructed scan and does not need access to the sinogram.
The primary limitation of the proposed texture-based method pertains to the relatively large proportion of the scan filled by air. This part of the image contains noise, and as can be seen in Figure 2, contributes significantly to the overall LBPriu histogram used as the textural feature in the present study. During development of the method, limiting the textural analysis to the limb area was tested by only including the limb mask pixels in the LBPriu histogram, but this did not result in observed improvements in the classification (the opposite in fact, presumably because motion-caused streaking is obvious in the area filled by air as well). An additional limitation was the use of only one human-classifier for the ground truth, although this was considered sufficient to explore whether textural analysis could provide a feasible classification approach for motion artefact.
Conflict of interest statement
None of the authors have conflicts of interest to report.
Acknowledgements
This project was supported through the Australian Government’s Collaborative Research Networks (CRN) program and the WA Department of Health FutureHealth WA First Year Initiatives – Mentoring Grant 2016. The AMPitup program was in part supported by a generous grant of the Princess Margaret Hospital Foundation.
References
1. Blew RM, Lee VR, Farr JN, Schiferl DJ, Going SB. 2014 Standardizing Evaluation of pQCT Image Quality in the Presence of Subject Movement: Qualitative Versus Quantitative Assessment. Calcif Tissue Int. 94:202–211.
2. Pauchard Y, Ayres FJ, Boyd SK. 2009 Measuring patient motion in HR-pQCT, p. 338– 341. In 2009 IEEE International Symposium on Biomedical Imaging: From Nano to Macro.
3. Pauchard Y, Ayres FJ, Boyd SK. 2011 Automated quantification of three-dimensional subject motion to monitor image quality in high-resolution peripheral quantitative computed tomography. Phys Med Biol. 56:6523.
4. Pauchard Y, Liphardt A-M, Macdonald HM, Hanley DA, Boyd SK. 2012 Quality control for bone quality parameters affected by subject motion in high-resolution peripheral quantitative computed tomography. Bone. 50:1304–1310.
5. Pialat J, Burghardt AJ, Sode M, Link TM, Majumdar S. 2012 Visual grading of motion induced image degradation in high resolution peripheral computed tomography: Impact of image quality on measures of bone density and micro-architecture. Bone. 50:111–118. 6. Yang C-K, Orphanoudakis SC, Strohbehn JW. 1982 A simulation study of motion
artefacts in computed tomography. Phys Med Biol. 27:51.
7. Wong AKO. 2016 A comparison of peripheral imaging technologies for bone and muscle quantification: a technical review of image acquisition. J Musculoskelet Neuronal Interact. 16:265–282.
8. Castellano G, Bonilha L, Li LM, Cendes F. 2004 Texture analysis of medical images. Clin Radiol. 59:1061–1069.
9. Scalco E, Rizzo G. 2016 Texture analysis of medical images for radiotherapy applications. Br J Radiol. 90:20160642.
10. Pietikäinen M, Hadid A, Zhao G, Ahonen T. 2011 Computer Vision Using Local Binary Patterns. Springer London, London.
11. Ko BC, Lee J, Nam J-Y. 2012 Automatic medical image annotation and keyword-based image retrieval using relevance feedback. J Digit Imaging. 25:454–465.
12. Hands B, Chivers P, McIntyre F, et al. 2015 Peripheral quantitative computed tomography (pQCT) reveals low bone mineral density in adolescents with motor difficulties. Osteoporos Int. 26:1809–1818.
13. Weeks BK, Beck BR. 2012 Twice-weekly, in-school jumping improves lean mass, particularly in adolescent boys. Pediatr Obes. 7:196–204.
15. Weeks BK, Hirsch RD, Moran D, Beck BR. 2011 A useful tool for analysing the effects of bone-specific physical activity. Salud Cienc. 18:538–542.
16. Weeks BK, Beck BR. 2010 The Relationship between Physical Activity and Bone during Adolescence Differs according to Sex and Biological Maturity. J Osteoporos. 2010:1–9. 17. Nogueira RC, Weeks BK, Beck BR. 2014 An in-school exercise intervention to enhance
bone and reduce fat in girls: The CAPO Kids trial. Bone. 68:92–99.
18. Rantalainen T, Weeks BK, Nogueira RC, Beck BR. 2015 Effects of bone-specific physical activity, gender and maturity on tibial cross-sectional bone material distribution: a cross-sectional pQCT comparison of children and young adults aged 5–29years. Bone. 72:101–108.
19. Nogueira RC, Weeks BK, Beck BR. 2015 Targeting Bone and Fat with Novel Exercise for Peripubertal Boys: The CAPO Kids Trial. Pediatr Exerc Sci. 27:128–139.
20. Rantalainen T, Weeks BK, Nogueira RC, Beck BR. 2016 Long bone robustness during growth: A cross-sectional pQCT examination of children and young adults aged 5-29years. Bone. 93:71–78.
21. McIntyre F, Chivers P, Larkin D, Rose E, Hands B. 2015 Exercise can improve physical self perceptions in adolescents with low motor competence. Hum Mov Sci. 42:333–343. 22. McCarron LD. 1997 McCarron assessment of neuromuscular development, 3rd ed.
McCarron-dial Systems Inc, Dallas, TX.
23. Hands B, Larkin D, Rose E. 2013 The psychometric properties of the McCarron Assessment of Neuromuscular Development as a longitudinal measure with Australian youth. Hum Mov Sci. 32:485–497.
24. American Psychiatric Association. 2013 Diagnostic and statistical manual of mental disorders (DSM-5). American Psychiatric Association, Washington, DC.
25. Ojala T, Pietikainen M, Maenpaa T. 2002 Multiresolution gray-scale and rotation invariant texture classification with local binary patterns. IEEE Trans Pattern Anal Mach Intell. 24:971–987.
26. Azevedo SG, Schneberk DJ, Fitch JP, Martz HE. 1990 Calculation of the rotational centers in computed tomography sinograms. IEEE Trans Nucl Sci. 37:1525–1540. 27. Hall M, Frank E, Holmes G, Pfahringer B, Reutemann P, Witten IH. 2009 The WEKA
data mining software: an update. ACM SIGKDD Explor Newsl. 11:10–18.
FIGURE LEGENDS
Figure 1. Sample of the recorded projection detector values, and a corresponding reconstructed attenuation sinogram.
Figure 2. Visualisation of rotation invariant local binary patterns used to capture textural information from a tibial shaft slice with clear visible motion artefact. Left:, the original image image prior to any processing; right: LBPriu of the image.
Figure 3. Sample image of the five motion artefact classification (I through V following Blew et al. 2014 classification (1)) for each of the different bone sites (radius 4%, radius 66%, tibia 4% and tibia 66%).
TABLES
Table 1. AMPitup dataset motion artefact classifications.
Acceptable Unacceptable
I II III IV V Total
Radius 66% 17 21 36 53 54 181
Radius 4% 69 39 35 18 19 180
Tibia 66% 77 38 23 22 15 175
Tibia 4% 83 34 20 16 15 168
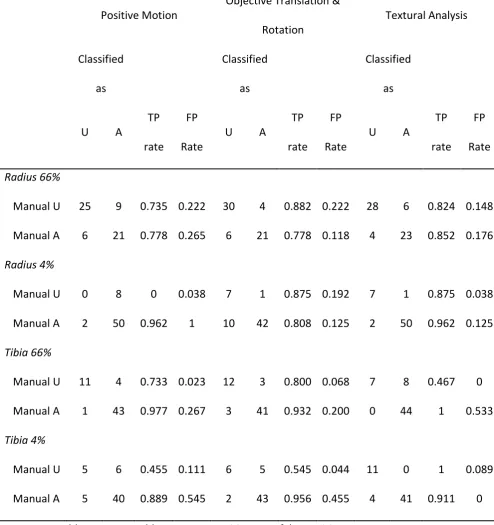
Table 2. Confusion matrices, true (TP) and false (FP) positive rates for positive motion, objective translation and rotation, and textural analysis J48 decision tree classifiers on the AMPitup validation data.
Positive Motion Objective Translation &
Rotation Textural Analysis
Classified as Classified as Classified as
U A TP
rate
FP
Rate U A
TP rate
FP
Rate U A
TP rate
FP Rate
Radius 66%
Manual U 25 9 0.735 0.222 30 4 0.882 0.222 28 6 0.824 0.148 Manual A 6 21 0.778 0.265 6 21 0.778 0.118 4 23 0.852 0.176
Radius 4%
Manual U 0 8 0 0.038 7 1 0.875 0.192 7 1 0.875 0.038
Manual A 2 50 0.962 1 10 42 0.808 0.125 2 50 0.962 0.125
Tibia 66%
Manual U 11 4 0.733 0.023 12 3 0.800 0.068 7 8 0.467 0 Manual A 1 43 0.977 0.267 3 41 0.932 0.200 0 44 1 0.533
Tibia 4%
Manual U 5 6 0.455 0.111 6 5 0.545 0.044 11 0 1 0.089
Manual A 5 40 0.889 0.545 2 43 0.956 0.455 4 41 0.911 0
Table 3. Griffith dataset motion artefact classifications.
Acceptable Unacceptable
I II III IV V Total
Radius 66% 53 53 28 18 7 159
Radius 4% 126 22 8 3 2 161
Tibia 66% 110 54 17 17 4 202
Tibia 4% 130 45 12 7 4 198
Table 4. Confusion matrices, true (TP) and false (FP) positive rates for positive rates for objective translation and rotation, and textural analysis J48 decision tree classifiers on the Griffith dataset.
Objective Translation & Rotation Textural Analysis
Classified as Classified as
U A TP rate FP Rate U A TP rate FP Rate
Radius 66%
Manual U 17 8 0.680 0.104 22 3 0.880 0.313
Manual A 14 120 0.896 0.320 42 92 0.687 0.120
Radius 4%
Manual U 3 2 0.600 0.038 2 3 0.400 0.109
Manual A 6 150 0.962 0.400 17 139 0.891 0.600
Tibia 66%
Manual U 13 8 0.619 0.061 21 0 1 0.934
Manual A 11 170 0.939 0.381 169 12 0.066 0
Tibia 4%
Manual U 2 9 0.182 0.075 6 5 0.545 0.059
Manual A 14 173 0.925 0.818 11 176 0.941 0.455