Performance Measure of Hard c-means,Fuzzy
c-means and Alternative c-means Algorithms
Binoda Nand Prasad*, Mohit Rathore**, Geeta Gupta***, Tarandeep Singh****
*Guru Gobind Singh Indraprastha University, Sector 16C, Dwarka, Delhi, INDIA
**
Amity University, Sector 125, Noida, UP, INDIA 201313
*** VGAM Information Systems Private Limited,
SCF-38, 2nd Floor, Huda Market -2, Sector 19, Faridabad, Haryana INDIA 121002
****Guru Gobind Singh Indraprastha University, Sector 16C, Dwarka, Delhi, INDIA
Abstract: Clustering analysis can be used to classify the objects into subsets with similar attributes. The main objective of clustering techniques is to group the data points in a multi-attribute dataset such that the similarities are maximized within the same cluster and minimized between different clusters. It is a branch in multivariate analysis and an unsupervised learning in pattern recognition. In the active field of research, numerous classic clustering algorithms have been used. However, these algorithms have their own disadvantages as reported by recent studies. FCM has been shown to have better performance than HCM. FCM has become the most well-known and powerful method in cluster analysis. However, these FCM algorithms have considerable trouble in a noisy environment and inaccuracy with a large number of different sample sized clusters. A good clustering algorithm should be robust and able to tolerate these situations that often happen in real application systems.
Here in our work we analyse the data set by using k-means and fuzzy c-means clustering in which Euclidean Distance is used. After that we use a new metric norm instead of Euclidean Distance with k-means and fuzzy c-means and analyse the same data set. After analysis we found that this new metric is more robust than Euclidean Norm. These two algorithms are called alternative hard c-means (AHCM) and alternative fuzzy c-means (AFCM) clustering algorithms. After analysing these alternative types of c-means clustering on data set, we found that they have more robustness than c-means clustering. Numerical results show that AHCM has better performance than HCM and AFCM is better than FCM as far as time complexity is concerned.
Key words: Hard c-means (or k-means), fuzzy c-means (FCM), New Metric Norm, Alternative c-means (AHCM, AFCM), Time complexity.
INTRODUCTION
There are so many real life problems for that we have to find out the solutions for example Automated Speech Recognition, Finger Print Identification, Optical Character Recognition, DNA Sequence Identification, Image Processing, Business, Geology and many more, for which we have to design and build the machines that can recognizepatterns.Pattern recognition is basically an approach of taking the raw data and taking an action based on the category of the pattern [1]. This approach is basically
used to extract the unknown pattern from the large set of data for business as well as real time applications. The raw, unlabelled data from the large volume of dataset can be classified initially in an unsupervised fashion by using cluster analysis i.e. clustering the assignment of a set of observations into clusters so that observations in the same cluster may be in some sense be treated as similar. The main objective of clustering techniques is to group the data points in a multi-attribute or multivariate dataset such that the similarities are maximized within the same cluster and minimized between different clusters. Data clustering analysis can be used as a stand-alone data mining tool, or as a pre-processing step for other data mining algorithms. In this active field of research, numerous classic clustering algorithms have been widely-used, such as partitioning, hierarchical, density-based, model-based, grid-based and soft-computing methods. However, these algorithms have their own disadvantages as reported by recent studies. The performance of clustering is determined not only by the geometrical shapes and densities of the individual clusters but also by spatial relations and distances among the clusters [3]. It is hard to find a traditional clustering algorithm with high performance of clustering, robustness, fast convergence and simple parameter settings. Many fusion clustering algorithms [4-5] have been presented by researchers to overcome the main drawbacks of traditional algorithms and obtain better clustering results. Traditional clustering methods use hard partitioning based on classical set theory, which assumes that an object either belongs or does not belong to a cluster. However, in many real world situations, fuzzy clustering is more natural than hard clustering, it allows objects to belong to several clusters simultaneously, but is with different degrees of membership. Fuzzy c-means (FCM) proposed by Dunn [6] in 1973 and generalized by Bezdek [7] in 1981 has been successfully used in a wide variety of real world problems. The traditional FCM algorithm gets the optimal solution by minimizing the objective function.
Most clustering methods use distance measures to determine similarity or dissimilarity between any pair of objects. Meanwhile, the commonly used Euclidean norm can only identify clusters with similar sizes and densities, and become inaccurate in a noisy environment [8]. To overcome the above defects, we replace the Euclidean norm with a new metric norm in HCM and FCM clustering algorithms, and then we have analysed these HCM, FCM and Alternative c-means (AHCM, AFCM) at the data set based on their clustering efficiency.
K-Means Clustering [10, 11, 12]
K-means or Hard c-means clustering is basically a partitioning method applied to analyse data and treats observations of the data as objects based on locations and distance between various input data points. Partitioning the objects into mutually exclusive clusters (k) is done by it in such a fashion that objects within each cluster remain as close as possible to each other but as far as possible from objects in other clusters.
Each cluster is characterized by its centre point i.e. centroid. The distances used in clustering in most of the times do not actually represent the spatial distances. In general, the only solution to the problem of finding global minimum is exhaustive choice of starting points. But use of several replicates with random starting point leads to a solution i.e. a global solution. In a dataset, a desired number of clusters K and a set of k initial starting points, the K-Means clustering algorithm finds the desired number of distinct clusters and their centroids. A centroid is the point whose coordinates are obtained by computing the average of each of the coordinates of the points of samples assigned to the clusters.
Algorithmic steps for K-Means clustering [13]
Step-1) Set K – To choose a number of desired clusters, K. Step-2) Initialization – To choose k starting points which are used as initial estimates of the cluster centroids. They are taken as the initial starting values.
Step-3) Classification – To examine each point in the data set and assign it to the cluster whose centroid is nearest to it. This can be done by calculating the Euclidean distance between the points.
Step-4) Centroid calculation – When each point in the dataset is assigned to a cluster, it is needed to recalculate the new k centroids.
Step-5) Convergence criteria – The steps of (iii) and (iv) require to be repeated until no point changes its cluster assignment or until the centroids no longer move.
Finally, this algorithm aims at minimizing an objective function, in this case a squared error function. The objective function:-
‖ ‖
Where, ‖ ‖ is a chosen distance measure between a data point and the cluster centre , is an indicator of the distance of the n data points from their respective cluster centres.
FCM Clustering Algorithm [14]
Fuzzy c-means (FCM) is a method of clustering which allows one piece of data to belong to two or more clusters. This method is developed by Dunn in 1973 and improved by Bezdek in 1981 and is frequently used in pattern recognition.
FCM clustering algorithm is different from hard clustering algorithms. The membership of an object in a hard cluster is Boolean. In other words, an object either belongs or does not belong to a cluster. However, the fuzzy clustering allows each object to belong to several clusters with associated membership degree values from 0 to 1. FCM algorithm is based on the minimization of an objective function called c-means function [6]:
, , ∑ ∑ , 1
Where, V = , , … … … …, , is the matrix of cluster centers to be determined, X is the matrix of input data points, U is the matrix of fuzzy membership degree values, is the number of clusters, and is the number of input data points. The distance between each data point and cluster center is denoted by Euclidean norm:
, ‖ ‖ 2
In Eq. (1), is the of d-dimensional measured data, m is any real number greater than 1 that is 1 ≪ ≪ ∞), is the cluster center, is the membership degree value of data point belonging to cluster and
1 3
Thus for ∀ , and weighted exponent 1, the necessary condition for minimizing Eq. (1) can be derived as
‖ ‖ , 4
∑
∑ 5
Where, 1 , 1
During the clustering process, the FCM clustering algorithm searches for optimal clustering centers and membership degrees by minimizing the objective function iteratively.
A New Metric [8]
, 1 ‖ ‖ , 6 Where is a constant which can be defined by:-
1 ‖ ̅‖ ,
With ̅ ∑ .
Using this new metric norm, the alternative hard c-means (AHCM) and alternative fuzzy c-means (AFCM) clustering objectives functions are modified as:-
Alternative hard c-means (AHCM) clustering [8] A good clustering method will cluster data set
, … … … … , into well partitions with 2
1. Since we have no priori information about unlabelled data set , a reasonable criteria or objective function is important for a clustering method. Intuitively, each cluster shall be as compact as possible. Thus, a well-known hard c-means (HCM) clustering objective function is created with the Euclidean norm as
∈
,
Where, is the cluster center. The necessary condition of minimizing is
∑∈
| |
Where, is in the index set if is minimum of , … … . , .
As we know that, the Euclidean norm is sensitive to noise or outliers. Hence HCM clustering algorithm is affected by noise and outliers. Therefore, new metric norm is proposed to replace the Euclidean norm in the HCM objective function. Thus, an alternative hard c-means (AHCM) clustering objective function is proposed as
1
∈
,
Where is a constant which can be defined by:-
∑ ̅ ,
With ̅ ∑ .
And ∈ if
1
min 1 1, … … … … ,
Now, the necessary condition of minimizing AHCM objective function is as follows:
∑∈
∑∈
. 7
AHCM Algorithm [8]
Let be the right term of the Eq. (7) and set the iteration counter 0 and choose the initial values
, 1, … … , . 0.
Step 1. Classify data points by assigning them to the class of smallest distance measure using
, 1
Step 2. Find .
max , ;
1 1 .
Alternative fuzzy c-means (AFCM) clustering [3, 8]
Using this new metric, the alternative fuzzy c-means (AFCM) clustering objective function is modified as
, ,
1 ‖ ‖ . 8
The necessary condition for minimizing objective function Eq. (8) is updated as
1 ‖ ‖
1 9
∑ ‖ ‖
∑ ‖ ‖ , 10
1 , 1
The proposed AFCM minimizes the objective function by iterations which is similar to FCM in clustering process, however it is more robust to noise and outliers and more tolerable to unequal sized clusters.
IMPLEMENTATION
Anderson’s Iris data) is a multivariate dataset introduced by Sir Ronald Fisher (1936) as an example of discriminant analysis.
It can be downloaded from the UCI Machine Learning
Repository at http://www.ics.uci.edu/~mlearn/MLRepository.html. There
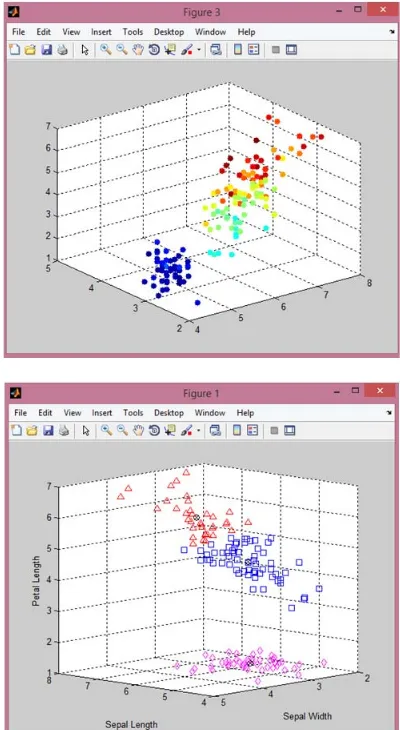
are three categories in the data set (i.e., iris setosa, iris versicolor and iris virginical), each having 50 patterns with four features [i.e., sepal length, sepal width, petal length, and petal width]. Iris setosa can be linearly separated from iris versicolor and iris virginical, while iris versicolor and iris virginical are not linearly separable. Fig. (1) Depicts the clustering result with a standard K-means algorithm. It is clear to see that K-means can correctly differentiate iris setosa from the other two iris plants.
Dataset Size No. of attributes No. of classes Iris 150 4 3
Table (1):- Iris Flower Plant Dataset.
Implementation of HCM (k-means clustering) [15]
The matlab function kmeans performs K-Means clustering by using an iterative algorithm that assigns objects to clusters so that the sum of distances from each object to its cluster centroid, over all clusters, is a minimum.
IDX = kmeans(X, K) partitions the points in the N-by-P data matrix X into K clusters. This partition minimizes the sum, over all clusters, of the within cluster sums of point-to-cluster centroid distances. Rows of X correspond to points, columns correspond to variables. When X is a vector, K-means treats it as an N-by-1 data matrix, regardless of its orientation. K-means returns an N-by-1 vector IDX containing the cluster indices of each point. By default, K-means uses squared Euclidean distances.
Used on Fisher's iris data, it will find the natural groupings among iris specimens, based on their sepal and petal measurements. With K-means clustering, we must specify the number of clusters that we want to create.
Following scattered K-Means graph for iris data set (sepal length, sepal width and petal length) represents three clusters.
Fig. (1):- Scattered K-Means graph of iris dataset for three clusters
The kmeans function begins the clustering process using a randomly selected set of initial centroid locations. Just as in many other types of numerical minimizations, the solution that kmeans reaches sometimes depends on the starting points, and it is possible for it to reach a local minimum, where reassigning any one point to a new cluster would increase the total sum of point-to-centroid distances, but in order to find out that where a better solution exist, you can use the optional 'replicates' parameter. When you specify more than one replicate, kmeans repeats the clustering process starting from different randomly selected centroids for each replicate.
Here, the output shows that, even for this relatively simple problem, non-global minima do exist. Each of these five replicates began from a different set of initial centroids. Depending on where it started from, kmeans reached one of two different solutions. However, the final solution that a kmeans return is the one with the lowest total sum of distances, over all replicates. The third output argument contains the sum of distances within each cluster for that best solution.
Implementation of Fuzzy C-Means Clustering
The matlab function fcm performs FCM clustering [15]. The function fcm takes a data set and a desired number of clusters and returns optimal cluster centers and membership grades for each data point. It starts with an initial guess for the cluster centers, which are intended to mark the mean location of each cluster. The initial guess for these cluster centers is most likely incorrect. Next, fcm assigns every data point a membership grade for each cluster.
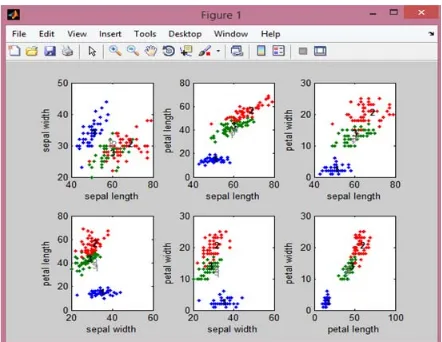
By iteratively updating the cluster centers and the membership grades for each data point, fcm iteratively moves the cluster centers to the right location within a data set. This iteration is based on minimizing an objective function that represents the distance from any given data point to a cluster center weighted by that data point's membership grade. The dataset is obtained from the data file 'iris.dat' [16]. From each of the three groups (setosa, versicolor and virginica), two characteristics (for example, sepal length vs. sepal width) of the flowers are plotted in a 2-dimensional plot.
Fig.2. Scattered Fuzzy C-Means graph of iris dataset for three clusters
Fig. (3):- Scattered Fuzzy C-Means graph with initial and final fuzzy cluster centers.
FCM clustering is an iterative process. The process stops when the maximum number of iterations is reached, or when the objective function improvement between two consecutive iterations is less than the minimum amount of
improvement specified. For iris dataset comprising of 18 total iteration count results a total objective function equals to 60.505711. The total elapsed time is 0.300550 seconds. The figure shows the initial and final fuzzy cluster centers. The bold numbers (1, 2, 3) represent the final fuzzy cluster centers obtained by updating them iteratively.
RESULTS OF THIS EXPERIMENT
This experiment reveals the fact that K-Means clustering algorithm consumes less elapsed time i.e. 0.210875 seconds than FCM clustering algorithm which takes 0.300550 seconds. On the basis of the result drawn by this experiment we can say that K-Means clustering algorithm is less time consuming than FCM algorithm.
Comparison of Time Complexity of K-Means and FCM As we know that the time complexity of K-means [1, 17] is
and time complexity of FCM [17] is . When we will keep the number of data points and number of iteration constant that is, n=150 (as our Iris dataset has 150 data points), d = 4 and = 20 and we make the cluster varying. Here n = number of data points, c=number of cluster, d = number of dimension and = number of iterations. The following table and graph represents the comparison in details.
Algorithm Time Complexity Elapsed Time (sec.)
K-Means 0.210875
FCM 0.300550
Table (2):- Comparison between K-means and FCM with respect to Elapsed Time.
S. No.
Number of Cluster
K-Means Time Complexity
FCM Time Complexity
1 1 12000 12000
2 2 24000 48000
3 3 36000 108000
4 4 48000 192000
5 5 60000 300000
Table (3):- Time Complexity of K-means and FCM when we kept , , and make the Number of
cluster varying.
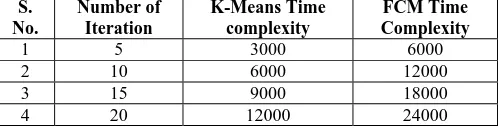
Now, I am going to keep the number of cluster constant and let us assume that 150, 2 2 and make the varying. By doing so we get the following results:-
S. No.
Number of Iteration
K-Means Time complexity
FCM Time Complexity
1 5 3000 6000
2 10 6000 12000
3 15 9000 18000
4 20 12000 24000
Table (4):- Time Complexity of K-means and FCM when we kept , , and make the Number of
iteration varying.
Fig. (5):- Time complexity of K-Means and FCM by varying number of iterations.
Inter-Cluster Distance and Intra-Cluster Distance of the Clusters:-
Here I am going to calculate the Inter-Cluster Distance and Intra-Cluster Distance to evaluate the clustering results and to compare the efficiency of the clustering algorithms.
Inter-Cluster Distance
Inter-Cluster Distance basically specifies the distance between the centroids of the clusters.
As we know that, the main objective of the clustering is to maximize the distance between the clusters so that the objects of different clusters are as dissimilar as possible. Therefore, the maximum value of Inter-Cluster distance shows that the objects of different clusters are more dissimilar.
Intra-Cluster Distance
Intra-Cluster Distance specifies the distance between the data vectors within a cluster.
1
‖ ‖
As we know that, the main objective of the clustering is to minimize the distance the cluster so that the objects of a cluster are as similar as possible. Therefore, the minimum value of Intra-Cluster distance shows that the objects within a cluster are more similar.
Table (5) Comparison of K-Means and FCM
Dataset Clustering
Algorithm
Fitness Value
Inter-Cluster Distance
Intra-Cluster
Distance Elapsed Time Accuracy (%)
Iris Flower Plant
K-Means 78.9788 8.7277 31.1403 0.210875 88%
FCM 60.5057 9.8889 364.2773 0.300550 90%
AFCM 08.6058 9.4488 356.5845 0.422565 91.57%
REFERENCES
[1] R.O. Duda, P.E. Hart, Pattern Classification and Scene Analysis, Wiley, New York, 1973.
[2] A.K. Jain, R.C. Bubes, Algorithm for Clustering Data, Prentice-Hall, Englewood Cliffs, NJ, 1988.
[3] J. Shanghai Jiaotong Univ. (Sci.), Research of Improved Fuzzy c-means Algorithm Based on a New Metric Norm2015, 20(1): 51-55 [4] Sulaiman S N, Isa N A M. Adaptive fuzzy-K-means clustering
algorithm for image segmentation [J]. IEEE Transactions on Consumer Electronics, 2010, 56(4): 2661-2668.
[5] Li J, Fan H, Yuan D, et al. Kernel function clustering based on ant colony algorithm [C]// Proceedings of the 4th International Conference on Natural Computation. Jinan, China: IEEE, 2008: 1-5. [6] Dunn J C. A fuzzy relative of the ISODATA process and its use in
detecting compact well-separated clusters [J]. Cybernetics and Systems, 1973, 3(3): 32-57.
[7] Bezdek J C. Pattern recognition with fuzzy objective function algorithms [M]. New York: Plenum Press, 1981: 10-16.
[8] Wu K L, Yang M S. Alternative c-means clustering algorithms [J]. Pattern Recognition 35 (2002) 2267 – 2278
[9] Ramathilagam S, Huang Y M. Extended Gaussian kernel version of fuzzy c-means in the problem of data analysing [J]. Expert Systems with Applications, 2011, 38(4): 3793-3805.
[10] X. Hui, J. Wu and C. Jian, “K-Means clustering versus validation measures: A data distribution perspective”, IEEE Transactions on Systems, Man, and cybernetics, vol. 39, Issue-2, 2009 , pp.319-331. [11] J. Han and M. Kamber, “Data Mining: Concepts and Techniques”,
Morgan Kaufmann Publishers, 2nd ed., New Delhi, 2006.
[12] A. K. Jain, M. N. Murty and P. J. Flynn, “Data Clustering: A review”, ACM Computing Surveys, vol. 31, no. 3, 1999.
[13] T. Kanungo and D. M. Mount, “An Efficient K-means Clustering Algorithm: Analysis and Implementation”, Pattern Analysis and Machine Intelligence, IEEE Transactions on Pattern Analysis and Machine Intelligence. vol. 24, no. 7, 2002.
[14] link.springer.com/article/10.1007%2Fs12204-015-1587-x J. Shanghai Jiaotong Univ. (Sci.), Improved Fuzzy c-means Algorithm Based on a New Metric Norm2015, 20(1): 51-55 DOI: 10.1007/s12204-015-1587-x
[15] Mathworks.http://www.mathworks.com
[16] A. Asuncion and D. J. Newman, UCI Machine Learning Repository Irvine, CA: University of California, School of Information and Computer Science, 2013.