Available online:
http://edupediapublications.org/journals/index.php/IJR/
P a g e | 1961Enhancement of Ariel Images: A Review
Panta
Jaganmohan Reddy
#1, M V Narsimha Reddy
*2, P Prasanna Murali Krishna
#3#
P.G. Scholar in DECS,
*Assistant Professor,
#Associate Professor & HOD, Department of ECE
Dr. Samuel George College Institute of Engineering & Technology, Markapur, Andhrapradesh
Abstract
Satellite images or Ariel images will be experienced spot commotion because of the natural unsettling influences, for example, mist and murkiness, which will debase the visual nature of the images. Keeping in mind the end goal to discover the area or the people, somebody needs to upgrade these spotted satellite images to enhance the perceptual nature of images. Here, we had given a review on various Ariel image enhancement techniques such as interpolation algorithms, decimated wavelet with interpolation, wavelet zero padding (WZP) and hybrid wavelet decomposition (HWD). We had also analyzed the performance of various algorithms using image quality metrics such as peak signal to noise ratio (PSNR) and mean square error (MSE).
Key words: Ariel images, image enhancement, interpolation algorithms, decimated and un-decimated wavelets, WZP, Hybrid wavelet decomposition, PSNR and MSE
1.
Introduction
Recent years, there is a quick development in satellite imaging because of the interest in satellite applications, for example, climate anticipating, space science and geographical information. These images were caught with the satellite sensors which are running from low resolution to high resolution for gathering the sought information into images. Satellite imaging applications have been expanding step by step because of the interest in applications like agribusiness, oceanology, regional arranging, topography, scene, biodiversity preservation, ranger service, cartography, meteorology and fighting etc.,[1]. Keeping in mind the end goal to investigate the satellite images, we require HR satellite images yet these images will be experienced numerous elements, for example, ingestion scrambling while catching it through the satellite sensors. These commotion components will make some major issues for further handling of images in viable applications, for example, advertising, fake work, PC vision furthermore in numerous fields. Consequently, to
enhance the nature of these images by improving the visual quality is an essential and testing assignment. One must consider a few variables to choose a dot lessening algorithm for satellite imagery.
i. A digital camera must apply a clamor decrease algorithm in a small amount of a second.
ii. Whether relinquishing couple of genuine information is adequate in the event that it allows more twisting or commotion to be evacuated
Interpolation is a one of the broadly utilized strategy for improving the image, which is extremely basic and better known.
These techniques have been seared into three sections: 1. closest neighbor addition, 2. bilinear interpolation, 3. bi-cubic interpolation. In any case, these techniques were not reasonable for all images furthermore gives more dim or brighter pixels subsequent to adding the LR images, which in results the quality debasement. There are two sorts of image resolution upgrade strategies, those are: one is Spatial space, which applies straightforwardly on to the pixels i.e., doesn't have to transform the image into other frame, for example, dark level transformation, histogram evening out, neighborhood pixel alteration etc.,[2] and [3]. What's more, second Transform area, which transforms the LR image into frequency space and afterward applies any algorithm to improve the LR image to HR image, for example, discrete Fourier transform (DFT) [4], discrete wavelet transform (DWT) [5] and discrete cosine transform (DCT) [6].High frequency subtle elements of an image will be protected by an adaptive against associating algorithm based on the wavelet Fourier transforms (WFT) [7] and adaptive wavelet shrinkage, which evacuates associating relics by shrinkage coefficients. Best satellite image upgrade is finished by utilizing double tree complex wavelet transform (DT-CWT) with bicubic introduction given in [8] and cycle turning concept is additionally used to improve LR image to HR image by converging with CWT or DWT [9] and [10]. In any case, all the above algorithms have been experiencing absence of reliability, much complex to execute continuously world.
Available online:
http://edupediapublications.org/journals/index.php/IJR/
P a g e | 1962 been proposed utilizing hybrid waveletdecomposition (HWD) with bilinear insertion strategy.
2.
Existing Techniques
In the previous decades, there are a few algorithms have been produced to upgrade a LR image with enhanced exhibitions. In 1974 Hall et. al. proposed a dark level transformation in [11], this transformation has been utilized for image upgrade and in addition for standardization process. Later on a few channels have been produced in [12-15] and for improving and denoising the LR images. The creator in [16] has proposed a quick filtering algorithm for upgrading the LR image, which performs commotion smoothing and makes the minimum adjustments in the first LR image to acquire HR image by taking the four sub images weighted combination along four noteworthy headings. In [8], [9] and [17], a satellite image resolution improvement strategy based on DT-CWT, in which the LR image is disintegrated into a few high frequency bands. At that point after these sub bands are introduced lastly, reverse DT-CWT is utilized to combine these altered sub bands to get the HR image. Fourier Transform (FT) and Short Term Fourier Transform (STFT) are the present techniques utilized as a part of the field of image preparing. However because of extreme impediments forced by both the Fourier Transform and Short Term Fourier Transform in breaking down signs consider them incapable in examining unpredictable and dynamic signs. FT has a downside that it will work out for just stationary signs, which won't change with the time frame. Since, the FT connected for the whole flag yet not portions of a sign, in the event that we consider non-stationary sign the sign will shift with the time frame, which couldn't be transformed by FT. what's more, one more disadvantage that we have with the FT is we can't say that at what time the specific occasion will has happened. In STFT, the window is settled. Along these lines, we this window won't change with the time of the sign i.e., for both thin resolution and wide resolution. Furthermore, we can't anticipate the frequency content at every time interim segment. To defeat the disadvantages of STFT, a wavelet technique has been presented with variable window size. Wavelet analysis allows the utilization of long time interims where we need more exact low-frequency information, and shorter regions where we need high-frequency information. So as to substitute the shortcomings forced by both the basic sign preparing strategies, the wavelet technique is utilized. The wavelet technique is
utilized to remove the features in an image by preparing information at various scales. The wavelet technique controls the scales to give a higher connection in distinguishing the different frequency components in an image. In fig.1 it is demonstrated that the examination of FT, STFT and wavelet transform by considering a case input sign and how the analysis of transformation techniques will apply to get the frequency information of info sign. We can watch that in wavelet analysis the graphical representation demonstrates that the wavelet has more number of features than the FT and STFT. Wavelet is additionally called as multi resolution analysis (MRA).
Fig.1 wavelet decomposition and reconstruction tree
2.1.Discrete Wavelet Transform (DWT)
Discrete Wavelet Transform (DWT) is a modified version of Continuous Wavelet Transform (CWT). DWT principles are very similar to the CWT however the wavelet scales and positions are based upon powers of two.The wavelet function is defined as follows:
The essential principle of DWT is to pass the info signal through a gathering of channels i.e., low pass and high pass channels to get the low frequency (LF) and high frequency (HF) of source sign. Low frequency substance incorporates LL and these coefficients are known as the estimation coefficients [18]. This means the approximations are acquired by utilizing the high scale wavelets which relates to the low frequency. The high frequency components which are known as LH, HL and HH of the sign are known as the subtle elements which will be acquired by utilizing the low scale wavelets which relates to the high frequency. The procedure of DWT filtering incorporates, first the sign is bolstered into the wavelet channels. These wavelet channels contain
dt
s
t
t
x
s
s
W
(
,
)
1
(
)
Available online:
http://edupediapublications.org/journals/index.php/IJR/
P a g e | 1963 both the high-pass and low-pass channel. At thatpoint, these channels will separate the high frequency substance and low frequency substance of the sign. In any case, with DWT the numbers of tests are decreased by scale. This procedure is known as the sub-testing. Sub-inspecting means decreasing the examples by given variable. Because of the inconveniences forced by CWT which requires high preparing power [11] the DWT is picked due its effortlessness and simplicity of operation in taking care of complex signs. Fig2 demonstrates the block outline of existing DWT-RE strategy. To start with, the LR image is given as a contribution to the DWT to break down it into four sub bands LL, LH, HL and HH, which known as estimation, even, vertical and corner to corner coefficients and last three sub bands are likewise called as point of interest coefficients. These sub bands size will be half of the LR image because of that the DWT has a destruction property. Consequently we have to insert it to facilitate operate it with the LR image. Presently, the LL sub band will be introduced to subtract from the first image i.e., LR image, after this operation a distinction image will be acquired. This distinction image will be added to the high frequency sub bands LH, HL and HH to enhance the high frequency sub bands information. To perform expansion for these sub bands, we require insertion to build the extent of decimated sub bands in light of the fact that, the measure of distinction image equivalents to the LR image which is a unique image. Subsequent to playing out this operation, the evaluated or changed LH, HL and HH will be acquired. The after do the insertion for LR image with a component ofα⁄2, where the parameter α is an interpolation figure, and do likewise for even evaluated LH, HL and HH moreover. At long last, apply opposite DWT to these four sub bands to get the super fearless image i.e., HR image. Be that as it may, this methodology has been experiencing the annihilation property of DWT, on the grounds that when we apply the DWT deterioration to LR image, it will break down the image into four sub bands with lessening the span of it to the half of LR image.
Fig2. Existing DWT-RE block diagram
Here wehavetoupgrade theimagequality yet because of this demolition welose some unique information while preparing with DWT.Hence,to enhance the execution of REalgorithm further , somebodyneedstopickupthelostinformationand include itwithhighfrequencysubbands togetthe adjustedcoefficients.
3.
Proposed RE Model
This segment gives a brief depiction about the proposed RE strategy utilizing HWTI approach with insertion. Fig.3 demonstrates that the proposed block chart which incorporates both decimated and un-decimated wavelet transforms for enhancing the image quality. To begin with, the info LR image will be given as a contribution to the decimated and additionally un-decimated wavelets to break down them into sub bands. At that point we will get the low frequency and high frequency sub bands with the extent of half of the LR image and equivalents to the LR image.
Available online:
http://edupediapublications.org/journals/index.php/IJR/
P a g e | 1964 Fig3. Proposed block diagram of HWT withinterpolation method
3.1. Image Quality Metrics
This section deals with the image quality metrics to measure the quality of resolute images. PSNR and MSE are the quality metrics that have been utilized. Peak signal-to-noise ratio, often abbreviated PSNR, is a term for the ratio of signal’s peak power and the corrupting noise power that affects the fidelity of its representation. Because many signals have a very wide dynamic range, PSNR is usually expressed in terms of the logarithmic decibel scale. It is used to measure the reconstruction quality of lossy compression codecs. Although a higher PSNR generally indicates that the reconstruction is of higher quality, in some cases it may not. One has to be extremely careful with the range of validity of this metric; it is only conclusively valid when it is used to compare results from the same codec (or codec type) and same content.PSNR is most easily defined via the mean squared error (MSE). PSNR is defined as follows:
= 10 10
Where, =
× ∑ ∑ ( − )
Here, MAXI is the maximum possible pixel value of
the image. When the pixels are represented using 8 bits per sample, this is 255. More generally, when samples are represented using linear PCM with B bits per sample, MAXI is 2B−1. For color images with
three RGB values per pixel, the definition of PSNR is the same except the MSE is the sum over all squared value differences divided by image size and by three. Alternately, for color images the image is converted
to a different color space and PSNR is reported against each channel of that color space, e.g., YCbCr or HSL.
4.
Simulation Results
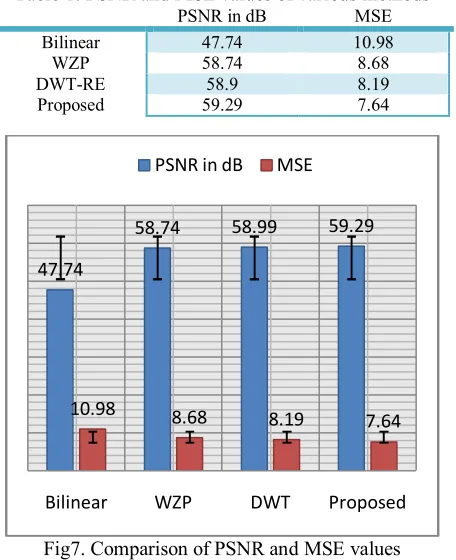
This segment deals with the experimental analysis that has been done in MATLAB environment. Fig4 shows that the original LR image, bilinear interpolated, bicubic interpolated and wavelet zero padded enhanced images. The output of decimated wavelet method and wavelet decomposed images has shown in fig5, in which the quality of the image has been increased over the conventional interpolation techniques. Fig6 shows that the proposed hybrid model, we can observe that the proposed approach has given better resolute image compared to the existing enhancement techniques. Quality metrics of various enhancement techniques has been shown in table1. It shows that the PSNR and MSE values of conventional interpolation, wavelet zero padding (WZP) and DWT-RE with proposed method. Here, bilinear interpolation is used as a conventional interpolation scheme, which has got the PSNR of 47.74 dB, WZP has performed even better than the bilinear interpolation with an improved PSNR of 58.74 dB, further enhancement has done by using DWT-RE method with PSNR value of 58.9 dB. Finally, proposed scheme has got PSNR of 59.29 dB with much superior perceptual quality.MSE is inversely proportional to the PSNR i.e., if the PSNR in high then the MSE will be lesser. Another quality metric SSIM has shown in fig8, also it has shown that our proposed scheme is far better than all conventional RE algorithms in terms quality metrics and even visual perception.
Available online:
http://edupediapublications.org/journals/index.php/IJR/
P a g e | 1965 Fig5. DWT-RE methodFig6. Proposed resolution model
Table 1: PSNR and MSE values of various methods PSNR in dB MSE Bilinear 47.74 10.98
WZP 58.74 8.68
DWT-RE 58.9 8.19
Proposed 59.29 7.64
Fig7. Comparison of PSNR and MSE values
5.
Conclusions
A review on various Ariel image enhancement techniques has been implemented, also compared the simulation results with the conventional interpolation and decimated wavelet techniques. By observing the results we can conclude that the proposed
enhancement has given better performance than the existed methods. Furthermore, it can be extended to enhance 3D RADAR images and multi directional RADARimages using image fusion enhancement techniques.
REFERENCES
[1] Goetz J. A. H. F.,G. Vane, J.E. Solomon, B.N. Rock,“Imaging Spectrometry for Earth Remote Sensing,” Science, 1985, vol. 228, pp. 1147-1153.
[2] X. Li and M. Orchard, “New edge-directed interpolation,” IEEE Trans. Image Process., vol. 10, no. 10, pp. 1521–1527, Oct. 2001.
[3] L. Zhang and X. Wu, “An edge-guided image interpolation algorithm via directional filtering and data fusion,” IEEE Trans. Image Process., vol. 15, no. 8, pp. 2226–2238, Aug. 2006 [4] W. K. Carey, D. B. Chuang, and S. S. Hemami,
“Regularity-preserving image interpolation,” IEEE Trans. Image Process., vol. 8, no. 9, pp. 1293–1297, Sep. 1999.
[5] Y. Piao, I. Shin, and H. W. Park, “Image resolution enhancement using inter-sub band correlation in wavelet domain,” in Proc. ICIP, vol. 1,pp. I445–I-448,2007.
[6] Q. Sun and J. Tang, “A new contrast measure based image enhancement algorithm in the DCT domain,” IEEE International Conference Systems, Man and cybernetics, vol. 3, pp. 2055-2058, October 2003.
[7] Eunjungchae, Wonseokkang, Joonkipaik, “Spatially Adaptive Antialiasing for Enhancement of Mobile Imaging System Using Combined Wavelet-Fourier Transform,” IEEE transaction on consumer electronics vol 59, 4Nov 2013.
[8] N.Kundeti, H.K.Kalluri, S.V.Krishna,”Image Enhancement Using DTCWT Based Cycle Spinning Methodology,” IEEE Conference On Computational Intelligence andComputing Research, 2013.
[9] H. Demirel and G. Anbarjafari, “satellite image resolution enhancement using complex wavelet transform,” IEEE Transactions on Geosciences and Remote Sensing Letters, Vol. 7, pp. 123–126, 2010.
[10]A.Temizel and T.Vlachos, “Wavelet Domain Image Resolution Enhancement Using Cycle Spinning,” Electronics Letters, vol.41.pp119-121, 2005.
[11]E. Hall, “Almost Uniform Distributions for Computer ImageEnhancement”, Computers, IEEE Transactions, Volume: C23,Page(s):207-208,1974.
[12]H. Keshavan, M. Srinath, “Interpolative models inrestoration and enhancement of noisy images”, Acoustics,Speech and Signal Processing, Volume: 25, Page(s): 525-534, 1977.
47.74
58.74 58.99 59.29
10.98 8.68 8.19
7.64
Bilinear WZP DWT Proposed
Available online:
http://edupediapublications.org/journals/index.php/IJR/
P a g e | 1966 [13]J. Lee, “Digital Image Enhancement and NoiseFiltering byUse of Local Statistics”, Pattern Analysis and MachineIntelligence, Volume: PAMI-2, Page(s): 165-168, 1980.
[14]V. Algazi, “FIR Anisotropic filters for image enhancement”,Acoustics, Speech, and Signal Processing, Volume: 11, Page(s): 2471-2474, 1986.
[15]D. Keren, S. Peleg and R. Brada, “Image sequenceenhancement using sub-pixel displacements”, ComputerVision and Pattern Recognition, Page(s): 742-746, 1988.
[16]C. Hegang, L. Kaufman and J. Hale, “A fast filteringalgorithm for image enhancement”, Medical Imaging,Volume: 13, Page(s): 557-564, 1994.
[17]H. Demirel, G. Anbarjafari, “Satellite Image ResolutionEnhancement Using Complex Wavelet Transform”,Geoscience and Remote Sensing Letters, Volume: 7, Page(s):123-126, 2010. [18]H. Demirel, G. Anbarjafari, “Discrete Wavelet