ISSN 2286-4822
www.euacademic.org DRJI Value: 5.9 (B+)
Maximizing Irrigation Water Productivity for Corn
(Zea Mays) by using Deficit Irrigation
HUSAMULDEEN A. TAWFEEQ ADNAN SH. FALIH ALAA A. HUSSEIN IBRAHIM B. RAZAQ HUSHAM S. H. AL-OBAIDI
Ministry of Science & Technology Agriculture Researches Directorate, Baghdad, Iraq
Abstract:
The objective of the study was to increase productivity of irrigation water for corn under deficit irrigation practices at middle part of Iraq climatic conditions. The experiment was conducted in soil and water resources research station at Hilla 330.59 ( North ) and
440.30 ( East ). Randomized complete block design ( RCBD ) with three
replicates was used. Corn was cultivated in fall season 2013 under five irrigation treatment were investigated, full irrigation (control) (C) and four deficit irrigation (reduction 40% from amount of applied water in control treatment) at different growth Stages seedling, vegetative, flowering and maturity. Amounts and timing of applied irrigation water were estimated based on measurement of soil water content by using soil moisture sensor type Diviner- 2000. Applied irrigation water was measured at each irrigation for the whole growing season. Actual evapotranspiration (ETa)was estimated by measuring the volumetric
soil water content at each irrigation and before the next irrigation. Applied water productivity (AWP), grain yield and response factor (Ky)
were estimated.
imposed at flowering growth stage (F) which was 1037kg m-3and
reduction percent for applied water was 17%.
As well as corn grain yield which was forms about 97% from the yield in full irrigated treatment, when deficit irrigation was imposed in flowering growth stage. This reduction in grain yield was not significant.
Key words: Corn, deficit irrigation, Diviner - 2000
INTRODUCTION:
The objectives of this study are (i) maximizing water productivity through deficit irrigation imposing at different growth stages (ii) determination of the most sensitive corn growth stage for deficit irrigation.
MATERIALS AND METHODS:
The study was conducted during the Fall season of 2013 at Hill research station, soil and water resources center, Agricultural research Directorate, Iraq. The experimental treatments were arranged in randomized complete block design (RCBD) with three replicates. Plot area was 16m2 (4X4m), Corn (Zea Mays
L.) variety Bohoth 106were planted on 15 th July and harvested
at the end of growing season on 26th November. The soil at the
site is clay and classified as fine loam, mixed, hypothermic, typic, torrifluevent. Some soil physical and chemical characteristics were determined according to standard methods (page, 1982 and Dane and Topp, 2002) table1. Triple super phosphate (260 kg. ha-1 , 48% p2 o5) was added, in addition to
urea (200kg. ha-1 , 46% N) at planting, The second portion of
urea 200kg. ha-1 was added after 5 weeks of plantation. Five
irrigation treatments were investigated, full irrigation.
Table 1: Some soil physical and chemical characteristics.
(C, control) for whole growing season andfour deficit irrigation treatments (40% reduction from the full irrigation) at different
Value Unit characteristics 266.0 gKg-1 Sand 0.323 Silt 5.024 Clay Clay Texture .201
Mgm3 Bulk density
3205 cm3cm3
Volumetric moisture content at 33 Kpa
32.5 cm3cm3
Volumetric moisture content at 1500 Kpa
32.3 cm3cm3
growth stages, seedling (S), vegetative (V), flowering (F) and maturity (M). Diviner- 2000 as soil moisture sensor was used to determine timing and amounts of irrigation water through determining soil moisture content before and after each irrigation. Irrigations were done by using plastic pipes (1.0˝) supplied with meter to control the amount of irrigation water.Irrigation amounts were calculated depending on soil moisture depletion for depth 0-0.2m from planting until the end of vegetative growth stage. This depth was increased to 0-0.4m form Flowering stage up to the end of growing season. Irrigation water depth was calculated according to (Kovda et.al., 1973).
d= (θF.C. – θbi) D………..(1)
d: Irrigation water depth (mm)
θF.C= Soil volumetric water contentwhen to irrigate (cm3cm-3 ) θbi= Soil volumetric water content before irrigation (cm3cm-3 ) D= Soil depth (mm)
Actual evapotranspiration (ETa) Was estimated using water balance equation ( Doge, 1960).
± Δ S= (I + P+ C) – (ETa +D + R)………(2)
Where:
ΔS: Soil water content changes (mm) I: Irrigation (mm)
P: precipitation (mm) C: Ground waterinput (mm) ETa: Actual evapotranspiration (mm) D: water deep percolation (mm) R: water runoff (mm)
Crop yield response factor (Ky) was calculated according to
Ky = [ 1- (ya / ym)] / [ 1 - ( ETa / ETm )]………..(3)
Where:
Ky: crop yield response
Ya: Actual yield for deficit irrigation treatment (Kg) Ym: Maximum yield ( Kg )
ETa: Actual evapotranspiration for deficit irrigation treatment (mm). ETm: Maximum evapotranspiration (mm).
AWP = Aw / Gy………(4)
Where :
AWP : Applied water productivity ( K m-3 ) AW = Applied water for unit area ( m3 ha-1) Gy = Total grain yield ( Kg ha-1)
Soil moisture sensor Diviner – 2000 calibration :
Diviner – 2000 as a soil moisture sensor need tobe calibrated to our specific soil. The soil under investigation was clayey (Table 1). A linear correlation with r2=0.943was found between
S.F.(scaled frequency) and soil volumetric water content (θ) (Fig 1).
S.F.= 1.443 θ + 0.611…………..(5) S.F.=
……….(6)
Where:
Fig 1: Diviner -2000 calibration equation for Clay soil
RESULTS AND DISCUSSION:
Total Actual evapotranspiration (ETa) values which were
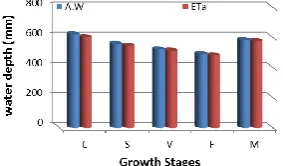
collected during the whole growing season was effected by imposing deficit irrigation at different growth stages (Fig.2).
Fig 2: Total actual evapotranspiration (ETa) and total applied water during growth stages
Both actual evapotranspiration and applied irrigation water have maximum values in full irrigation treatment (control). Whilst minimum values for both total actual evopotranspiration and total irrigation water applied were remarked when deficit irrigation was imposed at flowering growth stage. Annandale et. al., (2000). Recorded that actual evapotranspiration values increases by increasing of irrigation water application. The reduction percent for the total amount of applied irrigation water reached its maximum value
Volumetric Water Content (ө)
Y = 1.227 + 0.632 R² = 0.943
0.600 0.700 0.800 0.900 1.000 1.100 1.200
0.000 0.100 0.200 0.300 0.400 0.500
Sc
al
ed
Freq
ue
nc
y (
table2when deficit irrigation was imposed in flowering growth stage. Regarding to the grain yield, highest grain yield production was found in full irrigation treatment (control), but irrigation water saving can be reached between 6.1- 20.9% when deficit irrigation practice imposed at different growth stages through the whole growing season (Table 2).
Table: (2) Corn Grain yield and reduction percent of applied irrigation water
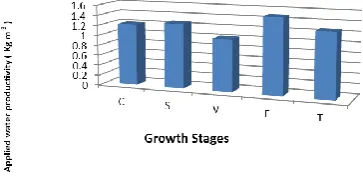
Maximum reduction in irrigation water 20.9% was found in T4 treatment (deficit irrigation at flowering growth stage), While grain yield decreased slightly this treatment (Table 2) as compared with full irrigation treatment.(Mao et.al,.2003).Fig –3 shows water applied productivity (WAP), highest value was observed at T4 treatment (imposing deficit irrigation at flowering growth stage). Using deficit irrigation at flowering growth stage did not affect the grain yield but decreased the amount of applied irrigation water this lead to get highest water applied productivity 1.49 kgm-3 (Singh et al.2012).
Fig 3: Applied water productivity during different growth stages
Percent of water
reduction (%) Grain Yield
)ton ha -1)
Treatment
-64.3
C
.320 6...
S
.12. 4033
V
.322 60.4
F
12. 653.
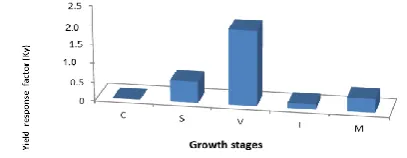
On the other hand minimum value was observed at T3 treatment (imposing deficit irrigation at vegetative growth stage). Smith (2004) found that irrigation water stress causing decreasing in vegetative corn growth on certain growth stages. This means that vegetative growth stage is the most sensitive growth stage for deficit irrigation and reducing irrigations. Fig -4 shows yield response factor (Ky), this factor was varied
regarding to imposing deficit irrigation at the different growth stages through the whole growing season. The Ky values takes
the sequence 0.13< 0.36< 0.56<1.98for Flowering, maturity, seedling and vegetative growth stages respectively.
Fig 4 : Yield response factor at different growth stages
REFERENCES:
1. Annandale, J. G. S. Campbell, F. C. Olivier, N. Z. Jovanovic. 2000. Predicting crop water uptake under full and elaficit irrigation. An example using pea ( Pisum Sativum Sativum L. e. v. Puget ) Irrig. Sci. 19: 65- 72. 2. Cohen, O. P., and E. Bresler. 1967. The effect of non
uniform water application on soil moisture content, moisture depletion and irrigation efficiency. Soil Sci Soc. Am. Proc. 31: 117-121.
4. Dooge, J. C. I. 1960. Volumetric calibration of neutron moisture probe. Soil Sci, Soc. Am. Proc. 30: 541-544.
5. Kovda, V. A. C. Vanden Berg and R. M. Hangun. 1973. Irrigation Drainage and salinity.
6. Mao, X., M. Liu., X. Wang., C. Liu., Z. Hou. And J. Shi. 2003. Effects of deficit irrigation on yield and water use of greenhouse grown cucumber in the nooth china. Agric. Water manage. 61. 219-228.
7. Page, A. L., R. H. Miller and D. R. Keeney. 1982. Methods of Soil Analysis. Part2. chemical and Microbiological properties. 2nd edition. Am. Soc. Agron. Inc. publisher, Madison, Wisconsin, USA.
8. Sam, G. and Raes. 2009. Deficit irrigation as an on- farm strategy to maximize crop water productivity in dry areas. Agricultural water management. 96: 1275- 1284.
9. Singh, A.O.S, Aulakh, and R.K.Hundas.2012. Ways to maximize the water use efficiency in crops. Areview – Greener J. of Agric . Sci. 2 (4) : 129- 188.
10. Smith.J.S.2004.Effect of Water Stress at different development stages on vegetative grow of corn. Sci. Direct .89: 1-16.