Overview of Multidimensional Data Model - OLAP
1 Siddhant Mehta,2 PoonamRawat, 3 Prerna Malik
1,2,3 (Student,Dronacharya College of Engineering,Farrukh Nagar,Gurgaon, India)
1
mehtasiddhant23@gmail.com2Rawatp19@yahoo.com 3
Prernamalik03@gmail.com
Abstract–
During the past decade, the multidimensional data model emerged for use when the objective is to analyse data rather than to perform online transactions. We extend the OLAP data model to representambiguity of dataand on-line analytical processing (OLAP), an essential element of decision support, which has increasingly become an emphasis of our new database industry. We relate natural query properties and use them to shed light on different query semantics. There is much more work required on decision support on database technology compared to traditional on-line transaction processing applications. This paper provides an overview of OLAP technology, with a prominence on their new requirements.
Keywords
Ambiguity; multidimensional; database; OLAP; semantics; warehouse
I. Introduction
There are a lot of data that can be viewed as multidimensional data. The term
multidimensional data bases refers to a collection
of objects, each represented as a point in a multidimensional space. Even data that is represented in a tabular form, such as relations, can viewed as multidimensional data, if each row (tuple) is thought of as an object, and the columns (attributes) are thought of as the dimensions.[1]Multidimensional database technology is a key factor in the interactive analysis of large amounts of data for decision-making purposes. These databases view data as multidimensional cubes which are well suited for data analysis.
the textual dimensionsthat characterises the facts. In the terms of a retail business, a purchase would be a fact and the purchase amount and price would be measures; the type of product being bought and the purchase time and location would
be dimensions. Queries
accumulatemeasurevalues over a range of
dimension values to provide results such as total
sales per month of a given
product.Multidimensional data models have three primeapplication areas within data analysis.
A. Data Warehouse:
Subject-oriented, integrated, time varying, non-volatile collection of data that is used primarily in organizational decision making [2]. It is a copy of transaction data specifically structured for query and analysis. [3]
1) On Line Analytical Processing (OLAP):
aims to discover new relationships between different sets of data. [5]
2) Data Mining:
Also called Knowledge Discovery in Databases(KDD), in computer science, is the practice of inspecting large databases to generate new information. These applications seek to discover knowledge by searching semi automatically for previous relationships and unknown patterns in multidimensional databases.
In 1998, Microsoft shipped its MS OLAP Server, the first multidimensionalsystem aimed at the mass market, and now multidimensionalsystems are becoming commodity products, shipped at no extra costtogether with leading relational database systems.[6]Academic researchers have proposed formal mathematicalmodels of multidimensional databases, whileindustry implicitly specifies proposals via the concretesoftware tools that implement them. The data warehouse supports on-line analytical processing(OLAP), the functional and performance requirements of which are quite different from those of the on-line
transactionprocessing (OLTP) applications.
Consistency and recoverability of the database are fundamental, and maximizing a transaction throughput is the key performance metric. Consequently, the database is designed to reflect the operational semantics of known applications and in particular, to minimize concurrency conflicts. Given that operational databases are finely tuned to support known OLTP workloads, trying to execute complex OLAPqueries against the operational databases would result ininappropriate performance. Furthermore, decision support requires data that might be missing from the operationaldatabases, understanding trends or makingpredictions requires historical data, whereas operationaldatabases store only the current data. Decision support requires consolidating that data from many heterogeneoussources.
Fig. 1(oracleolap.blogspot.com) OLAP CUBE
II.Implementation
Implementing multidimensional database taketwo general forms:
A. Multidimensional online analytical
processing (MOLAP):
Stores data on disks in specialized multidimensionalstructures. MOLAP systems typicallyinclude provisions for handling sparse arrays andapply advanced indexing and hashing to locatethe data when performing queries. [3].
B. Relational OLAP (ROLAP):
Systemsuse relational database technology for storing data, and they also employ specialized index structures, such as bit-mapped indices, to achieve goodquery performance. [4] MOLAP systems generally provide more space-efficient storage as well as faster query response times. ROLAP systems typically scale better in the number of facts they can store (although some MOLAP tools are now becoming just as scalable), are moreflexible with respect to cube redefinitions, and givesbetter support for frequent updates.
employ star or snowflakeschemas, both of which store data in fact tables and dimension tables. A fact table holds one row for each fact in the cube. It has a column for each measure, containing the measurable value for the particular fact, as well as a column for each dimension that contains a foreign key referencing a dimension table for the particular dimension.
Star and snowflake schemas differ in how they handle dimensions, and choosing between them largely depends on the desired properties of the system being developed. The star schema’s fact table holds the sales price for one particular sale and its related dimension values. It has a foreign key column for the dimensions: product, location, and time. The dimension tables have corresponding key columns and one column for each dimension level. No column is necessary for the T level, which will always hold the same value. The dimension table’s key column is typically a dummy integer key without any semantics. This prevents misuse of keys, offers better storage, use, and provides more support for dimension updates than information-bearing keys from the source systems. [3]
Redundancy will occur in higher-level data. Also, the central handling of dimension updates ensures consistency. Thus, using denormalized dimension tables, which support a simpler formulation of better-performing queries, is often beneficial. Snowflake schemas contain one table for each dimension level to avoid redundancy, which may be advantageous in some situations. The dimension tables each contain a key, a column containingtextual descriptions of the level values, and possibly columns for level properties. Tables for lower levels also contain a foreign key to the continuing level.
III.Methodologyof Database Design
The multidimensional data model described above is implemented directly by MOLAP servers. However, when a relational ROLAP server is used, the multidimensional model and its overall operations have to be mapped into
SQL queries andits relations. Entity Relationship (E-R) diagrams and normalization techniques are popularly used for database design in OLTPenvironments. However, the database designs by ER diagrams are inappropriate for decision support systems where efficiency in querying and in loading data is important. Most data warehouses uses a star schema to represent the multidimensional data model. The database is made up of a single fact table and a single
tablefor each dimension. Each tuple in the fact
table consists of a pointer to each of the dimensions that provide its multidimensional coordinates and stores that numeric measures of those coordinates. Each dimension table is composed of columns that correspond to attributes of that dimension.
Fig.2 star schema
Star schemas do not explicitly provide support
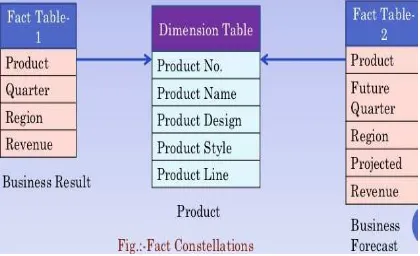
for attribute hierarchies. Snowflake schemas gives a refinement of star schemas where the dimension hierarchy is explicitly represented by normalizing the dimension tables. This leads to benefits in maintaining the dimension tables. However, the denormalized structure of the dimensional tables in star schemas is more suitable for browsing the dimensions. Fact
constellations are examples of more complex
Fig. 3 A Snowflake Schema
Fig.4 Fact Constellations
IV.The Warehouse Servers
Data warehouses may contain large volumes of data. To answer queries effectively requires highly efficient access methods and query processing techniques. Firstly, data warehouses use redundant structures such as indices and materialized views; choosing which indices to build and which views to materialize is an essential physical design problem. The next challenge is to effectively use the existing indices and materialized views to answer the queries. Optimization of complex queries is another important problem. For data-selective queries, efficient index scans may be very operative, data-intensive queries requires the use of sequential scans. Thus, improving the efficiency of scans is very important. Eventually, parallelism needs to be exploited to reduce query response times.
A.Parallel Processing
Parallelism plays a significant role in processing massive databases. Teradata pioneered some of the key technology. All major vendors of database management systems now offer data partitioning and parallel query processing technology. One interesting technique relevant tothe read-only environment of decision support systems is that of piggybacking scans requested by multiple queries .Piggybacking scan reduces the total work as well as response time by overlapping scans of multiple concurrent requests.
B.Query Processing
Traditional relational servers were not geared towards the intelligent use of indices and other requirements for supporting multidimensional views of data. However, all relational DBMS vendors have now moved rapidly to support these additional requirements. In addition to the traditional relational servers, there are three categories of servers that were developed categorically for decision support:
• Specialized SQL Servers: Redbrick is an example of this class of servers. The objective is to provide advanced query language and query processing support for SQL queries over star and snowflake schemas inroad-only environments.
• ROLAP Servers: These are intermediate servers
to tune the ROLAPservers for domain specific ROLAP tools. The main strength of ROLAP servers is that they exploit the scalability and the transactional features of relational systems. However, intrinsic mismatches betweenOLAP-style querying and SQL (e.g., lack of sequential processing, column aggregation) can cause performance bottlenecks for OLAP servers.
• MOLAP Servers: These servers directly support the multidimensional view of data through a multidimensional storage engine. This makes it possible to implement front-end multidimensional queries on the storage layer through direct mapping. Example is Essbaseserver (Arbor). Such an approach has the advantage of excellent indexing properties, but provides poor storage utilization, particularly when the data set is sparse. Many MOLAP servers adopt a 2-levelstorage representation to adapt to sparse data sets and use compression extensively. In the two-level storage representation, a set of one or two dimensional sub arrays that are likely to be dense are identified, through the use of design tools or by user input, and are represented in the array format. The traditional indexing structures used to index onto these smaller arrays. Many of the techniques that were devised for statistical databases appear to be relevant for MOLAP servers.
V.Requirements of OLAP
In delivering support for OLAP-style queries in the presence of imprecision and uncertainty, we assert that the answers to these queries should meet a reasonable set of requirements that can be considered generalizations of requirements met by queries in standard OLAP systems.
We propose two requirements for handling imprecision, consistencyand faithfulness, which apply to bothuncertainand numeric measures.
A.Consistency
The consistency requirement is that user expects to see some natural relationships hold between the answers to aggregation queries associated with different regions in a hierarchy.
Definition 1 (α -consistency) : Let _(x, x1, x2, . . . , up) beat predicate such that each argument aboutαtakes on values from the range of a fixed aggregation on operator A. Consider collection of queries Q,Q1, . . . ,Qp such that (1)the query region of Q is partitioned by the query regions of Q1, . . . ,Qp, i.e., reg(Q) = [i reg(Qi) and reg(Qi) \reg(Qj) = ; for every i 6= j, and (2) each query specifies that A be applied to the same measure attribute. Let, ˆq1.. . . ˆqm denote the associated set of answers on Dewed say that an algorithm satisfies α - consistency with respect to A if _(ˆq, ˆq1, . . . , ˆqp) holds for every database Dand for every such collection of queries Q,Q1,Q2 . . . ,Qp.
B.Faithfulness
Starting with a database D, suppose we increase imprecision in D by mapping facts in the database to larger regions. We expect that the answer to any query Q on this new database D0 Faithfulness is intended to capture the intuitive property that this difference should be as small as possible. Since an aggregation algorithm only gets to see D0 as its input and is not aware of the “original” database D one cannot hope in general to state precise lower and upper bounds for this difference. Our aim instead will be to state weaker properties that characterize this difference, e.g., whether it is monotonic with respect to the amount of imprecision.
Definition 2 (Basic faithfulness) : We say that an
VI. Conclusion
Multidimensional database technology has come a long way since its inception more than30 years ago. It has recently begun to reach the mass market, with major vendors now delivering multidimensional engines along with their relational database offerings, often at no extra cost. Multidimensional technology has also made significant gains in scalability and maturity. Several exciting trends lie ahead. Data that must be analysed is becoming increasingly distributed- for example, it is desirable to perform analyses usingXML data from certain Web sites. The increasing distribution of data in turn calls for techniques that easily integrate new data into multidimensional databases, thus easing the daunting task of building an integrated data warehouse. Examples include the automatic generation of dimensions and cubes from new data sources and methods for easy, on-the-fly data cleaning.
Multidimensional database technology is also being applied to new types of data that current technology cannot adequately analyse. For example, classic techniques such as pre-aggregation cannot ensure fast query response times when data—such as from sensors or moving objects such as Global-Positioning-System(GPS) equipped vehicles is continuously changing. Finally, multidimensional database technology will increasingly be applied where supporting the multidimensional data models and operations typical ofOLAP requires special organization of data, implementation methods and access methods not generally provided by commercial DBMSs aimed for OLTP. It is for all said reasons that data warehouses are implemented separately fromthe operational databases.
References
[1] Multidimensionality in Statistical, OLAP, and Scientific Databases ArieShoshani, Lawrence Berkeley National Laboratory, USA .
[2] Inmon, W.H., Building the Data Warehouse. John Wiley, 1992.
[3] R. Kimball, The Data Warehouse Toolkit: PracticalTechniques for Building Dimensional Data Warehouses,John Wiley & Sons, New York, 1996.
[4] E. Thomsen, OLAP Solutions: Building Multidimensional Information Systems, John Wiley & Sons, New York, 1997.