Volume 2009, Article ID 406979,20pages doi:10.1155/2009/406979
Research Article
Testing Applications in MANET Environments through
Emulation
Jorge Hortelano, Juan-Carlos Cano, Carlos T. Calafate, and Pietro Manzoni
Department of Computing Engineering, Universidad Polit´ecnica de Valencia, Camino de Vera s/n, 46022 Valencia, Spain
Correspondence should be addressed to Juan-Carlos Cano,[email protected]
Received 22 July 2009; Revised 18 November 2009; Accepted 15 December 2009
Recommended by Amiya Nayak
Mobile Ad Hoc Network solution testing is typically done using simulation. The simulated code is generally a simplified version of the real code, and thus code porting to actual operating systems lacks a strong validation. In this work we present Castadiva, a
test-bed architecture that allows validating software solutions for real ad hoc network environments using low-cost, off-the-shelf
devices and open source software. Castadiva is also compatible with the ns-2 simulator, allowing a combined and more complete
evaluation. In this work we present our tool and the results obtained when evaluating videocalls in different scenarios, both static
and dynamic.
Copyright © 2009 Jorge Hortelano et al. This is an open access article distributed under the Creative Commons Attribution License, which permits unrestricted use, distribution, and reproduction in any medium, provided the original work is properly cited.
1. Introduction
Mobile ad hoc wireless networks (MANETs) [1] consist of mobile nodes interconnected by multihop communication paths. Unlike conventional wireless networks, ad hoc net-works have no fixed network infrastructure or administrative support. Nodes belonging to a MANET can either be end-points of a data interchange or act as routers when the two end-points are not directly within their radio range. The topology of the network changes dynamically as mobile nodes join or depart the network, or when radio links between nodes become unusable. This means that users have the freedom to create their own networks, which can be deployed easily and cheaply. The importance of MANETs becomes evident by noticing the wide application area that these embrace. Special situations require communication networks to be available without any previous infrastructure, like emergency missions, military operations [2], or ad hoc meetings. However, a price for all those features is paid in terms of complex technological solutions.
MANETs require efficient routing protocols to operate correctly. A routing protocol specifies how nodes commu-nicate with each other to disseminate routing information, allowing them to create routes between any two nodes on a network. Many of the academic papers dealing with ad hoc
and mesh networks [3–6] evaluate protocols assuming vary-ing degrees of mobility within a bounded area, usually with all nodes within a few hops of each other, and usually with nodes sending data at a constant rate. Different protocols are then evaluated based on the packet drop rate and the overhead introduced by the routing protocol. The growing research efforts focusing on this new technology require the availability of tools that allow researchers to evaluate their proposals.
wired and wireless networks alike. Simulation offers four important advantages. First, it enables experimentation with large networks. Second, it enables experimentation with con-figurations that may not be possible with existing technology. Third, it allows rapid prototyping. Finally, it makes repro-ducible experiments in a controlled environment possible. Simulations also have some disadvantages. First, researchers can not test their own real world implementation of a protocol in a realistic scenario. Second, simulators typically do not incorporate realistic models of node mobility and radio signal propagation [11].
Emulators provide an attractive middle ground between pure simulators and wireless test-beds, allowing scalable and repeatable experimentation and using real devices. In
Section 2we describe different emulators.
A test-bed is a platform for experimentation which allows for rigorous, transparent, and replicable testing of scientific theories, computational tools, and other new technologies [12].
In this work we presentCastadiva, a test-bed architecture that simplifies carrying out realistic experiments; it relies on low-cost, off-the-shelf wireless routers combined with
a Linux platform. Castadiva allows generating network
topologies, exporting them to real devices and obtaining the test results. It can also generate different types of traffic
between nodes and offers support for some well-known
ad hoc routing protocols. It relies on a cheap architecture that includes two different networks: a wired network, called connection network, that connects the server with a group of wireless nodes, and a wireless network where the actual test-bed experiments are made. We developed a group of tools for administration purposes, with a friendly user interface design to help the user define the scenario of the network and the desired traffic connections between MANET nodes in a simple and straightforward manner. All of these tools were developed with open source software and they are freely available for the research community at
http://castadiva.sourceforge.net/.
Castadivawas designed to be completely compatible with the ns-2 file format, which allows us to compare both in a simple and straightforward manner. Hence, we relied on ns-2 to validate our test-bed. We selected a range of both static and dynamic MANET scenarios and compared the results obtained using Castadiva with those obtained using ns-2. We confirmed thatCastadivais a reliable tool that provides results which are comparable, although not strictly identical, to those obtained in a realistic MANET.
After validating Castadiva we proceeded to assess the performance of a real videoconferencing tool in MANET environments. The application being tested is Ekiga [13], a platform offering real-time audio/video communication between users supporting both SIP [14] and H.323 [15] standards. The metrics analyzed were the packet loss rate and the end-to-end delay. We also characterized the source traffic under different conditions since the data rate generated is dynamically adjusted by Ekiga.
The rest of this work is organized as follows. Related works are presented in Section 2.Section 3 describes Cas-tadiva’s architecture.Section 4presents the implementation
details. Section 5 presents the performance evaluation we have done to validate our tool, comparing this tool with the ns-2 when using TCP and UDP traffic. InSection 6we show the results obtained with real audio/video traffic in different scenarios. Finally, in Section 7 we present our concluding remarks.
2. Related Work
The idea of automatic computer-controlled routing in a mesh network is not new; in fact the main idea dates back to Baran in the early 1964 [16]. Since then, several prototypes for generating real ad hoc network experiments were proposed and can be found in the literature.
ORBIT. An indoor radio grid emulator for controlled experimentation and an outdoor field trial network for end-user evaluations in real-world settings [17]. This emulator needs an expensive noise generator since it emulates higher node distances, by reducing the signal-to-noise ratio. It also requires investing a high budget to create the grid of nodes (each computer is a possible position of the node in a simulation), as well as extra support servers for data storage. Thus, deploying the entire infrastructure requires a lot of room.
mLab. An emulator that strikes a balance between desktop simulations and outdoor field tests by allowing users to develop and test ad hoc protocols and applications in a laboratory environment [18]. This emulator can only generate network topologies and capture packets.
Carnegie Mellon University Wireless Emulator. Supports real devices, applications, MAC and PHY layers on a network-wide scale while maintaining experimental control and repeatability [19]. The disadvantages of this emulator are that it does not use commercial off-the-shelf devices, using a FPGA for digital emulation instead.
MobiEmu. An emulator to test an ad hoc network of any scale and with any mobility scenario without actually moving the ad hoc nodes physically [20]. We discarded this emulator for our test since it relies on expensive clusters to emulate the scenario.
Seawind. Another emulator designed for performance stud-ies of real protocols and applications on wireless networks [9]. It uses an emulated link and router to generate the network topology and noncommercial off-the-shelf devices, making it difficult to scale up the network. Also, it can only emulate one traffic flow.
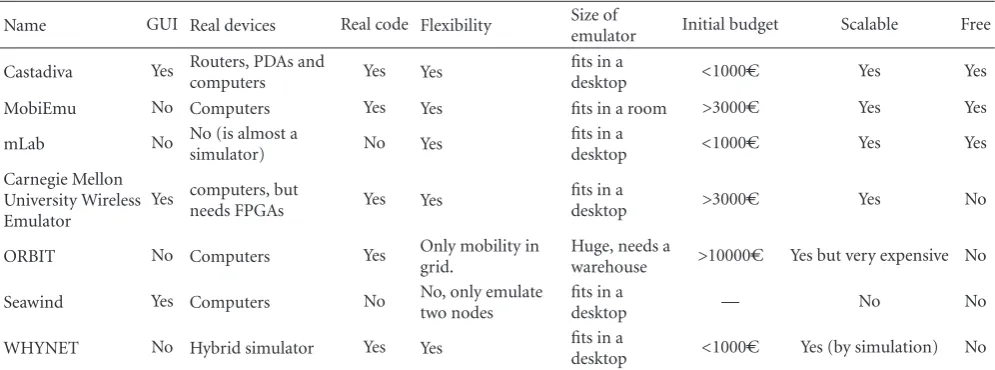
Table1: Comparative of existing emulators.
Name GUI Real devices Real code Flexibility Size of
emulator Initial budget Scalable Free
Castadiva Yes Routers, PDAs and
computers Yes Yes
fits in a
desktop <1000C Yes Yes
MobiEmu No Computers Yes Yes fits in a room >3000C Yes Yes
mLab No No (is almost a
simulator) No Yes
fits in a
desktop <1000C Yes Yes
Carnegie Mellon University Wireless Emulator
Yes computers, but
needs FPGAs Yes Yes
fits in a
desktop >3000C Yes No
ORBIT No Computers Yes Only mobility in
grid.
Huge, needs a
warehouse >10000C Yes but very expensive No
Seawind Yes Computers No No, only emulate
two nodes
fits in a
desktop — No No
WHYNET No Hybrid simulator Yes Yes fits in a
desktop <1000C Yes (by simulation) No
GUI: a graphical interface for easy use of the emulator. Real Devices: Which devices can be used on the emulation tests? Real Code: Can users introduce real implementations of application and protocols on its emulations without changing anything, or must they rewrite the code to fit the emulator? Flexibility: Can any topology be implemented? Size of the Emulator: Can the emulator be deployed on a simple desktop of a lab, or does it need an entire room for its deployment? Initial Budget: The initial (approx.) inversion for generating a test-bed of 10 nodes. Scalable: Is it easy to increase the number of nodes without increasing the cost significantly? Free: Can it be used freely by anyone without purchasing?
WHYNET uses a geographically distributed set of physical wireless testbeds, making results difficult to be replicated by other researchers.
We developed Castadiva to deploy a cheap architecture
that relies on low-cost devices to generate a test-bed. The test bed obtained effectively uses low-cost hardware to achieve a complex, yet reliable wireless network simulation.
Table 1 compares the different emulators available against
Castadiva. As can be observed, only three emulators are
free: Castadiva, MobiEmu, and mLab. mLab is almost a
simulator that does not use real devices.Castadivacan use any devices with a wireless card, which offers flexibility when purchasing devices, thus reducing the budget to deploy the emulator. MobiEmu is more expensive than Castadiva
and does not have a GUI. Castadiva implements a GUI to guide the users when creating the scenario and the traffic pattern.
Overall, Castadivaoutperforms the other emulators in terms of (a) variety of devices that can be use as nodes, (b) initial budged needed to deploy the emulator, and (c) ease of use provided by the GUI; this means that it makes a clear contribution to the research community.
3. Castadiva’s Architecture Overview
Castadiva is a test-bed designed to deal with the devel-opment and the performance evaluation of protocols and applications for MANETs. The test-bed relies on actual IEEE 802.11 wireless interfaces for communication among nodes.Castadivais composed by a server that runs the main application, several wireless nodes, two different networks (wired and wireless), and an application that coordinates all devices.
Castadiva’s server executes the application and configures the network devices. Concerning the wireless nodes used, they can be any sort of computing device, like a laptop, a PDA, or a wireless router. In our prototype, each node is a Linksys router to minimize costs. The main requirement for a node is that it must have a Linux/Unix operating system installed and two network cards: an Ethernet card and an IEEE 802.11 card. If the node is a wireless router, the OpenWRT [22] kernel is an excellent solution. OpenWRT is an open source operating system available for a wide range of router manufacturers. This embedded Linux system natively offers SSH connections, along with the possibility of running shell scripts. Moreover, a programmer can develop its own application in a standard Linux distribution and export it to this operating system. In our case, we developed some applications in C for traffic generation and control purposes.
Figure 1shows a schema ofCastadiva’s components. The main application, developed in Java, controls all devices and dynamically manages the links among them according to the desired network scenario. It also manages traffic generation between pairs of nodes. Since the controlling application requires communicating with nodes to send control packets,
Castadivacombines two different networks: the coordination network (wired), that connects theCastadivacore with the wireless nodes, and the wireless network, where actual tests run.
802.11 Eth 802.11 Eth 802.11 Eth Coordination network Core with
java application
Test-bed device Test-bed
device Test-bed
device
802.11 test-bed network
Figure1: Schema ofCastadiva’s components.
the coordination network requires a switch connected to the main server and to all nodes. Through this network the main application sends instructions to nodes, allowing them to reconfigure periodically according to the desired
network topology and also to run lightweight traffi
c-generating applications available on each wireless node. For communication purposes, we rely on the SSH protocol [23] to send instructions through this network. Using a fast network means that all nodes participating in a test will start at about the same time, avoiding significant latency effects and maximizing result accuracy.
The wireless network is composed byCastadiva’s wireless nodes, and the topology of this network is defined by the GUI of Castadiva, so that it can change at runtime. Nodes communicate in ad hoc mode using IEEE 802.11g technology.
Castadiva’s core has two main functions: (a) to allow a user to interact with the system so as to define all the test parameters required, and (b) to coordinate the wireless nodes during an experiment. By usingCastadiva’s GUI a user can control all of Castadiva’s functionality, defining the network topology and the traffic flow among nodes.Castadivaallows fixing the scenario area where nodes will be deployed. When selecting a node, its location is highlighted and it can be changed according to the desired network topology. When all nodes are deployed, the user can press theSimulate button,and each physical node will be reprogrammed so as to enforce the chosen network topology.Figure 2shows the GUI application ofCastadiva. We describe the whole functionality offered byCastadiva’s GUI inSection 4.2.
Figure 3shows our test-bed. One switch connects Cas-tadiva’s server with all the wireless nodes for coordination purposes. On the center of the picture the group of wireless nodes being used is shown. It consists of eleven Linksys
routers (models WRT54G and WRT54GL). The wireless ad hoc network conformed by these nodes is the one used in
Castadiva’s testbed experiments. The experiments presented
in this work required extending Castadiva to support
traffic injected from outside applications. In particular, we connected laptops running videoconference software to our MANET, allowing us to assess the performance of video conference sessions as experienced by users.
4. Castadiva’s Implementation Details
In this section we detail the requirements ofCastadivaon the server and on the wireless nodes. We describe the software tools we have developed to connect all the wireless nodes with the server, and howCastadivaallows emulating connec-tions among them. We also explain the process of designing network topologies by using the Scenario Generation tool, an interactive and user-friendly interface that allows defining the network’s scenario and the desired traffic connections among nodes.
Castadivarequires some libraries and services to operate. The requirements of Castadiva are different for the server and the wireless nodes. The server must be a standard Linux-based system and must have a Java Virtual Machine, an SSH client, and an NFS server installed. Concerning nodes, each one must be a Linux-based system with an SSH server and an NFS client; besides, they must have thelibgcclibrary and have theIptablestoolset installed (seeFigure 4).
The connection between Castadiva’s core element
AP1
AP2 AP3
AP4 AP5
AP6 AP7 AP8 AP9
AP13
AP12
AP10
AP11
1600 m 1400 m 1200 m 1000 m 800 m 600 m 400 m 200 m
0 m 200 m 400 m 600 m 800 m 1000 m 1200 m1400 m1600 m
Figure2: Scenario definition withCastadiva.
Figure3:Castadiva’s physical network.
Wireless nodes achieve coordination among themselves by executing the required binaries, which are stored in a server folder shared through NFS. This is an easy way to spread instructions to all nodes, and it also solves storage limitation problems on nodes. When tests start, a group of files with the results is created and stored into Castadiva’s server. Each individual router accesses its own configuration file by relying on the NFS filesystem. We find that Ethernet connections are fast enough to export these files to the routers without significant delays.
The main application parses the results, thus obtaining the different testbed statistics. Finally, the application dis-plays results to the user.
Next we present theCastadiva’s implementation, which can be divided into two parts: the light-weight applications running on wireless nodes, and the main application.
4.1. Wireless Nodes’ Software. Each node has a set of require-ments that must be met for successful operation: a Linux-based operating system, a set of special-purpose scripts, and
some specific applications and connectivity to Castadiva’s server.
The operating system installed on each router is Open-WRT. OpenWRT allows executing BASH scripts natively; besides, it includes Dropbear, a simple SSH server used to receive instructions fromCastadiva’s server. Concerning the set ofCastadiva’s scripts, they are generated automatically by
Castadiva’s main application. Their purpose is to configure the wireless network topology.
Each node makes use of three applications: Iptables, TcpFlow, and UdpFlow. The first one is open source and exists in most Linux distributions, while the other two were developed by us.
Network topology configuration relies on the Iptables [24] tool. According to the selected topology, Iptables allows us to dynamically break the network links between pairs of nodes. This tool exists for all Linux distributions, including the OpenWRT embedded system.
To generate traffic we created the UdpFlow and TcpFlow tools. Both tools are designed to generate a traffic flow between two nodes, being that each tool creates a single traffic flow. To create a flow of data we must specify a source/destination pair, the starting and ending times for this flow, and the maximum amount of bytes to be sent.
Castadiva also includes routing agents for well-known routing protocols, such as AODV and OLSR, that are included with the OpenWRT and initiated according to user settings.
Castadiva core
Castadiva application
GUI
Topology and traffic definition
Data interpretation
NFS folder
Java
Linux
NFS folder SSH
NFS
Castadiva wireless node
Generate links between nodes
in 802.11
OpenWRT
Traffic binaries
Results text files
Castadiva scripts
Protocol binaries
Figure4: Software components forCastadiva.
Once the topology is defined,Castadivamust configure the wireless nodes according to that topology. The application communicates with each node through SSH connections to send the required instructions. The traffic flow between nodes and the routing protocol used are also set through this technique. When all the experiments are finished,Castadiva’s core must calculate the result statistics for the experiment by gathering all the data obtained and finally show these results to the user.
Castadiva’s main application was created using Java’s Swing library. We consider that it is a good solution for visual design since most basic components are already created and can be easily modified by the programmer.
Castadiva is designed to be a test-bed where network scenarios and traffic between nodes are generated so as to resemble a real MANET. Therefore, it is expected to be an easy and useful tool for the study of MANETs.
To start a new experiment we only need to define the network topology in the corresponding window and then define the traffic flow and the routing protocol used. By pressing the start button tests begin, andCastadivareturns the test results automatically at the end of the simulation. We now offer more details about the services offered by
Castadiva.
4.2.1. Adding Nodes to the Testbed. Before starting an exper-iment the user needs to define the number of participating nodes, along with their configuration. Such information
allows Castadiva to access nodes and manipulate them
to generate a scenario. Figure 5 shows an example of the definition of a node in the system.
All the information is defined automatically when the user wishes to add a new one, though it can be changed by the user or can be read from a file. An internal identifier is required to distinguish a node from others inCastadiva’s framework. Such identifier is then referenced when defining the network topology and data connections. The remaining
Figure5: Node configuration interface.
parameters will be used by Castadiva’s main application to connect nodes among themselves and with the main server. The MAC address is required forCastadivato enforce topology changes.
All the executable files and scripts are stored in an NFS directory that is accessible by all nodes. This way
Castadiva makes storage capacity independent of wireless nodes’ memory.
The SSH user and password fields are used by the main application to connect to each individual router and submit commands. Also, a Ping button was included to allow testing the connectivity between the server and the routers.
4.2.2. Ad Hoc Network Scenario Generation. Once all the nodes are defined, they can be configured to conform
a scenario. Castadiva supports both manual and random
topology generation, and the scenario is set through Cas-tadiva’s blackboard. The blackboard is a representation of a virtual environment where nodes are located. Nodes are differentiated through different colors and labels. If the adequate option is selected, the radio communication range is also shown through a circle of the same colour.
Figure 6shows the topology generation environment. We can see ten nodes located in a scenario of 850×1000 meters (scenarios bounds are marked with a darker line).
At the right hand we may edit node properties, such as position and signal range.Castadivaalso can activate or deactivate the RTS/CTS 802.11 option of each node. The group of buttons appearing below allows starting a new test, stopping it, and rebooting nodes to reset all values.
At the left hand,Castadivaoffers scenario option editing. We can define the scenario bounds, the test time, node mobility, and the routing protocol used. TheDeclare traffic
button allows setting traffic, as shown, later on, and the stop button halts it.
A status bar provides general information to inform the user about what is being done, and the horizontal scrolls allows zooming in and out. Finally, the user may alternate between two different views: radio ranges or a graph. Every edge of the graph represents an IEEE 802.11 link connection, which is a more intuitive view.
4.2.3. Mobility in Castadiva. Castadiva offers the user two different approaches for emulating mobility: (a) any scenario from the ns-2 simulator could be directly used within
Castadiva, and (b) the user can take advantage of the GUI to select their own mobility model. We already included the random way point mobility model [25]. This behavior is similar to the one provided by the “setdest” tool embedded in the ns-2 simulator: if a user picks a value greater than zero in the speed option, each node acquires a random movement with a speed between zero and the inserted value. When a node arrives to a destination point, it waits for a selected pause time and then select a new random destination point to move to.Castadivaallows users to easily add new mobility models implementations.
For the emulation of mobility, Castadiva generates all node movements required for the test before it starts. In particular it generates, for each node, a mobility vector according to the selected user option in the GUI or imports it from an ns-2 scenario. Also, Castadiva calculates the variation of the topology continuously in time. Therefore, our emulator obtains the new topology of the network, updating the wireless links on each real device whenever necessary. The granularity used to upgrade the wireless links is of one second, but it can be changed. Since the real devices do no experience real mobility, we emulate
the wireless links connectivity between nodes using the Iptables tool. This tool allows each node ofCastadivato only receive packets from nodes that are within range according to the emulated topology, and thus it blocks the reception of packets when nodes are out of range. All Iptables rules are stored into script files. These scripts will be loaded on each node through NFS when the simulation starts.
Figure 7 shows the file loaded by AP1. We can see in this figure different Iptables rules interleaved with sleep rules. The sleep time allows enforcing Iptables’ rules at suitable times. Hence, each rule is loaded only when the emulation requires a node to change its connectivity state towards other node. For example,Algorithm 1shows what is the behaviour of Castadivawhen a node (with MAC 00:14:BF:3C:39:EC) goes out of range at second 15 and comes back into range at second 35.
Castadivaalso allows a user to see all node positions at a certain instant of time. When a simulation finishes, the user can activate theShow option and pick an instant of time. ImmediatelyCastadivashows the network topology at that time. This option is useful to do a later evaluation of the changes occurred in the network topology when mobility was activated.
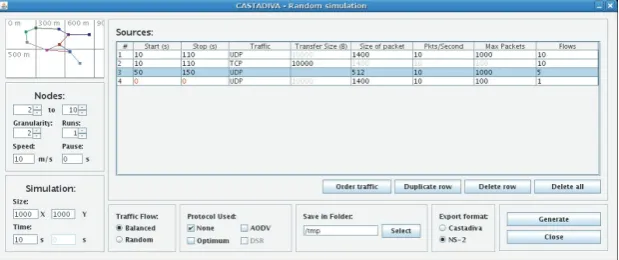
4.2.4. Network Traffic Declaration. Castadiva’s traffic gen-eration tool allows defining different types of traffic flows between pairs of nodes. With that purpose Castadiva pro-vides a table where each row defines a connection. Traffic parameters for each connection can be set depending on the type of protocol selected, and invalid values are marked in red. Examples of parameters are packet size,packets per second,start time,end time,andmaximum number of packets sent.Figure 8shows a usage example of this tool, where rows define seven traffic connections. It contains some helpful buttons that allow making row operations (delete, order by starting time, or copy). Traffic settings are exportable to ns-2 format also.
When an experiment finishes, Castadiva fills this table with results, including the average throughput, in the case of TCP traffic, or the percentage of packets received in the case of UDP traffic.
4.2.5. Random Test Generator. Sometimes it is useful to automate the testbed evaluation process varying different parameters. With that purposeCastadivaincludes function-ality to generate random tests, where a user can define traffic and automatically test with different numbers of nodes and randomly generated network topologies. This is achieved through theRandom test windowshown inFigure 9.
The user must specify the bounds of the scenario and the routing protocol used. The minimum and maximum number of nodes for testing must also be defined, along with the increase granularity (e.g., with a node interval between 4 and 10 nodes and a granularity of 2, Castadivaexecutes four tests with 4, 6, 8, and 10 nodes).Castadivaallows also to specify how many times each test will be repeated.
AP1
AP2 AP3 AP4 AP5
AP6 AP7 AP8
AP9 AP10
1200 m 1000 m 800 m 600 m 400 m 200 m
0 m 200 m 400 m 600 m 800 m 1000 m
Figure6: Scenario definition withCastadiva.
AP10
AP7
AP1
AP3 AP4 AP5
AP6
AP8
AP9
900 m 800 m 700 m 600 m 500 m 400 m 300 m 200 m 100 m
0 m 100 m 200 m 300 m 400 m 500 m 600 m 700 m 800 m 900 m
Figure7: Mobility implementation.
sleep 15
iptables -I INPUT -m mac –mac-source 00:14:BF:3C:39:EC -j DROP sleep 20
iptables -D INPUT -m mac –mac-source 00:14:BF:3C:39:EC -j DROP
Algorithm1: Iptables rules to emulate when a node goes out of range between seconds 15 and 35.
Figure9: Random test window.
4.2.6. Compatibility with the ns-2 Simulator. Castadivacan also import/export scenarios to/from ns-2, making it com-patible with the most widely used MANET simulator. This characteristic offers the possibility of comparing results and reaching more meaningful conclusions.
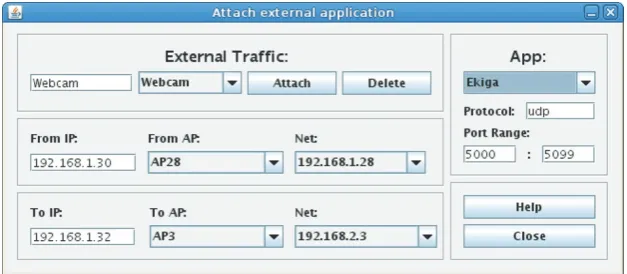
4.2.7. Castadiva Extensions for External Traffic Injection. Such functionality allows external nodes to generate real traffic of any kind and redirect it to specific nodes ofCastadiva. For this reasonCastadivaalso incorporates an extra component that allows attaching a laptop or a computer to a node.
Figure 10shows an example of this functionality.
This way we can use laptops to generate any flow of traffic and redirect it to specific nodes ofCastadiva. For example, you can use real applications like Ekiga to launch a video-conference and study the behaviour of H.323, SIP, and video streaming protocols in MANETs.
Figure 11shows an example of two laptops connected to
Castadiva. Both laptops have a webcam and run the Ekiga application to generate a videocall. Castadiva redirects all traffic related to this video-conference through the emulated MANET, from the entry to the output point.
5. Validation of Castadiva
In this section we validate the functionality and accuracy ofCastadivain different MANET scenarios. We divide our tests in two groups: first, we compare Castadiva with the ns-2 simulator using both TCP and UDP traffic in a static scenario; second, we then proceed with a similar analysis in a mobile scenario.
5.1. Evaluation of Castadiva with a Static Scenario. To validate the functionality of the proposed tool, and to test its
effectiveness, we have chosen a representative scenario where nodes are located in a way such that the maximum number of hops between nodes is of four. The topology used in our evaluation is shown inFigure 12.
The scenario is defined in a 1000 m×700 m area, and the test time is of 100 seconds. The selected scenario was generated by ns-2 and imported toCastadiva.
Since Castadivais completely compatible with the ns-2 file format for scenarios, we were able to compare both in a simple and straightforward manner.
We set the wireless nodes’ range to 250 meters. In terms of traffic, we define both UDP and TCP connections between each participating node and node 6. For TCP connections, the maximum transfer size is of 100 MB. UDP flows generate 55 packets per second, and packet size is fixed at 512 bytes.
In our first evaluation no routing protocol is being used.
Figure 13shows the results obtained in these tests. We can see that, as expected, wireless nodes that are out-of-range from node 6 are not able to communicate with it. This shows that both network topology and traffic definitions ofCastadiva
are being enforced correctly.
On both tests we observe that Castadiva has a lower throughput than ns-2. We must take into account that the shared wireless media is prone to both transmission errors and contention among stations, which is due to the wireless devices being placed physically close to each other. In the case of ns-2, only contention effects are simulated, which explains the observed discrepancy.
Figure10: External traffic declaration.
Entry
point
Castadiva emulated MANET
Output
point
Figure11: Example of how to add external traffic injection.
AP1
AP2 AP3
AP4
AP5 AP6
AP7 AP8 AP9
AP10
700 600 500 400 300 200 100 0
(m)
100 200 300 400 500 600 700 800 900 (m)
Figure12: Scenario used for evaluation purposes.
UDP tests show that traffic from nodes AP7, AP8, and AP9 is now able to reach the destination, while node AP10 remains isolated as intended. Notice that, for the former nodes, the packet loss ratio increases slightly with the number of hops to destination. With ns-2 we do not observe this behaviour for the reasons referred above.
Results with TCP traffic show that the throughput for nodes 1 to 5 is reduced compared to the previous experiment (Figure 13), which is due to competing traffic from AP7, AP8, and AP9. For these nodes throughput decreases with increasing number of hops, as expected. With ns-2 we observe that both AP8 and AP9 suffer from starvation; one of the reasons for this behaviour is that, withCastadiva, all nodes share a same medium and so packet collisions between out-of-range nodes do not occur.
Figure 15(a) shows how the effect of collisions as the number of hops increases in a 802.11 g wireless network. We make different tests, varying the load from 256 kb/s to 3 Mb/s. As can be seen, the number of hops makes the packet loss increase. This behaviour is normal in a wireless network due to interferences among devices but inCastadivait can be aggravate by the fact that all devices are close to one another. To better study how the proximity of the devices ofCastadivaaffects performance,Figure 15(b)compares the capacity offered byCastadivawith respect to other capacity models proposed in the literature for different scenarios. We select the following scenarios: (a) a grid topology [26], (b) a random topology [26], and (c) a chain topology [27]. We observe that, as expected, the capacity of the
0
AP1 AP2 AP3 AP4 AP5 AP6 AP7 AP8 AP9 AP10
Nodes
UDP: castadiva comparison with NS-2
NS-2 with UDP
AP1 AP2 AP3 AP4 AP5 AP6 AP7 AP8 AP9 AP10
Nodes
TCP: castadiva comparison with NS-2
NS-2 with TCP Castadiva with TCP
(b)
Figure13: Performance comparison betweenCastadivaand ns-2
in a static scenario using CBR/UDP traffic (a) and FTP/TCP traffic
(b). (routing disabled).
ones since all devices of Castadiva interfere with each other. Solutions such as ORBIT try to cope with this problem by mitigating the effect of the noise among nodes; however, it introduces new problems into the emulation as limiting the network topology and limiting the trans-mission range of all nodes, which is also far from the
real behaviour of a MANET. Castadiva makes a
trade-off between accuracy and price, offering a cheap and
portable platform that is good enough for almost all tests.
In terms of the control network (wired), we observe that the bandwidth consumption of the SSH protocol over Ethernet is far from approaching saturation, and that latency is low enough to allow adequate coordination of all nodes.
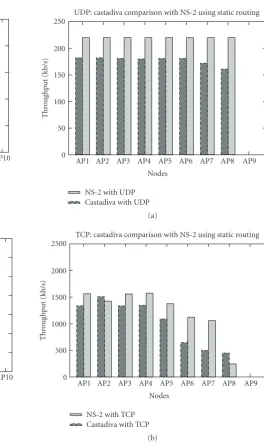
0
AP1 AP2 AP3 AP4 AP5 AP6 AP7 AP8 AP9 Nodes
UDP: castadiva comparison with NS-2 using static routing
NS-2 with UDP
AP1 AP2 AP3 AP4 AP5 AP6 AP7 AP8 AP9
Nodes
TCP: castadiva comparison with NS-2 using static routing
NS-2 with TCP Castadiva with TCP
(b)
Figure14: Performance comparison betweenCastadivawith ns-2
in a static scenario. Using CBR/UDP traffic (a) and FTP/TCP traffic
(b). Routing enabled.
5.2. Evaluation of Castadiva with a Mobile Scenario. We now define a mobile scenario with an area of 1000 m×700 m and simulation time of 500 seconds and we set the wireless nodes’ range to 250 meters. In terms of traffic, we define both UDP and TCP connections between each participating node and node AP7. For TCP connections, the maximum transfer size is of 1000 MB. UDP flows generate 4 packets per second, and packet size is fixed at 512 bytes. In the first test, each node has a maximum speed of 5 m/s and no routing protocol is used.
Figure 16 shows a node-by-node comparison between
Castadiva and ns-2 for both UDP and TCP traffic. The selected scenario was generated by ns-2 and imported to
0
60 Influence of the noise among devices
Pa
Capacity of ad hoc networks
Capacit
Figure15: Packet loss due to the proximity of the devices in an emulation (a) and capacity of an ad hoc network compared with Castadiva (b).
The figure shows that the obtained results are quite similar, which validates Castadiva’s implementation. Since we have not selected any routing protocol, transmissions are successful only when the destination is a 1-hop neighbour. We also observe that Castadiva has, in general, a lower throughput/delivery rate than ns-2. WhenCastadivais used, the shared wireless media is prone to both transmission errors and contentions among stations. In the case of ns-2, only contention effects are simulated, which explains the observed discrepancy for UDP traffic. In the case of TCP traffic, results are more heterogeneous since it is a stateful, bandwidth-greedy protocol prone to present nonlinearities, specially in mobile ad hoc network environments. In terms of routing, we picked the OLSR routing protocol since its
0
AP1 AP2 AP3 AP4 AP5 AP6 AP7 AP8 AP9 Nodes
UDP: castadiva comparison with NS-2 (max node speed 5 m/s)
NS-2 with UDP
AP1 AP2 AP3 AP4 AP5 AP6 AP7 AP8 AP9
Nodes
TCP: castadiva comparison with NS-2 (max node speed 5 m/s)
NS-2 with TCP Castadiva with TCP
(b)
Figure16: Result comparison ofCastadivawith ns-2 without rout-ing.
Table2: Default OLSR parameter values.
Parameter Value used
HELLO INTERVAL 2 s
REFRESH INTERVAL 2 s
TC INTERVAL 5 s
MID INTERVAL TC INTERVAL
HNA INTERVAL TC INTERVAL
implementation is available for both testing environments (simulated and real), being quite similar.
0
AP1 AP2 AP3 AP4 AP5 AP6 AP7 AP8 AP9 Nodes
UDP: castadiva comparison with NS-2 (max node speed 5 m/s) using OLSR
NS-2 with UDP
AP1 AP2 AP3 AP4 AP5 AP6 AP7 AP8 AP9
Nodes
TCP: castadiva comparison with NS-2 (max node speed 5 m/s) using OLSR
NS-2 with TCP Castadiva with TCP
(b)
Figure17: Result comparison ofCastadivawith ns-2 for UDP (a)
and TCP (b) traffic with routing.
Figure 17 shows the similitude between Castadiva and ns-2 for both UDP and TCP traffic. In these tests, nodes virtually situated more than 1-hop away are also able to send traffic to the destination node thanks to the routing protocol. Similarly to the test without a routing protocol,Castadivahas a lower throughput/delivering rate than ns-2, for the same reasons explained before. In the case of TCP traffic, results are more heterogeneous as in the test without routing.
We now evaluate the impact of node speed. To do that we vary the degree of mobility in different scenarios, testing with maximum node speeds of 0, 5, 10, 15, and 20 m/s. As for the previous test, each scenario was generated by ns-2 and imported toCastadivato have exactly the same mobility patterns.Figure 18shows the results obtained in this test.
0
Maximum node speed (m/s) UDP: castadiva comparison with NS-2
testing different nodes speed
NS-2 with UDP
Maximum node speed (m/s) TCP: castadiva comparison with NS-2
testing different nodes speed
NS-2 with TCP Castadiva with TCP
(b)
Figure 18: Comparison ofCastadivaand ns-2 at different node
speeds with both UDP (a) and TCP (b) traffic. (routing disabled).
On both tests we observe that Castadiva has a lower throughput than ns-2. For TCP we observe that the difference betweenCastadivaand ns-2 is more significant than for UDP. To discover the reason of this, we study a controlled scenario with only two nodes and measure the arrival time of each packet. With this experiment we obtain the mean delay to do a rerouting when the OLSR performs a topology update. In ns-2 it is of five seconds. However, our nodes have a mean delay of almost eight seconds. This three-second difference causes TCP agents in ns-2 to achieve a higher throughput.
0
Maximum node speed (m/s) UDP: castadiva comparison with NS-2 testing different nodes speed using OLSR
NS-2 with UDP TCP: castadiva comparison with NS-2 testing different nodes speed using OLSR
NS-2 with TCP Castadiva with TCP
(b)
Figure 19: Comparison of Castadiva and ns-2 using OLSR at
different node speeds with both UDP (a) and TCP (b) traffic.
Again we observe important similarities between Cas-tadivaand ns-2’s results. For both UDP and TCP traffic the behaviour of these platforms is quite similar. WithCastadiva
we achieve slightly less throughput than with ns-2 for the reasons explained inSection 5.1. Tests show that the average percentage of UDP packets received is increased when a routing protocol is used, since it allows nodes AP9 and AP10 to reach their destinations. When studying the behaviour of the network using TCP traffic instead we observe that the average throughput is not increased because, in both simulations, the network is saturated. When looking at the overall trend, though, we find that there is a high degree of resemblance between both.
200 400 600 800 1000 1200 1400 1600 (m)
Figure20: Topology for evaluating video traffic delivery.
6. Assessing the Performance of
Videoconferencing in MANETS with
Castadiva
We now describe the performance results obtained when transmitting real-time video traffic through Castadiva. We test with several different scenarios where the purpose is to stress the application and evaluate the impact of the number of hops in the quality of the received video stream. We are going to employ two different kinds of video streams: a standard videocall, where the video sequence is almost static, and a more dynamic videocall, where we will point the webcams towards a screen displaying a movie.
Similarly to the previous section, we will perform tests in both static and mobile scenarios.
6.1. Static Scenario Evaluation. Initially we evaluate the performance of a videocall in a static MANET for reference.
The scenario is defined in a 1500 m×1800 m area, and the test time is of 5000 seconds. We set the wireless nodes’ range to 250 meters. To monitor the video traffic we use the tcpdump application [28].
To generate the video traffic we have two laptops with a webcam attached and running Ekiga, an open source VoIP, and videocall application for Linux.
We generate an emulated MANET topology where all nodes are aligned according to a chain topology.Figure 20
shows the topology used when eleven nodes are deployed. In each laptop we redirect all traffic sent to the other laptop through the wireless routers located at both edges of the simulation (AP1 and AP11 in this scenario). We also configure Castadiva to route all video traffic through our testbed.
Table3: OpenWRT parameters values for the OLSR protocol.
Parameter Used values
HELLO INTERVAL 5 s
HELLO VALIDITY 15 s
TC INTERVAL 2 s
TC VALIDITY 15 s
MID INTERVAL 15 s
MID VALIDITY 300 s
HNA INTERVAL 15 s
HNA VALIDITY 300 s
Therefore, instead of using the default RFC parameters, we used the default configuration of OLSR implemented in the OpenWRT system, that are considered optimum for a standard mesh network.Table 3shows these values.
The effects we want to study are the variations in terms of throughput, delay and jitter when varying the numbers of hops in the network.
6.1.1. Evaluating the Performance with a Standard Videocall.
We now present the results obtained when usingCastadiva
to evaluate a standard videocall between two users. Based on traffic traces at source and destination, we measured the throughput and the interpacket delay (jitter).
Figure 21(a)shows the mean throughput obtained for the generated data rate at different number of hops. As we increase the number of hops, we appreciate that the average throughput is decreased to less than a twentieth compared to the one hop scenario (from around of 700 Kb/s to close to 30 Kb/s).Figure 21(b)shows how the packet loss increases when we vary the number of intermediate hops between sender and receiver. In a scenario with more than 9 hops the packet loss rate is significant for the videocall. In particular, for a scenario of 10 hops, the videocall experiences a 10% of packet loss.
Figure 22shows the cumulative distribution function for the interpacket generation interval and interpacket arrival interval in two scenarios where source and destination are one and twelve hops away, respectively. In the scenario with one hop, the smallest network possible, we can appreciate the differences between the minimum interpacket generation time at the source (around 0.01 millisecond) and the minimum interpacket arrival time at the receiver (around 0.1 millisecond). Also, 50% of the packets have an interpacket generation time of less than 0.03 millisecond, but the interpacket arrival time is typically of more than 1 millisecond.
In the scenario with ten hops, if we compare the interpacket arrival time with the one obtained in the one hop scenario, we can appreciate an increase of more than 2 milliseconds. This is caused by the forwarding time of the additional nodes on the path. This is expected since these packets, usually generated back-to-back by the videoconferencing application, experience significant jitter when traversing an ad hoc network with a high number of hops.
Figure21: Average data rate generated (a) and packet loss ratio (b)
for different numbers of hops.
6.1.2. Evaluating the Performance of a Movie Transmission. In the previous section our experiments relied on a standard videocall. The characteristics of such videoconference— low degrees of video motion—do not impose significant demands in terms of network bandwidth. Therefore, we repeat our experiments with a higher motion video. With that purpose we pointed both webcams (each vinculated to a communication endpoint) to a screen showing a movie. Such strategy also allows running long experiments without the intervention of users. By repeating our experiments and taking long sampling periods we were also able to obtain meaningful values for the end-to-end delay, and so we include them in this section, as well as the measured throughput and jitter for comparison against the previous test. Figure 23 shows the working area used in these tests where we can observe both webcams pointing to a screen showing a film.
0 10 20 30 40 50 60 70 80 90 100
Video data
C
u
m
ulati
ve
dist
ribution
function
(%)
0.01 0.1 1 10 100 1000
Inter-packet interval (milliseconds)
Inter-packet generation times Inter-packet arrival times
(a)
0 10 20 30 40 50 60 70 80 90 100
Video data
C
u
m
ulati
ve
dist
ribution
function
(%)
0.01 0.1 1 10 100 1000
Inter-packet interval (milliseconds)
Inter-packet generation times Inter-packet arrival times
(b)
Figure 22: Cumulative distribution function for the interpacket generation interval and interpacket arrival interval in a scenario with one hop (b) and ten hops (a).
and the decoded one because the path is too short. In a scenario with ten hops, though we can verify the poor perfor-mance obtained by comparing the received and transmitted sequences, we also appreciate a delay of the received image compared to the real image (notice that both webcams aim at a same target for comparison purposes).
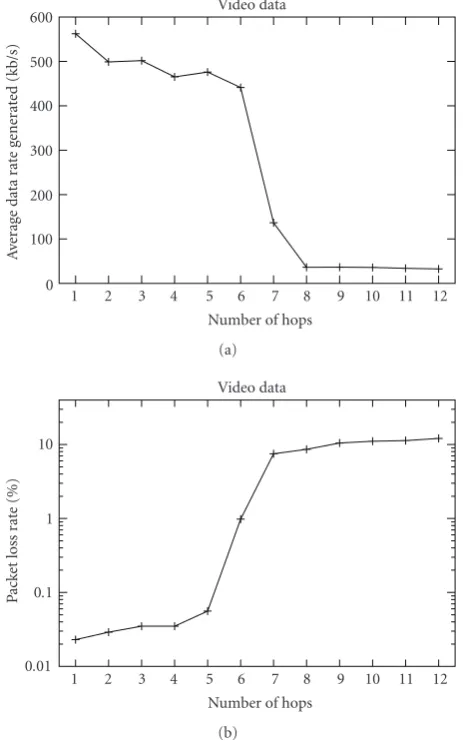
Figure 25(b)shows the mean throughput obtained for the generated data rate obtained for a different number of hops. In a scenario with one hop, we have a mean data rate above 500 Kb/s. In a scenario with 13 hops, the mean value of the generated data rate decreases to less than 100 Kb/s due to Ekiga’s bandwidth throttling mechanism. We also evaluate the packet loss in each scenario.Figure 25(b)shows how the packet loss increases when we vary the intermediate hops between sender and receiver. If we compare this graphic with
Figure23: Testing a videocall when both webcams point to screen with a movie.
(a)
(b)
Figure24: Screenshot of the videocall with a scenario of one hop (b) and ten hops (a).
the one obtained in the evaluation of a real videoconference, we can observe that now the packet loss rate increases more significantly. In fact, for more than 6 hops, the packet loss rate surpasses 10%.
0
Figure25: Cumulative distribution function for the throughput in
a scenario with different hops (b) and packet loss rate in different
scenarios (a).
high delay values are quite prone to occur in this case, often introducing significant jitter (above 100 milliseconds).
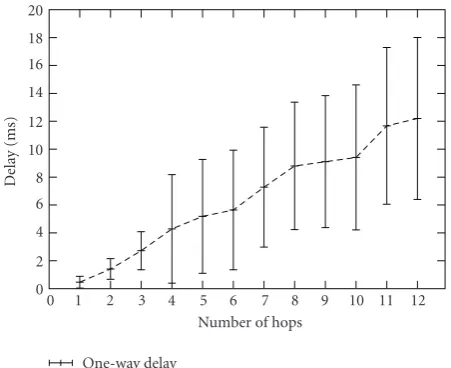
6.1.3. Evaluating the Round-Trip Time of the Different Scenarios. We also evaluated the impact of increasing the number of hops on delay by using ping sessions and measuring the impact on round-trip time while maintaining videoconference sessions active. We generate a ping session between the two laptops in the chain scenario described earlier, varying the number of hops from one to ten. We obtain the average time of the ping session used to send a packet and receive the answer. To obtain the one-way delay, we divided the results obtained by two.
Figure 27 shows the average delay and the standard deviation for each scenario. As expected, delay increases almost linearly with the number of hops between sender and receiver. Of special interest is the increase in terms of standard deviation, which can be quite problematic for real-time video transmission.
Figure 26: Cumulative distribution function for the interpacket generation interval and interpacket arrival interval in a scenario with one hop (a) and ten hops (b).
6.2. Dynamic Scenario. In this section we evaluate different scenarios with a dynamic topology. We change the nodes’ mobility by testing with the following speed values: 3, 6, 9, 12, 15 meters per second. The scenario is defined in a 1500 m×900 m area, and the test time is of 5000 seconds. We set the wireless nodes’ range to 250 meters. To generate the video traffic we have two laptops with a webcam attached running Ekiga. In this test, as for the static scenario, we also differentiate between two types of scenarios: a standard videocall and a videocall where the webcams point to a movie being displayed.
0
Figure27: Evaluation of the ping sessions in different scenarios.
Table4: OLSR values used for the mobility scenarios.
Parameter Used Values
ELLO INTERVAL 2 s
HELLO VALIDITY 6 s
TC INTERVAL 5 s
TC VALIDITY 15 s
MID INTERVAL 5 s
MID VALIDITY 15 s
HNA INTERVAL 5 s
HNA VALIDITY 30 s
Table 5: Percentage of the simulation time when exists a route between both laptops.
Mobility % time with route
3 m/s 64.72
6 m/s 65.32
9 m/s 85.70
12 m/s 91.77
15 m/s 93.74
Since, for these tests, we picked a particular OLSR configuration, the first step is to measure the total amount of time that the route between both laptops is established. For this test we emulate 20 random scenarios for each speed, and we measure with a ping if the route has established or not.
Table 5 shows total percentage of time the route is established.
The percentage of time without route is directly related to the amount of time that OLSR needs to obtain a route when the topology is changing plus the time when the network is split, and there is no possible route between the two laptops.
6.2.1. Evaluating the Performance with a Standard Videocall.
As in Section 6.1, we first evaluate the behaviour of a standard videocall in a MANET. Since the number of hops
0
Figure28: Throughput and packet losses with a standard videocall in a scenario with mobility.
is variable in each simulation due to mobility, in this case we study the variation of the throughput with different node speeds as well as the packet losses since the protocol is based on UDP.
Figure 28shows the results obtained in this set of tests. As we can observe, higher mobility translates into better performance of the network and less percentage of packets lost. This is due to a the higher route availability, as shown inTable 5. Higher speeds avoid lengthy network partitioning effects, which are translated as a better service with a higher average throughput.
6.2.2. Evaluating the Performance of a Movie Transmission.
In this section we also measure the throughput obtained by the videoconferencing participants when streaming a movie being displayed.
0
Figure29: Throughput and packet losses with a movie in a scenario with mobility.
a movie, the video is more complex than the nearly static image of a standard videocall.
If we compare this figure with the one shown when evaluating a standard videocall, we can see a similar trend. The last test shows a higher throughput, as the transmitted video generates a higher data rate. Packet losses are decreased as in the standard videocall because (1) we have a higher throughput when a route is established due the type of video captured, (2) Ekiga’s bandwidth throttling mechanism decreases the packet injected when a route is lost, and (3) on average we have the same time periods without routes between the two laptops as in the previous tests. Jointly, these factors explain why the total percentage of packets lost is reduced at higher node speeds (within the speed range tested).
7. Conclusions
In this work we present Castadiva, a novel architecture to improve research in the MANETs field by allowing to make
real testbed experiments in a simple and straightforward manner.
Castadivacombines the convenience and productivity of Java with the power of the Linux kernel and accompanying tools to emulate an ad hoc network environment. The system was designed to simplify the tasks of scenario generation and starting traffic flows among independent, IEEE 802.11-based, wireless nodes. One of its key advantages is that it is fully compatible with the ns-2 simulator.
The architectural design ofCastadivadifferentiates wire-less nodes, used for the actual experiments, from the core application, which has management and control purposes. This core application provides an easy interface to define network topologies and traffic flows between nodes. Those definitions are then translated into run-time instructions sent to testbed nodes when experiments are on-going. We observed that the use of SSH protocols and Fast Ethernet connectivity allows nodes to synchronize the start of an experiment with high accuracy, being all instructions read at once; afterwards, the testbed relies on individual clocks to synchronize instructions throughout the remaining time of an experiment.
An important issue when designingCastadivawas that of ns-2 compatibility.Castadivais compatible with the file format used by the ns-2 simulator. In the validation section, we compared the results obtained with Castadiva and the ns-2 network simulator. By using both TCP and UDP data traffic, and under a variety of static and dynamic MANETs scenarios, we show thatCastadivais able to offer confident results while using cheap wireless off-the-shelf devices.
Castadiva was also extended to allow injecting traffic from external applications. Such functionality enabled us to assess the performance of videoconferencing in an emulated ad hoc network using a real application such as Ekiga. We studied the behavior of a videocall in both static and dynamic scenarios. For the static scenario we change the number of hops between caller and receiver from one to ten. We also vary the characteristics of the video being transmitted. The results obtained in the video evaluation show that, for a large number of hops, delay times are quite high, typically provoking annoyance to the videocall users. Packet losses also become problematic when source and destination are more than six hops away. Additionally, our experiments showed that the OLSR routing protocol is prone to suffer from instability if the hop count is high, despite altering the default parameter values to more efficient ones.
Concerning the mobile scenario, the tests performed show that, on average, a MANET can be used to support a videocall with mobility, being the quality of the video decreased and having a percentage of time without service between 7% and 36% of the total time, depending on the nodes’ speed. In general, we can assert that higher degrees of mobility are better to avoid nodes becoming isolated for long periods of time.
To summarize, this work shows that the advantages of
using Castadiva with respect to other MANET test-beds
straightforward manner, and (3) it does not occupy a lot of physical space.
Castadiva is free software developed under the GNU
GPL licence and can be downloaded at http://castadiva
.sourceforge.net/.
Acknowledgment
This work was partially supported by the Ministerio de Ciencia e Innovaci´on, Spain, under Grant TIN2008-06441-C02-01.
References
[1] M. Conti and S. Giordano, “Multihop ad hoc networking: the
theory,”IEEE Communications Magazine, vol. 45, no. 4, pp.
78–86, 2007.
[2] J. L. Burbank, P. F. Chimento, B. K. Haberman, and W. T. Kasch, “Key challenges of military tactical networking and the
elusive promise of manet technology,”IEEE Communications
Magazine, vol. 44, no. 11, pp. 39–45, 2006.
[3] C. Perkins, E. Belding-Royer, and S. Das, “Ad hoc on-demand distance vector (AODV) routing,” Request for
Com-ments 3561, Network Working Group, http://www.ietf.org/
rfc/rfc3561.txt, July 2003.
[4] T. Clausen and P. Jacquet, “Optimized link state routing pro-tocol (olsr),” Request for Comments 3626, MANET Working
Group,http://www.ietf.org/rfc/rfc3626.txt, October 2003.
[5] D. Johnson, P. Y. Hu, and D. Maltz, “The dynamic source routing protocol (dsr) for mobile ad hoc networks for ipv4,” Request for Comments 4728, MANET Working Group, http://www.ietf.org/rfc/rfc4728.txt, February 2007.
[6] I. D. Chakeres and C. E. Perkins, “Dynamic MANET on-demand (DYMO) routing protocol,” IETF Internet Draft, November 2007.
[7] USC/ISI UC Berkeley and LBL and Xerox PARC researchers,
“Network simulator—ns (version 2),” http://www.isi.edu/
nsnam/ns/, 1998.
[8] OPNET Technologies Inc, “OPNET making networks and
applications performs,”http://www.opnet.com/.
[9] M. Kojo, A. Gurtov, J. Manner, P. Sarolahti, T. Alanko, and K. Raatikainen, “Seawind: a wireless network emulator,” in
Proceedings 11th GI/ITG Conference on Measuring, Modelling and Evaluation of Computer and Communication Systems (MMB ’01), Aachen, Germany, September 2001.
[10] S. Keshav,REAL: a network simulator, University of California,
Berkeley, Calif, USA, 1988.
[11] T. R. Andel and A. Yasinsac, “On the credibility of manet
simulations,” IEEE Computer Society, vol. 39, no. 7, pp. 48–
54, 2006.
[12] D. A. Maltz, J. Broch, and D. B. Johnson, “Experiences designing and building a multi-hop wireless ad hoc network
testbed,”IEEE Journal on Selected Areas of Communications,
vol. 17, no. 8, pp. 1439–1453, 1999.
[13] Ekiga, free your speech,http://ekiga.org/.
[14] J. Rosenberg, H. Schulzrinne, G. Camarillo, A. John-ston, and J. Peterson, “Sip: session initiation protocol,” Request for Comments 3261, MANET Working Group, http://www.ietf.org/rfc/rfc3261.txt, June 2002.
[15] ITU-T, “Packet-based multimedia communications systems,” http://www.itu.int/rec/T-REC-H.323/en, June 2006.
[16] P. Baran, “On distributed communications,” The RAND Corporation, 1964.
[17] D. Raychaudhuri, I. Seskar, M. Ott, S. Ganu, and K. Ramachandran, “Overview of the orbit radio grid testbed for evaluation of next-generation wireless network protocols,” in Proceedings of the IEEE Wireless Communications and Networking Conference (WCNC ’05), vol. 3, pp. 1664–1669, New Orleans, La, USA, March 2005.
[18] A. Karygiannis and E. Antonakakis, “MLab: an ad hoc
network test bed,” inProceedings of the 3rd IEEE Consumer
Communications and Networking Conference (CCNC ’06), vol. 2, pp. 1312–1313, National Institute of Standards and Technology, Las Vegas, Nev, USA, January 2006.
[19] G. Judd and P. Steenkiste, “Design and implementation of an RF front end for physical layer wireless network emulation,” in
Proceedings of the 65th IEEE Vehicular Technology Conference (VTC ’07), pp. 974–979, Dublin, Ireland, April 2007. [20] Y. Zhang and W. Li, “An integrated environment for
testing mobile ad hoc networks,” http://www.wins.hrl.com/
projects/adhoc.
[21] J. Zhou, Z. Ji, M. Varshney, Z. Su, and Y. Yang, “Whynet: a hybrid testbed for large-scale, heterogeneous and adaptive
wireless networks,” inProceedings of the 1st ACM International
Workshop on Wireless Network Testbeds, Experimental Evalua-tion and CharacterizaEvalua-tion (WiNTECH ’06), vol. 3, pp. 111–112, Los Angeles, Calif, USA, 2006.
[22] “OpenWRT, wireless freedom,”http://openwrt.org.
[23] T. Ylonen and C. Lonvick, “The secure shell (ssh) authen-tication protocol,” Request for Comments 4252, MANET
Working Group,http://www.ietf.org/rfc/rfc4252.txt, January
2006.
[24] B. Hubert, “Linux advanced routing & traffic control
HOWTO,” 1.43 edition,http://lartc.org/, 10 2003.
[25] C. Bettstetter, G. Resta, and P. Santi, “The node distribution of the random waypoint mobility model for wireless ad hoc
networks,”IEEE Transactions on Mobile Computing, vol. 2, pp.
257–269, 2003.
[26] P. Gupta and P. R. Kumar, “The capacity of wireless networks,”
IEEE Transactions on Information Theory, vol. 46, no. 2, pp. 388–404, 2000.
[27] J. Li, C. Blake, D. S. J. De Couto, H. I. Lee, and R. Morris,
“Capacity of ad hoc wireless networks,” inProceedings of the
7th Annual International Conference on Mobile Computing and Networking (MobiCom ’01), pp. 61–69, ACM, New York, NY, USA, 2001.
[28] S. McCanne, V. Leres, and V. Jacobson, “The tcpdump manual page,” Lawrence Berkeley Laboratory, 6 89.
[29] C. Gomez, D. Garcia, and J. Paradells, “Improving perfor-mance of a real ad-hoc network by tuning olsr parameters,” inProceedings of the 10th IEEE Symposium on Computers and Communications (ISCC ’05), Murcia, Cartagena, Spain, June 2005.
[30] Y. C. Huang, S. N. Bhatti, and D. Parker, “Tuning olsr,” in