R E S E A R C H
Open Access
Energy-efficient border intrusion detection
using wireless sensors network
Tao Yang
*, Dejun Mu, Wei Hu and HuiXiang Zhang
Abstract
Monitoring the illegal movement across national border effectively is a challenging problem. The emerging technology of wireless sensor network (WSN) is expected to provide a new way to realize energy-efficient border intrusion detection. We propose a scheme to measure and guarantee the coverage quality of WSN. We also design a new coverage model for detecting one-direction path. The simulation results shows that the new coverage model could not only detect the intrusion in border area well, but also extend the network lifetime in an efficient way.
Keywords: Wireless sensor network; Barrier coverage; Quality; Localized algorithm
Introduction
Over the past few years, wireless sensor networks (WSNs) and their various applications is evolving quickly and known to be an important area of research. Wireless sensor networks have numerous applications such as in environmental, ecological, agricultural, military and med-ical treatment. Security has become the most important issue in worldwide nowadays.
Meanwhile, real-time detection of border intrusion is becoming a tough factor of any country. Monitoring borders requires large amount of equipments and labor power. So wireless sensor networks could be an intelligent manner to solve these problems. In the deployed region, the sensors could be organized as groups to construct a barrier. One important observation is the linearity of sen-sors’ energy consumption which means that the death of sensors could be predicted. So the research must pay more attention to the sink nodes to which indicate the weak zone. We actually discuss the methods to guarantee the quality of coverage and the new coverage model which could be more energy efficient.
In the past research results, researchers only consider whether or not a sensor network provides barrier cover-age. This is equivalent to measuring its quality as either 0 or 1 [1-3]. We believe quality of barrier coverage is not binary. Consider the two sensor deployments in Figure 1.
*Correspondence: yangtao107@nwpu.edu.cn
Department of Automation, Northwestern Polytechnical University, West YouYi Road, 710072 Xi’an, China
Neither of them provides 1-barrier coverage, as there exist crossing paths that are not covered by at least two sensors. However,even though neither network provides 100% 1-barrier coverage, it is apparent that network (b) provides much better barrier coverage than network (a). We are interested in a metric that will assign a value to a sensor network to indicate its quality of barrier coverage.
If sensor failures cause the network to fall below a desired level of “quality” for barrier coverage, we want to know which parts of the network need repair. It will not be cost effective to redeploy the entire network if, for example, adding a few sensors to some “weak” parts will be sufficient. These considerations have motivated us to consider the following problem.
For border intrusion detection, the manager only con-cern the illegal intrusion, so it is not necessary to detect both bidirectional intrusion. This factor inspires us to define a new coverage model which is also energy efficient in this application.
Organization. The rest of this article is organized as follows. Section ‘Related work’ mentions some related work, and Section ‘Problem statement: energy efficiency and quality of the wireless sensor network’ defines the relationship between energy efficiency and coverage qual-ity. Sections ‘Measuring the quality of the barrier cover-age’ constitute the theoretical foundations of measuring quality of barrier coverage and repairing weak zones. A new coverage model, which is called one-direction bar-rier coverage, for some intrusion detection applications
Figure 1Two different coverage models.Although both of them could not detect every path through the region,(b)could provide higher quality than(a).
is introduced in Section ‘Intrusion detection’. Section ‘Conclusion’ concludes the work.
Related work
Border patrol has extensively been based on human involvement. Unmanned Aerial Vehicles (UAVs) for aerial surveillance have recently been used to automatically detect and track illegal border crossing [4-6].
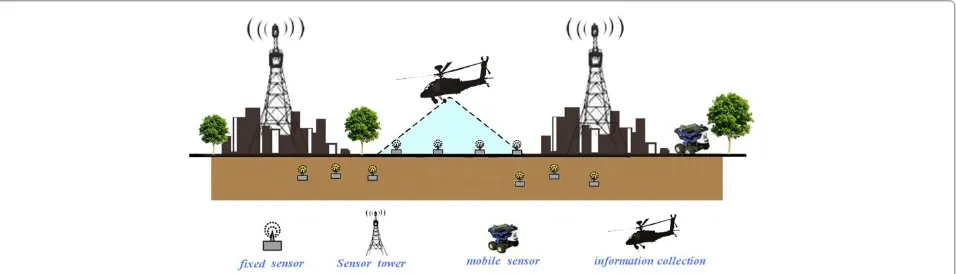
Current WSNs for border patrol are based on a flat, homogeneous architecture in which every sensor has the same physical capabilities and can only interact with neighboring sensors. The border intrusion detection is a multilayered structure system as shown in Figure 2.
In 2008, a “virtual fence” was built near Nogales and Arizona by Department of Homeland Security, which cov-ered 28 miles stretch of the U.S.-Mexico border. But the project had to be delayed for at least three years due to some technical problems [7].
The wireless sensor network for surveillance in spe-cific area is proposed in [8,9]. After that, more and
more researchers focus on putting the wireless sensor network into practice. Some paper discussed the prob-lem in full coverage network mode [10-12]. The con-cept of barrier coverage was first introduced by Gage in the context of robot systems [13]. An interesting algorithm to determine whether a network provides bar-rier coverage is provided in Kumar et al. [14]. Some researchers interested in maximizing the lifetime of net-work. A centralized wakeup/sleep scheme for reach-ing the full coverage condition is proposed in [15]. Ai designed a localized wakeup/sleep scheme to supplement the problem of activating sensors and it achieved a good performance [16].
Beside the coverage quality, a algorithm was intro-duced in [17] for measuring the quality of sensors’ k-connectivity. They added some moving robots in weak zone to keep the network with low redundancy. The new metric was proposed in [18] for coverage quality and it shared with a similar flavor to measure quality and repaired the zones that are not reach desire level.
Quality of surveillance (QoSv) in sensor networks has been addressed in the literature. The QoSv can be defined as the minimal and maximal exposure path within the cov-ered field [19]. The centralized and distributed algorithms are presented in Meguerdichian et al. [19], Megerian et al. [20] and Veltri et al. [21]. Gui and Mohapatra defined the QoSv as the reciprocal value of the expected travel distance before mobile targets are first detected by any sensor, and presented the algorithm of calcu-lating it if the nodes are independently and uniformly distributed [22]. Jeong et al. defined the QoSv as the reciprocal value of the average detection time of mobile targets, and proposed an optimal scheduling algorithm that guarantees the required QoSv and at the same time minimizes the overall energy consumed by the sensor nodes [23]. In some sense, all of these different met-rics for QoSv can be considered the measure of qual-ity of full coverage. However, they are not suitable as the measure of quality of barrier coverage in border patrol.
Meanwhile, Target tracking has long been an active topic in sensor network research [24-28]. Some researchers focus on single-target tracking while oth-ers are interested in multiple-target tracking. Many researchers believe that simple sensor models, such as the binary sensor model, are more realistic in sensor networks [29,30]. Kalman filtering is often used for the classical tracking with Gaussian models for sensor read-ings. Recently, the use of Particle filters has become popular to handle more general observation models. Tar-get tracking research addresses on how to track the whole trajectories of targets. Therefore, full coverage is normally necessary for target tracking.
Our research is based on the above results, we measure the barrier coverage for border detection and classify the different level of coverage quality. We also propose the method to improve the coverage quality and the network stability. Furthermore, we concentrate on identifying the direction of targets by using much less sensors.
Problem statement: energy efficiency and quality of the wireless sensor network
The mainconstraint that makes WSNs different from tra-ditional networks is the battery problem [31]. It should be carefully taken into consideration in any algorithm or approach related to sensor network operations. This sit-uation causes researchers to deal with network lifetime improvement in different aspects of networking.
Some researchers discuss the feasibility of deploying the wireless sensor network in some rough topography area. In fact, it is not necessary to cover the entire border. The terrain can be helpful in reducing cost since some areas will be inaccessible for human and hence sensor nodes need not be spread in these areas.
Another concern while considering the use of sensor nodes is how the nodes will be deployed. If sensors are air dropped then the number of sensors required will be much higher. This issue can be addressed by placing the sensors using a helicopter. In the terrain which is accessi-ble, the nodes can be placed manually by traveling short distances in a helicopter (if roads are nonexistent). If the terrain is difficult to access, then air dropping is an option or more advanced techniques like using laser guns to shoot and place the sensors in the ground may also be used.
When the wireless sensor network is deployed in a region for monitoring, sensors may fail due to various reasons such as heat, damp or other extreme weather conditions. A common method to solve such problem of failures is to deploy more redundant sensors in the region. Once the sensors’ energy is completely exhausted, they will replace the failure sensors to construct a new bar-rier in the region. But after a period of time, the network will be more unstable. With the coverage area decreas-ing, the properties of coverage quality will fail below a desired level. Thus, more weak zones will be appear in the monitoring region. So we need to detect the properties of coverage quality at any time and have a scheme to repair the weak zone. This mechanism has Lower costs than redeploy the entire network. And it is good at obtaining the status of the whole network. In this paper we mainly considered above situations under barrier coverage. We are interested in measuring the quality of barrier cover-age and proposing a suitable model for border intrusion detection.
Network model
Definition 1.Belt Region: A belt (region) has four boundaries. Two of them are parallel, and the other two are orthogonal to the two parallel ones. The Euclidean dis-tance between two parallel boundaries is the width of the belt,W, while the Euclidean distance between two orthog-onal boundaries is the length of the belt, L. Shown in Figure 3.
Definition 2.Barrier: A barrier is a sensor group which starts from the left boundary to the right. There might have more than one barriers in a belt region.
Definition 3.Coverage Graph, G(N): A coverage graph of a sensor network N is constructed as follows. Let G(N) = (V;E). The set V consists of a vertex corresponding to each sensor. In addition, V has two virtual nodes, m and t that correspond to the left and right boundaries (shown in Figure 4).
Figure 3Belt.A belt (region) has four boundaries.Two of them are parallel, and the other two are orthogonal to the two parallel ones.
distinct sensors. A sensor network provides k-barrier cov-erage over a belt region if all break paths through belt are k-covered by sensors (shown in Figure 5).
We then introduce some quality notations as follow
Local barrier coverage quality
We have defined a belt region B as the union of a set S of crossing line segments. Relative to this set S, we will define the notions of zone and local barrier coverage. For that purpose, we assign a “coordinate” to each element in S as follows (shown in Table 1).
Definition 5.Belt and Belt-Like Region: A belt-like region is the region between two nonintersecting curves C1 and C2. (As informally mentioned previously, these two curves are the horizontal boundaries of the region.) A belt-like region B is said to be a belt region (or just belt for short) if B is equal to the union of a set of crossing line seg-ments which are pairwise disjoint except possibly sharing an endpoint. That is, there exists a set S of crossing line segments such that B =∪S, and∀l1, l2∈S (l1=l2), either l1∩l2=∅or l1∩l2= p where p is a point in C1or in C2 (shown in Figure 6).
The belt-like sometimes are not really belt regions. As shown in Figure 6, the belt-like region is not a belt because there is no crossing line segment that is contained in the belt and contains the tip a (as well as any point near a). In fact, if the boundaries of a belt-like region are smooth
without “barbs” or “hooks”, then the region is most likely to be a belt region. In applications, such barbs or hooks (as illustrated in Figure 6) should be avoided when planning on a belt region.
Definition 6.Proportional Segment: Let C1and C2be a belt-like region B’s top and bottom boundaries, respec-tively. For any points p1 ∈ C1 and p2 ∈ C2 such that gp1/GC1 = gp2/GC2 , the line segmentp1p2is said to be a proportional segment for B.
Definition 7. Coordinated Segment and Its Coordinate, Vl: Let C1and C2be a belt B’s top and bottom boundaries,
respectively. Let S be the set of line segments mentioned in Definition 5. For any l =p1p2∈S, where p1∈C1 and p2∈ C2, the coordinate oflis defined to be Vl= (gp1+ gp2)/2. (The notation gpwas defined in the paragraph preceding
Definition 6.) Each element in S is said to be a coordinated (line) segment relative to S. Coordinates relative to a set S are well defined in the preceding definition in the sense that different elements in S have different coordinates, as proved next.
Definition 8.Leftmost/Rightmost Coordinated Segment: Let Sabe sensor node a’s sensing region. Define Sa’s
left-most coordinated segment, denoted by ll(a), to be the coordinated line segment that intersects Sa and has the smallest coordinate (V value) among all coordinated seg-ments intersecting Sa. Sa’s rightmost coordinated segment is defined similarly and is denoted byrl(a).
Figure 5k-barrier coverage.When an intruder cross the belt region, the number of activate sensor is the k, and the belt region could provide k-barrier coverage means that every path across the belt through k sensors.
Definition 9.Crossing Path. The crossing path is a path of an intruder, who pass through the belt region in the vertical direction.
Definition 10.Zone. A zone, Zi, is a slice of the belt
region. Two of its edges coincide with the belt’s two hori-zonal boundaries, and the other two edges are coordinated segments l1 and l2. The length of a zone Zi, denoted by
SZ, is defined as|Vl2- Vl1|(which can be readily shown to equal the average length of the two horizonal boundaries of the zone).
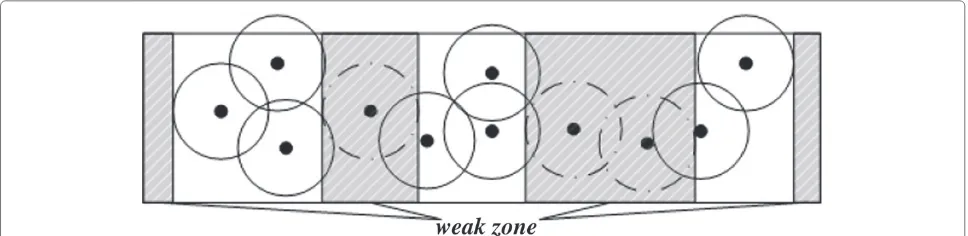
Definition 11.Weak Zone,ZwiA weak zone,Zwi, is a
slice of the belt region. Two of its edges coincide with the belt’s two parallel boundaries, and the other two edges are orthogonal break paths. We denote the longest line from left boundaries to right boundaries as the length of zone
Zwi, LZwi. The direction is orthogonal break path. The
weak zone is always appear around the sink nodes (shown in Figure 7).
Measuring the quality of the barrier coverage
The fundamental problem for guaranteeing the coverage quality is measuring it with a effectively function. Once the coverage quality condition could be quantified, we
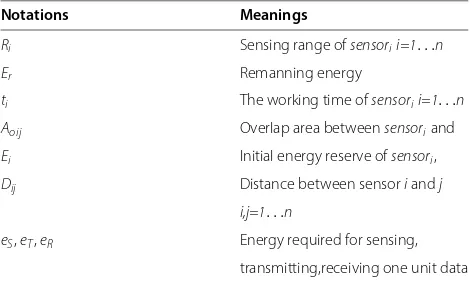
Table 1 Notations for some metrics of the energy efficient barrier coverage
Notations Meanings
Ri Sensing range ofsensorii=1. . .n
Er Remanning energy
ti The working time ofsensorii=1. . .n
Aoij Overlap area betweensensoriand
Ei Initial energy reserve ofsensori,
Dij Distance between sensoriandj
i,j=1. . .n
eS,eT,eR Energy required for sensing,
transmitting,receiving one unit data
then have the method to identify all weak zones which indicate the lower quality condition area in the belt region. Finally we propose a scheme to repair them.
This section proposes a metric for measuring the quality of k-barrier coverage, shows how to measure it using that metric, and identifies all weak zones, if any, that need to be repaired.
Definition 12.Quality of k-barrier coverage Qk: The coverage quality of a deployed belt region, denoted by Qk,
is related with the covered ratio, especially the covered ratio in horizontal direction. So Qk=1 which is equal to the
full coverage situation. Qk= -1 iff the belt region contains
an orthogonal break path that is not k-barrier covered. When Qk≥0, the deployment provides the k-barrier
cov-erage and the bigger value of Qk, the more redundancy
sensors are in the belt. When Qk≤0, the smaller value of
Qk, the more break paths are existing in the belt.
We classify three different levels of the coverage quality, Qk=-1, Qk=0 or Qk=1. When Qk=-1, it means that there
are orthogonal break paths in the belt region. When Qk=0,
it means that the deployed sensors could provide one bar-rier coverage in the belt region. When Qk=1, it means
that the belt region are whole covered, which denoted as full coverage in some literatures. We also define two sta-tus of the coverage quality. -1< Qk≤0 and 0< Qk ≤1.
When Qk is between the -1 and 0, we should do some
research on how to sliding the barriers to change the break paths in a rolling time to prevent the risk of an intruder following a fix one. When Qk is between the 0 and 1, a
good sleep-wake up scheme should be proposed to pro-long the lifetime of the whole network.We discuss these cases separately.
1) Qk=-1: In this situation, there are still many
Figure 6Belt-like region.Sometimes the belt-like region is not equal to the belt region.
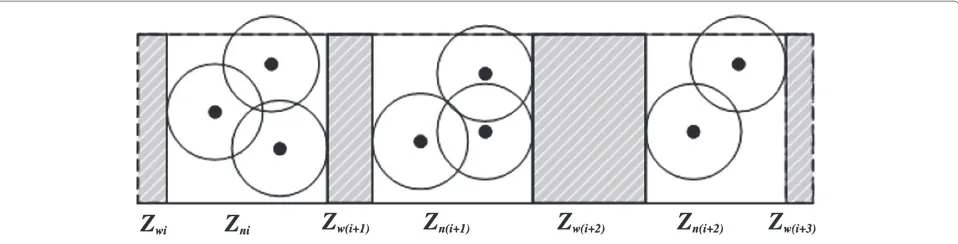
directly, then we use a new concept, overlap sensing boundary zone, in Figure 8, to solve the problem.
Definition 13. [Overlap Sensing Boundary Zone, Zni] Let B(li,li+1)be a pair of one single sensors’ left and right sensing orthogonal boundaries. Let (l0, l1, . . . , ln) be all the lines in B as ordered from left
to right. We define Zn(li,li+n+1)as a overlap sensing boundary zone (1≤i≤n).
Theorem 1.-1=Qkiff all overlap sensing boundary zones could not cover the whole horizontal direction in the belt region.
Proof. From the definition 13 we could know that a overlap sensing boundary zone could provide at least 1-covered. If an area in the belt region are not in the the overlap sensing boundary zone, then there are no sensors in this area, which means this area are 0-covered. In practical, if li is the right sensing boundaries of Zni, while ljis the left sensing
boundaries of Znj(i<j). If the location of Zniis to the
left of Znj, then the horizontal direction in the belt
region are not wholly covered by overlap sensing boundary zone (-1=Qk). Accordingly, if the location of Zniis to the right of Znj, then there are no
orthogonal break path in the belt region (-1<Qk).
2) -1<Qk≤0: All the orthogonal crossing line in the belt region are k-barrier covered, but there are still some curvilinear break paths in the belt region, for example in Figure 9. Overlap sensing boundary zones could cover the belt region in horizontal direction but there are still interstice among the sensors. We use the Edmond-Karp algorithm to calculate the flows in the graph G(N) from s to t. And then we number the sensors from left to right to construct barriers. If we turn on all the sensors in the belt region, then the deployment could means that -1= Qkand -1<Qk. Furthermore, We could turn off
some sensors to prolong the network lifetime and also satisfy the -1=Qkcondition. There are two
extreme cases in this deployed situation shown in Figure 10 and Figure 11. Obviously, the sensor selecting in Figure 11 is better than it in Figure 12. We denote them as line1 and line2. So the scheme should consider both the barrier construction and the work time of different line. In the Figure 10, the number of overlap sensor which is 9, is much more than it in the Figure 11. The work time of the barrier could be calculated according to the percentage of overlap sensors in the barrier. For example, the
Figure 8Qk= −1.In this situation, there are many area not not covered by sensors, So the Zniand Zwiare shown in the figure.
percentage of overlap sensors in Figure 10 is 9/17 and Figure 11 is 2/17. Furthermore, there are some sensors in a barrier that are not overlap with other ones, but they also cover some area to be a segment in the barrier. So the expression of a barrier work time is related with both the number of overlap sensors (PBi)
in a barrier and the coverage ratio (RBi) of a barrier.
work time of barrieri=PBi·RBi (1)
PBi=
the number of overlap sensorj
the total number in barrieri
(2)
RBi=
a certain barrier coverage acreage maximum coverage acreage (3)
We call the algorithm as SASCB which is short for Selecting and Activating Sensors to Construct a Barrier (shown as follows). It could reduce the risk that an intruder following a fixed crossing path to break the belt effectively.
3) Qk = 0: There are at least one barrier could cover the whole belt from left to right boundary. The SASCB algorithm is still suitable for this situation. Sensor selecting is the same as it when -1<Qk≤0, while the principle of activating scheme is to active the barrier which cover the whole belt region in horizontal direction as long as possible.
4) 0<Qk≤1: In this situation, the deployed sensors could construct several barriers and all of them could provide 1- covered. So guaranteeing the coverage quality is not the primary task here. It is important to design a wakeup/sleep scheme to prolong the lifetime of the network.
5) Qk=1: The belt region is all covered when Qk=1. This deployment could provide high coverage quality and track the intruders’ movement with strong robustness.
Barrier Constructing Algorithm (SASCB)
Require: Many Sensors are deployed in the belt region
Ensure: Different barriers in the belt region, barrieri;
The The work time of barrieri, ti.
1: Invoke the Edmond-Karp algorithm to find a maximum flow from s to t inG(N).
2: Deleting all value of vertices with 0 fromG(N). 3: Choosing sensors from far left in the deployed belt,
which means the chosen sensors are connecting with nodes.
4: Connecting the neighbor sensors one by one until the sensor is connecting with nodet. The neighbor sensors location must to the right of prior sensor.
5: Mark the barrier in the vertical direction, then different barriers are constructed.
6: Sort these barriers by descending order of coverage ratio. Then get the class sequence sq1u, sq2u· · · , sqiu
(1<i<the max number of barriers in the belt) 7: Base on this sort these barriers by descending order of
the number of overlap sensors. Then get the class sequence sq1v, sq2v. . ., sqiv. Then sort the barrier by
the order of the value of sqiusqiv
8: Calculating the value of sqiusqiv n
i−1sqiusqiv. If the work time of
the network is T, then the work time of barrieri
ti= nsqiusqiv i−1sqiusqiv ·T
Intrusion detection
Figure 9−1<Qk≤0.In this situation, there are no vertical directional break path. But there are still some break paths in the belt. So the
relationship between Euclidean distance of two sensors(D) and the sensing range(R) is the metric the measure the coverage quality.
Figure 10A typical deployment in a small region of the belt.In this deployment, a proper scheme to active the sensor could prolong the lifetime of the network.
Figure 11Case 1.Every sensor could get their exclusive serial number. This case the active sensor is No.1,2,4,6,7,8,10,11,12,13.
Figure 12−1<Qk≤0.This case the active sensor is No.1,2,3,5,7,9,10,11,12,13. So the No.3 could replace No.4, No.5 could replace No.6, No.8
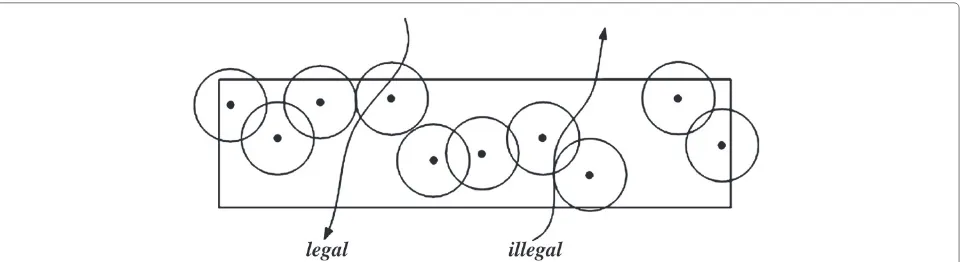
ones and detecting both legal and illegal intruders could cause the losses of energy (shown in Figure 13).
Based on these consideration, we propose a new cov-erage, called one-direction barrier covcov-erage, which has a great efficiency on directional detection. As shown in Figure 11, the deployed sensor network in this rectangu-lar belt can easily provide 1-barrier coverage. However, it cannot provide one-direction barrier coverage since the network cannot differentiate the illegal intruders from the legal ones. Therefore, the theory, protocols and algorithms that work with barrier coverage may not work with one-direction barrier coverage, and we have to study new measurement, design new protocols and algorithms for one-direction barrier coverage.
The key problem is how to let a sensor network know an intruder’s direction if this intruder is an illegal intruder and how to let the network NOT identify a legal intruder’s direction as an illegal intruder’s direction. This problem is nontrivial since normally a sensor (e.g., binary sen-sor) individually cannot know an intruder’s movement direction when this intruder is in its sensing region. So, it requires sensors coordinate together to solve this problem.
Before our work, Ma and Liu analyzed the probabil-ity of full area coverage in a directional sensor network where each sensor is fixed to one direction [32]. In [33], Ai and Abouzeid proposed centralized and distributed algo-rithms to find a minimal set of sensors that can cover the maximal number of targets in a sensor network, where a sensor is allowed to work in several directions. In [34], Cai et al. addressed to find a group of non-disjoint cover sets in each of which the sensors cover all the targets so as to maximize the network lifetime. These papers are not very related to our topics. Plarre and Kumar studied the prob-lem of how to track objects using scattering directional sensors in a sensor network [35].
Target tracking has long been an active topic in sensor network research. Some researchers (e.g.,[36,37]) focus on single-target tracking while others (e.g., [38,39]) are
interested in multiple-target tracking. Many researchers believe that simple sensor models, such as the binary sen-sor model, are more realistic in sensen-sor networks. Kalman filtering is often used for the classical tracking with Gaussian models for sensor readings. Recently, the use of Particle filters has become popular to handle more general observation models (e.g. [40,41]). Target tracking research addresses on how to track the whole trajectories of targets. Therefore, full coverage is normally necessary for target tracking. However, we are interested in the problem of how to identify the directions of targets by using much less sensors. This paper is the first research on measuring the coverage quality and the efficiency of one-direction barrier coverage.
One intruder
As mentioned before, one barrier could not tell the direc-tion of an intruder. But if there are two barriers in the belt region, then the network could provide one-direction bar-rier coverage under some assumptions. The assumptions are as follows: (1)There is no hole between two barriers. (2)Two barriers has a overlap region which is continuous. (3)There is no intersection between their boundaries. So such two barriers region is shown as Figure 14.
Let the two neighboring barriers be b1and b2, with b1 on the top. Use b1’s top boundary l1t as the alarm line. The
network has two states: “Intruder In” and “Intruder Out”. The network is in the Intruder In state if at least one sen-sor is sensing the intruder; otherwise, it is in the Intruder Out state. When the network changes its state from Intruder Out to Intruder In, the network checks which barrier the intruder is entering. Note that the intruder cannot enter the two barriers simultaneously since there is no intersection between b1’s and b2’s boundaries. If the sensors that sense the intruder are in b1, then the intruder is crossing the alarm line from top to bottom and we let the network report an alarm. Otherwise, the network does not report any alarm. So, the network can provide one-way barrier coverage.
two barrier could provide one direction coverage under some assumption.
Multiple intruders
Suppose there is more than one intruder. Binary sensors can provide one-way barrier coverage if the intruders’ movements satisfy some constraints. Assume that two neighboring barriers are deployed and the top bound-ary l1t of the top barrier b1 is selected as the alarm line. When an intruder enters the sensing region of a sen-sor u in b1, this intruder is either from the outside of the two barriers or from u’s neighboring sensor’s sensing region. If it is from the outside of the two barriers, it must cross l1t to enter the sensing region of u, which means it is illegal. Therefore, the network can judge whether this intruder is legal or not by checking whether this intruder is from u’s neighboring sensor’s sensing region or not. So, if other intruders are not too close to the illegal intruder such that there are no intruders in the sensing regions of u’s neighboring sensors, u can correctly judge the illegal intruder.
In Figure 15, the path A, happens in T1 while leaves in T2, and path B, happens in T3while leaves in T4, are both the legal path. That is to say, the sensor network will not report any alarm from T1to T4. (T1, T2, T3, T4 are the triggering times by sensors’boundary. T1 < T2 < T3 < T4). But there is another possibility during T1 to T4, the path B’ is an illegal path which is hidden by the cover of legal one (Path A’). So in this condition, the
ordinary barrier coverage may not detect an intruder who is crossing the belt in the illegal way.
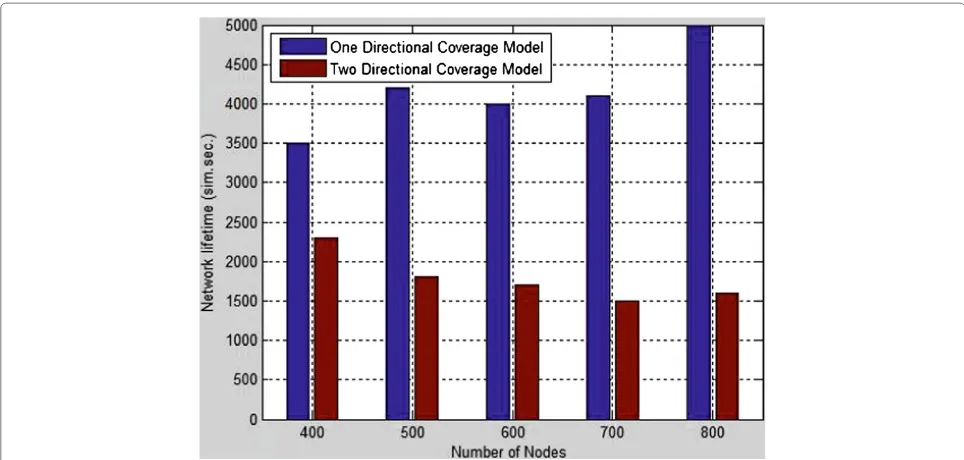
We also simulate the new model in Matlab. Varying number of nodes are deployed to an area of 300 m*250 m belt region. When there are fifteen intruders across the belt region during the network lifetime, the new model could extend the lifetime. The result is shown in Figure 16. The temporal series is very interesting and important in one direction barrier coverage. We can say that if an illegal intruder could enter the belt after a legal one and leave before a legal one, then he will not reveal his track. This is a very interesting event, cause the relationship of legal and illegal triggering series is a subtle issue.
Cooperative intrusion detection
If the sensors are deployed according to the strategies described before. The detection rate of intrusion can be controlled at a high level. However, it is difficult to distin-guish between intrusions and nuisance warnings caused by environment elements. In conventional wireless sen-sor networks, the false alarm rate can be lowered by the joint-detection of multiple adjacent sensors. Specifically, since the belt region in front of the border is k-barrier cov-ered by the sensors according to the deployment strategy, an intruder may be detected by multiple sensors as the intruder passes through the belt region.
Figure 16Network Lifetime Performance.The new model could extend the lifetime from the network lifetime from 52.1%–212.5% than two directional coverage model.
Meanwhile, not only the binary sensors but also cam-era sensors and mobile sensors are needed for intrusion detection.To minimize the uncovered time, a joint analy-sis of the coordination between adjacent camera sensors are required to determine the initial phase of the camera directions and camera rotating velocity.
Therefore, the camera sensor and mobile sensor could be activated by binary sensor which are deployed in the belt region. The coordination among them should also be analyzed.
Conclusion
In this paper, we introduce the border intrusion detec-tion. An energy efficient manner for border patrol to reduce the intensive human involvement and to improve the detection accuracy. In order to guarantee the detec-tion accuracy, we mainly discuss the coverage quality and the method to enhance the quality of the detection. We proposed a method to identify all weak zones that need to be repaired. Once these zones are repaired, the network’s quality of barrier coverage will be restored to the desired level.
Target tracking is another important property of bor-der intrusion detection. It is still a problem to illustrate which kind of coverage model is the most efficient one. We presented an one-directional coverage model for border intrusion detection. Specifically, we discussed both one intruder scene and multiple intruder scene. Furthermore we also proposed the possibility of heterogeneous sensors cooperative for intrusion detection. Energy efficiency is not only reflected in the barrier construction algorithm,
but also the network coverage model. The experimental results shows that the proposed algorithm could be extend the lifetime of the wireless sensor network.
The one future research direction is to add some mobile sensors and consider their integrated movement strat-egy. Another future research direction is to realize the detection in reality, which will consider the network per-formance in 3D environment. The objective is not only to guarantee coverage quality but also to improve network lifetime, data report timeliness and reliability at the same time.
Competing interests
The authors declare that they have no competing interests.
Acknowledgements
This work is supported by the Aeronautical Science Foundation of China (2011ZD53046), (2013ZC53034) and the Aerospace. Support Fund of China (2012-HT-XGD).
Received: 13 October 2013 Accepted: 12 March 2014 Published: 25 March 2014
References
1. A Saipulla, C Westphal, B Liu, J Wang, Barrier coverage of line-based deployed wireless sensor networks. INFOCOM IEEE, 127–135 (2009) 2. Y Wang, G Cao, Barrier coverage in camera sensor networks, in
Proceedings of the Twelfth ACM International Symposium on Mobile Ad Hoc Networking and Computing(ACM, 2011), p. 12
3. T Yang, PG Fan, DJ Mu, Maximizing the lifetime of sliding wireless sensors in barrier coverage. Appl. Mech. Mater.157, 503–506 (2012)
4. AR Girard, AS Howell, JK Hedrick, Border patrol and surveillance missions using multiple unmanned air vehicles, inProc. IEEE CDC’04(Atlantis, Paradise Island, Bahamas, December 2004)
surveillance system via a wireless sensor network, inGrid and Pervasive Computing(Springer Berlin Heidelberg, 2013), pp. 707–714
10. S Megerian, F Koushanfar, M Potkonjak, M Srivastava, Worst and best-case coverage in sensor networks. IEEE Trans. Mobile Comput.4(1) (2005) 11. X Bai, D Xuan, Z Yun, TH Lai, W Jia,Complete Optimal Deployment Patterns
for Full-Coverage and K-Connectivity (k6) Wireless Sensor Networks (ACM MobiHoc, 2008)
12. X Bai, Ch Zhang, D Xuan, W Jia, Full-Coverage and k-Connectivity (k=14, 6) Three dimensional networks, inProc. of INFOCOM’09(IEEE, 2009) 13. DW Gage, Command control for many-robot systems, inProceedings of
the 19th Annual AUVS’92 Technical Symposium, (1992)
14. S Kumar, TH Lai, A Arora, Barrier coverage with wireless sensors, in Proceedings of the Annual ACM International Conference on Mobile Computing and Networking (Mobi- Com’05)(2005)
15. S Kumar, TH Lai, ME Posner, P Sinha, Optimal sleep wakeup algorithms for barriers of wireless sensors, inProceedings of the IEEE BROADNETS’07 Conference(2007)
16. A Chen, S Kumar, TH Lai Designing localized algorithms for barrier coverage, inProc. of ACM Mobicom’07(2007)
17. N Atay, B Bayazit, Mobile wireless sensor network connectivity repair with K-redundancy. Technical report, Washington University in St. Louis 18. Ai Chen, TH Lai, D Xuan, Measuring and guaranteeing quality of
barrier-coverage in wireless sensor networks, inProc. of MobiHoc’08(2008) 19. S Meguerdichian, F Koushanfar, M Potkonjak, MB Srivastava, Coverage
problems in wireless ad-hoc sensor networks, inProceedings of the Annual Joint Conference of the IEEE Computer and Communications Societies (InfoCom’01)(2001)
20. S Megerian, F Koushanfar, G Qu, M Potkonjak, Exposure in wireless sensor networks, inProceedings of the Annual ACM International Conference on Mobile Computing and Networking (MobiCom’01)(2001)
21. G Veltri, Q Huang, G Qu, M Potkonjak, Minimal and maximal exposure path algorithms for wireless embedded sensor networks, inProceedings of the ACMSIGOPS International Conference on Embedded Networked Sensor Systems (SenSys’03)(2003)
22. C Gui, P Mohapatra, Power conservation and quality of surveillance in target tracking sensor networks, inProceedings of the ACM Annual International Symposium on Mobile Computing and Networking (MobiCom’04), (2004), pp. 129–143
23. J Jeong, S Sharafkandi, DH Du, Energy-aware scheduling with quality of surveillance guarantee in wireless sensor networks, inProceedings of the ACM Workshop on Dependability Issues in Wireless Ad Hoc Networks and Sensor Networks (DIWANS’06), (2006)
24. C Taylor, A Rahimi, J Bachrach, H Shrobe, A Grue, Simultaneous localization, calibration, and tracking in an ad hoc sensor network, inProc. of IPSN’06, (2006)
25. N Shrivastava, R Mudumbai, U Madhow, S Suri, Target tracking with binary proximity sensors: fundamental limits, minimal descriptions, and algorithms, inProc. of SenSys’06(2006)
26. PV Pahalawatta, D Depalov, TN Pappas, AK Katsaggelos, Detection, classification, and collaborative tracking of multiple targets using video sensors, inProc. of IPSN’03(2003)
27. AO Ercan, AE Gamal, LJ Guibas, Object tracking in the presence of occlusions via a camera network, inProc. of IPSN’07(2007)
28. J Singh, U Madhow, R Kumar, S Suri, R Cagley, Tracking multipletargets using binary proximity sensors, inProc. of IEEE IPSN’07(2007) 29. J Aslam, Z Butler, F Constantin, V Crespi, G Cybenko, D Rus, Tracking a
moving object with a binary sensor network, inProc. of SenSys(2003) 30. W Kim, K Mechitov, J-Y Choi, S Ham, On target tracking with binary
proximity sensors, inProc. of IPSN’05(2005)
binary-detection sensor networks. Tech. Rep. UIUCDCSR- 2003–2379, University of Illinois at Urbana-Champaign, Sept. 2003
37. N Shrivastava, R Mudumbai, U Madhow, S Suri, Target tracking with binary proximity sensors: fundamental limits, minimal descriptions, and algorithms, inProc. ACM SenSys(2006)
38. T Jing, S Hichem, R Cedric, Binary variational filtering for target tracking in sensor networks, inProc. 14th IEEE/SP Workshop on Statistical Signal Processing, (2007), pp. 685–689
39. W Kim, K Mechitov, J-Y Choi, S Ham, On target tracking with binary proximity sensors. Proc. IPSN (2005)
40. AO Ercan, AE Gamal, LJ Guibas, Object tracking in the presence of occlusions via a camera network, inProc. of IPSN’07(2007)
41. J Singh, U Madhow, R Kumar, S Suri, R Cagley, Tracking multiple targets using binary proximity sensors, inProc. of IEEE IPSN’07(2007)
doi:10.1186/1687-1499-2014-46
Cite this article as:Yanget al.:Energy-efficient border intrusion detection
using wireless sensors network.EURASIP Journal on Wireless Communications
and Networking20142014:46.
Submit your manuscript to a
journal and benefi t from:
7Convenient online submission 7Rigorous peer review
7Immediate publication on acceptance 7Open access: articles freely available online 7High visibility within the fi eld
7Retaining the copyright to your article