INTERNET OF THINGS BASED SMART AGRICULTURE SYSTEM USING PREDICTIVE ANALYTICS
SUHAS M PATIL*, SAKKARAVARTHI R*
ABSTRACT
Due to the use of internet of things (IoT) devices, communication between different things is effective. The application of IoT in agriculture industry plays a key role to make functionalities easy. Using the concept of IoT and wireless sensor network (WSN), smart farming system has been developed in many areas of the world. Precision farming is one of the branches comes forward in this aspect. Many researchers have developed monitoring and automation system for different functionalities of farming. Using WSN, data acquisition and transmission between IoT devices deployed in farms will be easy. In proposed technique, Kalman filter (KF) is used with prediction analysis to acquire quality data without any noise and to transmit this data for cluster-based WSNs. Due to the use of this approach, the quality of data used for analysis is improved as well as data transfer overhead is minimized in WSN application. Decision tree is used for decision making using prediction analytics for crop yield prediction, crop classification, soil classification, weather prediction, and crop disease prediction. IoT components, such as and cube (IOT Gateway) and Mobius (IOT Service platform), are integrated in proposed system to provide smart solution for crop growth monitoring to users.
Keywords: Wireless sensor networks, Internet of things, Data compression, Kalman filter, Prediction analytics.
INTRODUCTION
In the farming, field crop needs management of pesticides, fertilizers, and irrigation for better growth, precision agriculture (PA) is the concept used for the same purpose. The information such as temperature, humidity, fertilizer, and soil moisture can be provided as input by PA to decision support system for maximizing the crop growth with the optimized use of available resources and without affecting an environment. The sensor nodes placed in the farm for information gathering should always consider energy consumption to perform this task. Crops can be varied with respect to time and space, so PA requires observations in spatial and temporal domains. Data sensed by sensors is send to centralized entity for analysis and enhancement. Results of the analysis are communicated back to farm personnel. In any wireless sensor network (WSNs), application energy is the major performance factor. As per the previous literature, most of the resources of sensor nodes are utilize for communication process.
The connected farm is a new type of automated farming system developed using internet of things (IoT) infrastructure. The connected farm system has three main components, i.e., connected IoT devices including monitoring sensors and controllers, IoT gateway (called and cube), and IoT service platform (called Mobius) [12]. In connected farms, there are physical sensors (e.g., temperature, humidity, CO2, and illumination) and controllers (e.g., sprinkler, LED lights, air conditioner, and heater) for monitoring and controlling the environmental conditions of the farm. All the sensors and controllers are connected with the IoT gateways in turn connected with the IoT service platform. End users (i.e., farmers) can interact with the connected farm for monitoring its environmental conditions or triggering some farming utilities.
Prediction combined with Kalman filter (PKF) is a cost effective method for communication in WSNs. To reduce the computation overhead, PKF use pair of KF based predicator instead of pair of KF’s required for execution in sensor nodes in Distributed KF [1]. In many works, small packet size is used for transmission to achieve better compression but in PKF packet send per second is minimum which can reduce amount of energy required for each transaction. Instead of using models based
on time for predication KF based technique uses complete model for predication where some states are unknown which gives more accurate predication analysis. Due to the reduction in the rate of transmission reconstruction quality of data is decreased. To achieve better quality, PKF removes noise from sensed data acquired by leaf node and make the reconstructed signal to more accurate as compare to rough observations.
LITERATURE SURVEY
For crop yield predication on agriculture predicting agriculture plays a key role. It can the farmer to decide future plan regarding the production of the crop, its storage, marketing techniques and risk management [2]. To estimate production strategies for particular type of crop in advance to methods are used. First is statistics method such as autoregressive integrate moving average (ARIMA) and Holt-Winter [2], and second is machine learning method such as Support vector machine and artificial neural network. Two data sets are used to test these methods using support vector machine and ARIMA model. First, data set is Thailand’s Pacific white shrimp export data and second is Thailand’s produced chicken data [2]. As per the observations mentioned in this paper, it can be said that support vector is more accurate than ARIMA. Furthermore, machine learning methods are easy to implement and faster as compared to statics methods.
Agriculture in an India is dependent on summer rainfall weather. The effect of rainfall in summer on production of agriculture crops is discussed in [3]. In this paper, the past crops data are analyzed to examine crop-climate relationship. From the results mentioned in this paper, it can stated that three factors can directly make the effect on growth of agriculture products in India such as monsoon rainfall, temperature of pacific and Indian oceans, and pressure of sea level. Furthermore, the results prove production rate and amount of monsoon rainfall all over India is constant, excluding some cases.
One of the machine learning approaches use to accommodate idea of PA is an UChooBoost [4]. Nowaday, it is required to manipulate a large amount of digital information collected by sensors deployed in farm. This information is used for knowledge mining by supervised learning algorithm called as UChooBoost [4]. UChoo classifier is used as base © 2017 The Authors. Published by Innovare Academic Sciences Pvt Ltd. This is an open access article under the CC BY license (http://creativecommons. org/licenses/by/4. 0/) DOI: http://dx.doi.org/10.22159/ajpcr.2017.v10s1.19601
School of Computing Science & Engineering, VIT, Chennai, Tamil Nadu, India. Email: [email protected]/[email protected]
Received: 23 January 2017, Revised and Accepted: 03 March 2017
classifier in bootstrap ensemble. To evaluate good performance in PA votes are assigned with specific weights and highest weighted votes are combined to check the performance [4]. The extended data set is used to check the results of UChooBoost and it shows better results for agriculture data while used in the experiment. The UChooBoost can be applied for an extended data expression and used to test results for different assumptions which can help to improve algorithm performance.
To select the crop and to predict production rate of the crop artificial neural network use information collected by sensors from the farm. This information includes parameters such as soil, temperature, pressure, rainfall, and humidity. The effect of these parameters on crop growth is discussed, and results are evaluated in paper [5]. It is observed that the atmospheric parameter, soil type, and soil composition can impact on production rate of crop. The technique discussed in this paper also predicts suitable crop production rate in advance. Artificial neural network is used as effective tool for modeling and prediction of crop production rate and improves the accuracy of crop prediction.
For predicting production of rice crop, an intelligent tool is developed with the help of machine learning approach. This tool is used in classification and clustering [6]. Rice plantation data are classified using Support vector machine learning technique. Kernel-based clustering algorithm is used for finding cluster in climate data. To manipulate complex, high dimensional and non-linearly separable data Kernel-based methods are applicable. The impacts of various influencing parameters on the rice yield are evaluated using correlation analysis and using regression analysis prediction about crop yield rate is done. Support vector machine is used for noisy data. Due to all these features technique from this paper used as an intelligent system for predicting rice yield.
Most of the crop production prediction techniques use machine learning approaches. Many of the researchers have been proposed intelligent techniques for crop yield prediction, and tested for the most accurate results. These results cannot help decision-making system to predict more accurate guesses as they have tested for less number of crop data.
The technique discussed in Gonzalez-Sanchez et al.’s study [7] tested against more number of crops data. From this analysis, various learning techniques are evaluated for accuracy using data set and also some learning methods are developed for prediction of crop growth in the paper [7].
A plant nutrient management system is developed to correlate needed nutrient of the plant with avail fertility of soil [8]. In back-propagation neural network (BPN) supervised machine learning technique, effect of soil properties such as organic matter, micro-nutrient on growth of crops is discussed [1]. The whole process is split into three steps such as soil sampling, training BPN, and weight pupation of hidden layer of neuron [8]. BPN technique performs better than multivariate regression technique.
The diseases of rice crop are classified using knowledge of symptoms using C4.5 decision tree algorithm [9]. The experiment is done over Indian rice disease. Decision tree, C4.5, automatically acquire knowledge from empirical data of Indian rice disease. The decision tree formed using C4.5 algorithm, can effectively be used to predict crop growth more accurately and also successfully test data set [1].
Machine learning is prominent technology in knowledge mining. Due to the use of machine learning technique application pattern recognition in this field is simplified and accuracy of the result is improved. C4.5 decision tree learning algorithm is used in [11] to develop classifier extraction tool to categorize disease of rice crop in Egypt and surrounding area. Also till date, many tools are developed for prediction of crop growth or production rate in agriculture field. The advantage of C4.5 is accountable. C4.5 is used to create complete tree with better predictive power. Crop method used in it enables to maintain continuity of tree and increase the quality of prediction analysis.
PROPOSED TECHNIQUE
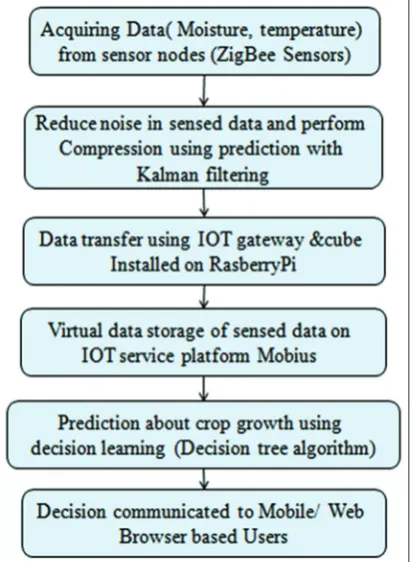
The proposed research work focuses on the use of effective IOT devices and efficient algorithms for refinement of sensed data and decision learning for prediction. In system design, we have included flow of communication between different system components and input and output for different modules present in system. The system architecture is shown in Fig. 2. Main components of system are
• IOT devices
• Data refinement algorithm
• Machine learning algorithm for prediction.
IoT devices
The performance of devices used in smart farming system in literature is enhanced by using IoT systems. New types of IoT devices are integrated in farms effectively which add extensions to functionalities of farming. Also due to the use of IoT devices horizontal smart farm platforms are deployed which enable all farms to be connected and share knowledge regarding farming from experienced users. The smart farm, embedded with IoT systems, can support a wide range of devices from diverse agricultural device manufacturers [12].
In addition, connected farms could provide more intelligent agricultural services based on shared expert knowledge. Using this knowledge people having less experience in farming can choose crop for good profit. Due to the deployment of connected farms, it can be easy to detect disease on crop or virus spread over farm using prediction technique and farmer can separate such farm from others.
server, called Mobius. The role of Mobius is to not only monitor different parameters on farm but also communicate with gateway present at farm. It will communicate with expert farming knowledge system and control actuators to make the farm suitable to grow crops.
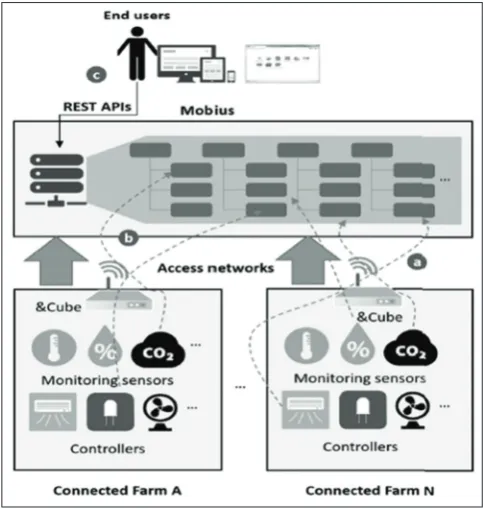
As shown in Fig. 3, smart farm prototype which will be used in our system will have three components as connected IoT devices including monitoring sensors and controllers, IoT gateway (called and cube), and IoT service platform (called Mobius) [12]. Physical sensors (e.g., temperature, humidity, CO2, and illumination) and controllers (e.g., sprinkler, LED lights, air conditioner, and heater) are used for monitoring and controlling the environmental conditions of the farm. All the sensors and controllers are connected with the IoT gateways in turn connected with the IoT service platform. End users (i.e., farmers) can interact with the connected farm for monitoring its environmental conditions or triggering some farming utilities.
The overall data acquisition process is as follows. First, each device (i.e., sensors and controllers) deployed in the farm has to be registered into the Mobius using and cube. Once registered Mobius will create virtual representation of every device according to the resource type. Sensors for monitoring the farm send collected environmental data from monitored areas to the and cube, and then the and cube transmits the data to the Mobius, as shown in Fig 3. Finally, end users can monitor and control their connected farm using IoT applications on their smartphones or tablets by accessing virtual representation of the devices resided in the Mobius [12].
Here, it should be noted that all interfaces provided by the Mobius are representational state transfer (REST) application programming interfaces (API) [12]. That is, the interfaces between the Mobius and cubes could be standardized and thus easily extended by integrating with other IoT gateways installed with the and cube, regardless of the type of devices connected into the gateways and access networks. As a conclusion, our proposed design for farms enables seamless deployment of IoT devices into connected farms but also encourages third-party developers to develop their innovative.
a. Mobius
The Mobius is an open IoT service platform which works as per rules of one machine-to-machine (M2M) standards, which supports to create virtual representations of physical IoT devices. The one M2M initiative is an international partnership project established in 2012 and its goal is to make M2M standard and IoT service layer
constraints accepted everywhere and access independent M2M/IoT services [14]. The Mobius is designed to comply with the one M2M
specifications and supports common M2M/IoT service functions,
including device registration, data repository and management,
subscription and notification, and security [12]. Thus, the Mobius
can support virtual representations of the data collected from physical devices installed into the farms. The Mobius provides REST APIs to access data resources resided in the Mobius, and control IoT devices.
b. And cube
The and cube is a device software platform which can be installed into IoT gateways. As in the Mobius, the and cube is also designed to comply with the one M2M standards [12], and thus Fig. 2: System architecture
Fig. 3: Design of connected farms based on internet of things (IoT) systems, (a) register devices as virtual representations in the Mobius, (b) transmit data collected from the registered devices via and cubes, (c) monitor and control the connected farm through representational state transfer application programming
send the collected data from physical devices to the Mobius via standardized REST APIs. The and cube has been implemented as a Java program so that it could be easily ported on any type of embedded machines installed with the Java virtual machine. In addition, the and cube supports various protocol bindings including HTTP, MQTT, and CoAP. For our connected farm, we have installed the and cube in a Raspberry-Pi, which is a single-board Linux installed computer [12].
Prediction combined with KF
For prediction using KF, sensor nodes have to form set of clusters. The cluster head will receive data about different parameters of the environment from leaf node who is responsible to collect and transmit it to head.
In PKF, it is assumed that cluster head can predict current data sent by leaf node with acceptable error using data received by leaf node previously. The PKF conceal conversation between a leaf node and its cluster head with respect to time [15].
Many times data collected by leaf node is affected by noise, so it is required to remove noise from this data. To remove the noise from the sensed data every leaf node use KF filter and produce best results.
To reduce energy consumption required for communication, cluster head derives Kalman optimal values for leaf node using simple predicator PKF.The leaf node executes predicator at regular time interval by following observation captured by cluster head and compares those values with its optimal value to guarantee accurate predication analysis. If the prediction error is greater than a given threshold, the current minimal value is passing to the cluster head. The pair of predicators with optimal value is used by PKF. Note that, this predictor is equivalent to a k-step ahead Kalman predictor.
The block diagram of PKF is shown in Fig. 4. Accordingly, Algorithms 1 and 2 depict the process of PKF performed by the leaf node and the cluster head, respectively. Note that, Algorithm 2 is executed by the cluster head for each leaf node.
Decision tree algorithm
An instance space is recursively partitioned using classifier known as decision tree. The decision tree is directed tree rooted tree in which there is one main root node which has no incoming edges. All other nodes have exactly one incoming edge. To build the decision tree, a discrete function with the input of an attribute value is used where instance space is divided into two or more sub-spaces by the internal node [17].
Decision tree [18,19] is a widely used model for both regression [20] and classification [19]. A typical decision tree algorithm is described in Algorithm 3. Nodes are added in the tree using the recursive call in the algorithm until this satisfies termination condition. For this purpose, two functions are used in algorithms: Find the best split returns the best split point {attribute, threshold} of a node, and split splits the training data according to the best split point. The details of find best split are given in Algorithms 4 [16]: First histograms of the attributes are constructed (for simplicity convert numerical values of continuous attributes to finite bins) by examining all training data on the current node; then, all split points are transferred from left to right, and left sum and right sum are used to acquire sum of left and right parts of the split point, respectively [16]. When selecting the best split point, an informativeness measure is adopted. The widely used informative measures are information gain and variance gain for classification and regression, respectively.
Algorithm 3 - Bulid tree
• Step 1: Give input as set of nodes and data set
• Step 2: If node reaches to stopping criteria of data set then node is
added
• Step 3: Else return best split point
• Step 4: Split training data set as per the best split point found in
step 3
• Step 5: Add left child • Step 6: Add right child.
Algorithm 4 - Find best split
• Step 1: Give training data set as input • Step 2: Construct the histogram of attributes • Step 3: Traverse all split points
• Step 4: Find best split
• Step 5: Construct the histogram for left sum and right sum of the
split point
• Step 6: For all split points in histogram calculate lest sum and right
sum
• Step 7: Calculate split gain for left sum and right sum
• Step 8: Select best split point using split gain calculated in step 7.
CONCLUSION
The proposed research work provides I-T based smart agriculture solution using data compression and filtering techniques as well as decision learning algorithms. Due to the use of IoT devices, the system will provide automated solution for data acquisition from sensors deployed in farm. Data compression and filtering will give accuracy and provide low-cost communication. At the last, decision learning algorithm unable system to provide farmer status of their farm to take decision about crop monitoring for irrigation, fertilizer and pesticide levels, possible future diseases.
Using mathematical analysis efficiency of PKF for energy consumption and quality of data reconstruction is examined. It is helpful to understand the underlying process of prediction based compression schemes. To provide internet connectivity for the sensors and controllers of the connected farm, we will deploy the and cube, a standardized (i.e., complying with one M2M specifications) device software platform for IoT devices. Furthermore, we will use the Mobius, an IoT service platform (also one M2M-compliant) that provides REST APIs with which the data collected from sensors (e.g., CO2 sensor) can be retrieved but also the control commands can be sent to controllers (e.g., air conditioner). The survey of different machine learning algorithms will support to choose best possible solution for decision making using prediction of crop growth.
ACKNOWLEDGMENT
We are thankful to all staff members and students of School of Computing Science and Engineering, VIT, Chennai for their support during the preparation of this paper.
1. Kumar R, Singh MP, Kumar P, Singh JP. Crop Selection Method to Maximize Crop Yield Rate using Machine Learning Technique, 2015 International Conference on Smart Technologies and Management for Computing, Communication, Controls, Energy and Materials, Chennai, Tamil Nadu, India. 6-8 May 2015. p. 138-45.
2. Sujjaviriyasup T, Pitiruek K. Agricultural product fore-casting using
machine learning approach. Int J Math Anal 2013;7(38):1869-75. 3. Kumar KK, Kumar KR, Ashrit RG, Deshpande NR, Hansen JW.
Climate impacts on Indian agriculture. Int J Climatol 2004;24:1375-93. 4. Kolesnikova A, Song CH, Lee WD. Applying UChooBoost algorithm
in precision agriculture. ACM International Conference on Advances in Computing, Communication and Control, Mumbai, India, January; 2009.
5. Dahikar SS, Rode SV. Agricultural crop yield prediction using artificial neural network approach. Int J Innov Res Electr Electron Instrum Control Eng 2014;2(1):683-6.
6. Sap MN, Awan AM. Development of an intelligent prediction tool for rice yield based on machine learning techniques. Jurnal Teknologi Maklumat 2006;18(2):73-93.
7. Gonzalez-Sanchez A, Frausto-Solis J, Ojeda-Bustamante W. Predictive ability of machine learning methods for massive crop yield prediction. Span J Agric Res 2014;12(2):313-28.
8. Ghosh S, Koley S. Machine learning for soil fertility and plant nutrient management using back propagation neural networks. Int J Recent Innov Trends Comput Commun 2014;2(2):292-7.
9. Nithya A, Sundaram V. Classification rules for Indian rice diseases. Int J Comput Sci 2011;8(1):444-8.
10. Revathi P, Revathi R, Hemalatha M. Comparative study of knowledge in crop diseases using machine learning techniques. Int J Comput Sci Inf Technol (IJCSIT) 2011;2(5):2180-2.
11. El-Telbany M, Warda M, El-Borahy M. Mining the classification rules for egyptian rice diseases. Int Arab J Inf Technol 2006;3(4):303-7. 12. Ryu M, Yun J, Miao T, Ahn IY, Choi SC, Kim J. Design and
Implementation of a Connected Farm for Smart Farming System; 2015. 13. Ryu M, Kim J, Yun J. Integrated semantics service platform for
the internet of things: A case study of a smart office. Sensors 2015;15(1):2137-60.
14. Swetina J, Lu G, Jacobs P, Ennesser F, Song J. Toward a standardized common M2M service layer platform: Introduction to oneM2M. IEEE Wirel Commun 2014;21(3):20-6.
15. Huang Y, Yu W, Osewold C, Garcia-Ortiz A. Analysis of PKF: A communication cost reduction scheme for wireless sensor networks. IEEE Trans Wirel Commun 2016;15(2):843-56.
16. Meng Q, Ke G, Wang T, Chen W, Ye Q, Ma ZM, et al. A Communication-Efficient Parallel Algorithm for Decision Tree. 30th Conference on
Neural Information Processing Systems (NIPS), Barcelona, Spain; 2016.
17. Rokach L, Maimon O. Decision trees. Data Mining and Knowledge Discovery Handbook. Ch. 9. New York, Dordrecht, Heidelberg, London: Springer; p. 165-92.
18. Quinlan JR. Induction of decision trees. In: Machine Learning. Vol. 1. Berlin: Springer; 1986. p. 81-106.
19. Safavian SR, Landgrebe D. A survey of decision tree classifier methodology. IEEE Trans Syst Man Cybern 1991;21(3):660-74. 20. Breiman L, Friedman J, Stone CJ, Olshen RA. Classification and
Regression Trees. Boca Raton, Florida: CRC Press; 1984.
![Fig. 4: The block diagram of prediction Kalman filter [15]](https://thumb-us.123doks.com/thumbv2/123dok_us/996361.1123216/4.595.116.483.72.174/fig-block-diagram-prediction-kalman-filter.webp)
