SIMULTANEOUS ESTIMATION AND METHOD DEVELOPMENT FOR L-CARNITINE AND
METFORMIN IN HUMAN PLASMA USING LIQUID CHROMATOGRAPHY MASS SPECTROMETER
JAMES D TERISH BINO
1*, KANNAPPAN
2, SASI JITH
3, SURESH KUMAR
31Department of Pharmacy, Annamalai University, Chidambaram, Tamil Nadu, India. 2Department of Pharmacy, Faculty of Pharmacy,
Annamalai University, Chidambaram, Tamil Nadu, India. 3Sequent Research Limited, Mangalore, Karnataka, India.
Email: [email protected]
Received: 11 November 2014, Revised and Accepted: 22 November 2014
ABSTRACT
Objectives: The objective was to develop a robust simultaneous method for quantifying L-Carnitine and metformin using liquid chromatography mass spectrometer (LCMSMS).
Methods: LCMSMS method was developed considering its selectivity, sensitivity, and accuracy. Blank correction method was followed as L-Carnitine is found endogenously. Range was selected based on the Normal value for L-Carnitine and maximum concentration for metformin.
Results: Rugged simultaneous method using ultra flow LC mass spectrometer for the estimation of L-Carnitine and metformin, in human plasma with low limit of quantification and upper limit of quantification of 2.289 µg/mL and 33.675 µg/mL for L-Carnitine, 43.483 ng/ml and 639.450 ng/ml for metformin, respectively, was developed which can be used for therapeutic drug monitoring and as a prognostic tool for Type 2 diabetes mellitus (T2DM). Extraction was optimized using Protein precipitation (PP) in which sample clean-up was simple, and recovery was consistent. Linearity was checked and found to be within acceptance criteria with 1/×2 as the weighing factor. As L-Carnitine is present endogenously blank correction was
carried by injecting blank six times and calculated for normalization. As the extraction is by simple PP internal standard was not used, and method is meeting the criteria for validation using LCMSMS.
Conclusion: Hence, considering L-Carnitine as the biomarker for T2DM and metformin as the drug for treatment, a simultaneous method was developed which can be validated as per regulatory requirements and can be verified for the applicability of the method as a therapeutic drug monitoring and prognostic tool.
Keywords: L-Carnitine, Metformin, Type 2 diabetes, Liquid chromatography mass spectrometer.
INTRODUCTION
Type 2 diabetes mellitus (T2DM) is caused mainly due to metabolism problem and inadequate utilization of insulin. T2DM diagnosis is carried by A1c, i.e., glycated hemoglobin test, random blood sugar test, Fasting blood sugar test and oral glucose tolerance test. These tests vary based on the age, weight, hereditary, etc. For example, A1c test varies based on the age, hemoglobin variant, pregnancy, and makes the test inaccurate. Furthermore, all these tests can only diagnosis T2DM but cannot be used simultaneously for fixing the dose or as a prognostic tool as these requires more specific, accurate, and less false positive results. For example, when using metformin, the dose is fixed based on the body weight and age. Therapeutic drug monitoring (TDM) will be more useful and accurate if a simultaneous method which can specifically indicate the level of T2DM and the drug used for treatment is available.
L-Carnitine, (3R)-3-Hydroxy-4-(trimethylammonio) butanoate is a quaternary ammonium compound present endogenously in humans. This is synthesized in liver and kidneys from lysine and methionine. L-Carnitine is present as free and acyl form in biofluids such as blood, serum, and plasma. In T2DM, Patients pyruvate dehydrogenase [1] is deficient for which L-Carnitine can act as a stimulant. Furthermore, L-Carnitine is proved to be a biomarker for mitochondria function in which acetyl group is shuttled to maintain the ratio of CoA-SH/acetyl-CoA ratio. Normal value of L-Carnitine is found to be 36.57 µmole/L.
N,N-Dimethylimidodicarbonimidic diamide is the International Union of Pure and Applied Chemistry name for metformin, which is an oral biguanide medication is used alone or in combination in the treatment of Type 2 diabetes. This is the first-line treatment, and metformin tolerability may be enhanced by choosing an appropriate dose titration,
beginning with low doses, so that the side-effects can be lowered or by changing to an extended release form. This can be studied by therapeutic drug monitoring.
METHODS
Instrumentation
Liquid chromatography (LC): Ultra fast LC XR from Shimadzu Mass spectrometer: Triple Quadrupole (API 4000) from MD SCIEX Software: Analyst software version 1.5.1
Reagents/materials
Standards
Analyte 1: L-Carnitine, Sigma-Aldrich, Purity Analyte 2: Metformin, Sigma-Aldrich, Purity
Chemicals
Ammonium Formate: Sigma-Aldrich, Analytical Reagent Grade Acetonitrile: JT Baker, high performance LC (HPLC) Grade Methanol: Merck, HPLC Grade
Ethanol: Ranchem, HPLC Grade Purified water: Milli-Q Waters
EXPERIMENTAL
Literature survey
prognostic tool or for deciding the dose for TDM studies. But this needs to be validated, and the applicability is to be established as a prognostic tool.
Tuning in the mass spectrometer
MD Sciex LCMSMS model API 4000 is used for this development.
L-Carnitine and metformin was scanned individually in tune mode before optimizing for simultaneous analysis.
Molecular mass of L-Carnitine and metformin are 161 and 129. These masses are optimized in the mass spectrometer in infusion mode that is FIA mode. Molecular ions are tuned to maximum intensity by optimizing the tuning parameters like curtain gas, collision gas, Gas 1 (nebulizer gas), Gas 2 (heater gas), etc. Stock dilution with a concentration range of 50-100ng/ml was used for tuning. Less concentration was chosen to get a better response, and if the signal is weak, higher concentration was preferred.
When performing analysis using LC/MS/MS, the LC isolates the compounds using conventional chromatography on a column. The solvent is then removed, and the compounds get ionized after they enter the mass detector. Molecular Ions are then identified as well as filtered depending upon the mass-to-charge ratio (m/z). Depending on the ratio of the direct current and alternating current voltages, the separated molecular Ions below and above a certain m/z value will be then filtered out.
Chromatographic development
Instrument
Shimadzu ultra-fast LC XR.
Selection of mobile phase
Mobile phase solvents and buffer are selected considering that the electrospray ionization (ESI) method is necessary for ionizing the compounds having relatively high polarity and moreover this also necessitates the mobile phase to be sprayed into an electric field that is strong enough to create a fine aerosol of charged droplets.
Selection of mobile phase
• Considering the acid dissociation constant (Pka) of L-Carnitine and
metformin, i.e., 3.8 and 12.33, respectively
• ESI method is used for ionizing compounds • LCMSMS compatible
• Volatility
Isocratic flow is preferred as the mobile phase will be premixed, and the composition remains constant. Also in Isocratic conditions, the column and system are equilibrated and so, the impact of fast chemical changes is not there. However, due to the complex nature of samples, the HPLC systems has developed into a very robust dependable machines, and the columns are constructed to deliver hundreds of injections, and so, in the recent years most of the chromatographic runs depends on the composition gradient in the mobile phase.
In gradient work, the solvent strength is increased with time during the chromatographic run. For example, in reversed phase chromatography, the mobile phase’s composition at the start of the run is highly aqueous and the percentage of the organic modifier (such as methanol or acetonitrile) is increased with time, thereby raising the elution strength.
Column selection
A column with high pure silica material will be selected as these columns will have fewer acidic silanol groups. This will need less buffer and avoid the silanol ionization which can lead to peak tailing. Furthermore, 2 µ column was used to enable good and fast separation.
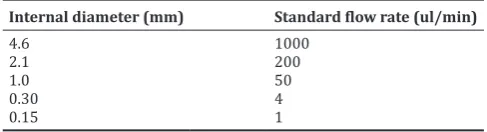
Optimize the flow rate
The ion source temperature was optimized for complete evaporation of solvents depending on the flow rate.
Flow rate was selected by considering the linearity velocity based on the internal diameter as shown in Table 1.
Range selection
Calibration curve (CC) range was selected based on the normal value for L-Carnitine and maximum concentration (Cmax) or in vivo concentration
profile based on the dose for metformin.
Lowest limit of quantification (LLOQ)
LLOQ level was fixed as 1/10th level of Normal value for L-Carnitine and
of Cmax for Metformin.
Upper limit of quantification (ULOQ)
Highest quality control (QC) level was kept as 10 times of normal value for the L-Carnitine and 3 times Cmax for metformin.
Range selected as per below
Standard (STD) A: 75-85% STD B STD B: 45-55% STD C
STD C: 45-55% STD D STD D: 45-55% STD E
STD E: 75-85% of the higher standard STD F: 2-3times of Cmax
QC ranges are as below:
• Quality control lowest limit of quantification (QCLLOQ): Same or
not more than 5% concentration of STD A (LLOQ) (only for Method
Validation)
• Quality control low (QCL): 2.5-3 times of the LLOQ
• Quality control middle (QCM): 40-60% of the ULOQ
• Quality control high (QCH): 70-80% of the ULOQ.
Best fit
Used weighted least squares linear regression by selecting a suitable weighing factor among 1/× and 1/×2.
Include all the calibration points for the calculation of % RE. Calculated % relative error as below:
Selected the weighing factor for both 1/× and 1/×2.
Calculated the % accuracy as below:
% Accuracy = Calculated Concentration Nominal Concentration
100
×
Determined the difference between calculated % accuracy and 100% to get the relative error.
Relative error = 100 - % Accuracy. Considered the sum of absolute values of the relative error to get the sum of the relative error.
Acceptance criteria: The weighing scheme that gives the smallest sum of the relative error (mean of the 3 precision and accuracy [PA] batches) is the best one to use.
Extraction
Protein precipitation (PP)
PP is often used in routine analysis to remove proteins. Precipitation can be induced by the addition of an organic modifier, salt or by changing
the pH which influence the solubility of the proteins (Venn, 2000). The
samples are centrifuged, and the supernatant can be injected into the LC
Table 1: Flow rate selected based on column diameter
Internal diameter (mm) Standard flow rate (ul/min)
4.6 1000
2.1 200
1.0 50
0.30 4
system or be evaporated to dryness and thereafter dissolved in a suitable solvent. The concentration of the sample is then achieved. There are some benefits with the precipitation method as clean-up technique compared to solid phase extraction (SPE). It is less time-consuming, smaller amounts of organic modifier or other solvents are used. But there are also disadvantages. The samples often contain protein residues, and since it is a non-selective sample cleanup method, there is a risk that endogenous compounds or other drugs may interfere in the LC-system. However, the PP technique is often combined with SPE to produce clean extract.
Precipitating agents were selected as per the below concept, perchloric acid (5-28% solution), Trichloroacetic acid (5-25% solution) and acetonitrile/methanol/ethanol (2-3 fold of sample volume), etc. But all these solvents was not able to extract L-Carnitine and metformin consistently so related solvents like ethanol was tried, and found to be giving consistent recovery.
Also processing volume, extraction solvent volume, vortex time, reconstitution solution are optimized to get a consistent and good recovery.
PP was finalized considering the study needs to be conducted in animals, extraction efficiency and nature of samples expected. Biomatrix was also chosen considering the blank interference and to bring out the best possible extraction efficiency.
Selection of internal standard (IS)
IS is required to eliminate and identify the sample preparation and injection volume errors. This also helps in estimating the recovery after the extraction.
IS was trailed based on the below criteria:
• Should be detected under chromatographic conditions of analytes of interest
• Processed blank matrix sample should be free from interference at IS retention time
• Use as IS concentration which would give a response equivalent to middle QC response in an aqueous sample.
Blank interferences
As L-Carnitine is an endogenous compound baseline corrections are required either by cleaning up the matrix using charcoal or dervatizing.
It is very tough to completely clear the same, and so blank correction method was followed. Six blanks were processed and injected repeatedly and then averaged area was considered for correction.
Stability check
Spike in blank matrix, PA batch and inject it immediately.
Retain PA batch samples in an autosampler and re-inject them on the next day to check the auto-injector stability and reproducibility.
Partial volume test
In the case of insufficient sample volume, partial volume test of the sample is established. Partial volume test is carried out at half volumes at high QC level.
Process six sets each of QCH using 50% of processing volume as indicated in the method validation protocol.
Inject these QC samples along with CC standards processed using full volume and calculate the concentrations using the multiplication factor as 2.
Acceptance criteria
• Within batch precision of QC samples should be ≤15%
• Within batch accuracy of QC samples should be ±15% of the nominal
value
• At least 67% of total QCs and at least 50% QCs at each level should
meet the above acceptance criteria.
Robustness
Robustness of analytical methods is the measurement of its capacity to resist small variations of the analytical parameters. Robustness can be performed by making deliberate changes to the method.
Analyze at QCM level using the developed method and incorporate each of the following changes:
• Change in Injection volume (e.g. ± 2 ul) • Change in column oven temperature (e.g. ± 5°C) • Change in flow rate (e.g. ± 0.5 units)
• Change in auto sampler temperature (e.g. ± 5°C).
Compared the results obtained for the test samples with the samples analyzed as per the standard method. The percentage difference of
mean can be ≤15%.
If the variation did not meet the set criteria, for any of the parameter listed above indicated that the variation for that parameter is not permissible.
Cross talk
This test is performed to prove the presence of other drug/metabolite with same daughter ion does not interfere with the analyte of quantification.
• Prepare separate aqueous dilutions of all the analytes or metabolites. • Inject the aqueous LLOQ of each analyte or metabolite separately. • Acceptance criteria: There should not be any area >20% of the
respective analyte or metabolite LLOQ area.
RESULTS AND DISCUSSIONS
A complete literature survey was carried out to collect the full details about the analytes and tabulated as shown in Table 2.
Tuning in the mass spectrometer
The measured mass of [M + H]+ for L-Carnitine(basic) and metformin(neutral) are 162 and 130 respectively and are consistent with expected molecular masses. Ionization Mode and polarity is positive for both the analytes. As both compounds are polar turbo Ion Spray ie ESI in positive mode is selected, and this is a low energy process with little fragmentation. Furthermore, Mass resolution was found to be satisfactory, and background spectrum was acquired and checked for contaminants (Table 3).
After tuning, injected middle concentration of CC range using m/z of selected parent and daughter ion in multiple reaction monitoring mode and optimized ion state file parameter to give maximum stable response using union interface.
CC standards and QC samples
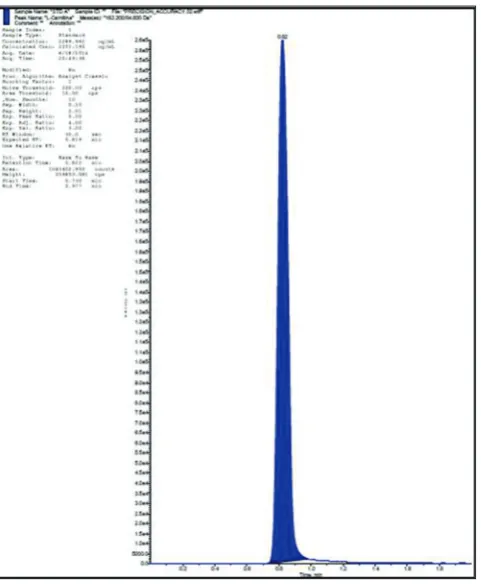
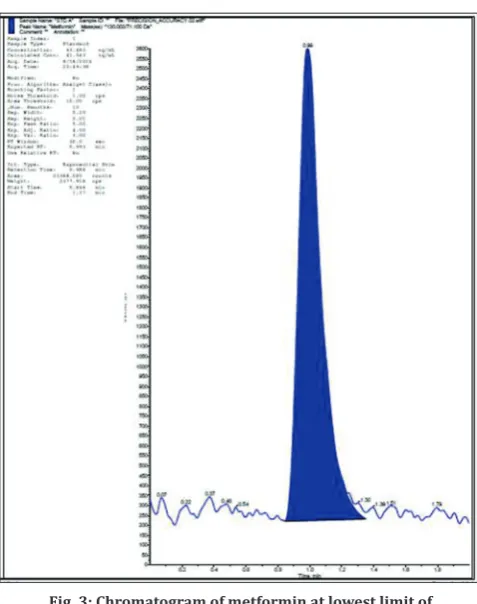
CC standards that consist of a set of 6 non-zero concentrations were prepared ranging from 2.289 µg/mL to 33.675 µg/mL for L-Carnitine and 43.483 ng/ml to 639.450 ng/ml for metformin. QC samples consisted of L-Carnitine concentrations of 2.694 µg/mL (QCLLOQ and refer Fig. 1), 10.776 µg/mL (QCL), 18.858 µg/mL (QCM) and 32.328 µg/mL (QCH and refer Fig. 2) and 51.156 ng/mL (QCLLOQ and refer Fig. 3), 204.624 ng/mL (QCL), 358.092 ng/mL (QCM) and 613.872 ng/mL (QCH and refer Fig. 4) for metformin are prepared.
These samples were stored below −50°C until used. Six sets of QCL and QCH were stored to below −20°C freezer for generation of below −20°C stability. Ranges were selected based on the normal values for
L-Carnitine and Cmax for metformin.
1/×2 was selected as the best fit by calculating the relative error as
validation and subject sample analysis. Injected aqueous dilutions of CC samples of minimum 6 points and found linear with r2≥0.99.
Mobile phase was optimized in gradient flow as below
Pka of L-Carnitine and metformin are 3.8 and 12.33, so mobile phase with 2 mM ammonium acetate and acetonitrile was optimized. Ammonium acetate buffer was used in the mobile phase as retention of ionizable compounds are very sensitive to mobile phase pH and also this is LCMSMS compatible, i.e., volatile. By this, pH based impact is minimized during the analysis.
As this is a simultaneous method with different group molecule, gradient flow was preferred based on the polarity of the molecules and considering the stability of the column (Table 4).
Mobile Phase A: Buffer (2 mM ammonium acetate), Mobile Phase B: Acetonitrile
Optimized extraction
Aliquot the 100 ul biomatrix and added the 500 ul extraction solvent.
Vortex for 5 minutes at 2000 RPM and then centrifuged for 10 minutes at 4°C at 5000 RPM.
Collect 100 ul of Supernatant and dilute inorder to reduce the sample load in column and source.
Fig. 1: Chromatogram of L-Carnitine lowest limit of quantification
level
Table 2: Literature details about the analytes
Parameters L-Carnitine Metformin
Molecular weight 161.198 129.16
Structure
IUPAC name (3R)-3-Hydroxy-4-(trimethylammonio) butanoate N, N-Dimethylimidodicarbonimidic diamide
Chemical formula C7H15NO3 C4H11N5
Appearance White crystalline powder White crystals
Melting point 195-198 222°C-226°C
PKa 3.8 12.33
Solubility Water Water
Tmax 3.3 hrs 6.2 hrs
Elimination 17 hrs 17.6 Half life
Usage Antimethemoglobinemic, cyanide antidote Non-insulin dependent diabetes mellitus
Normal range 36.57 µmole/L NA
Cmax NA 1-2.5 µg/Ml
Synonyms Carnitine, Vitamin BT 1,1-dimethyl-biguanid, flumamine, gliguanid
IUPAC: International Union of Pure and Applied Chemistry, Cmax: Maximum concentration, Pka: Acid dissociation constant
Table 3: Mass parameters
Parameter L-Carnitine Metformin
Source ESI ESI
Mode +Ve +Ve
Parent Ion 162 130
Daughter ion 84 71
Temperature 500 500
Ion spray voltage 5500 5500
Curtain gas 30 30
CAD 4 4
DP 33 40
EP 10 10
CE 33 27
CXP 8 11
ESI: Electrospray ionization, CAD: Collisionally activated dissociation, CE: Collision energy, DP: Declustering potential, EP: Entrance potential, CXP: Collision exit potential
Table 4: Gradient flow
Time MPA (%) MPB (%)
0.01 70 30
0.40 70 30
1.50 40 60
1.60 40 60
1.75 30 30
2.00 30 30
Handling L-Carnitine present endogenously
Six blank matrix were extracted by PP method and quantified for both L-Carnitine and Metformin. In the same sequence CC with QCs at levels LLOQ, QCL, QCM and QCH was extracted and injected.
Six blank samples were processed and injected. Then the averaged value is corrected against the acquired area, and this should be carried for every run. This corrected area was considered for all accuracy calculations. All the six human plasma lots were free of any significant interference after correction (Table 5).
Table 5 shows averaged blank area was found to be 870876, and this was corrected for all CC standards and QC samples. The normalized accuracy was acceptable with the actual accuracy. This procedure should be followed for validation and sample analysis in every sequence.
And for metformin, all the six human plasma lots were free of any significant interference.
Stability was evaluated by re-injecting the PA batch with 6 CC standards and triplicate QCs of four levels after 30.5 hr found to be within acceptance criteria.
IS slection
Compounds like Omeprazole were tried as IS. But since both L-Carnitine and metformin belong to a different class of compounds, results using the IS was highly varying. And as the extraction chosen was PP in which were extraction steps are minimal and also accuracy without IS is better comparatively, it was decided to go without IS.
Many trials were carried with IS, and one CC results are included below with and without IS for information.
Partial volume test was not done and so not recommended. This will be informed once the activity will be completed.
Robustness
As per the below robustness data method proved to be robust for flow rate and autosampler temperature but injection volume and column oven temperature did not meet the acceptance criteria for metformin and L-Carnitine, respectively (Table 6).
Fig. 2: Chromatogram of metformin at upper limit of quantification level
Fig. 3: Chromatogram of metformin at lowest limit of quantification level
As both metformin and L-Carnitine belong to different class compounds, cross talk possibility is less, and this was proved by the mass transitions.
CONCLUSION
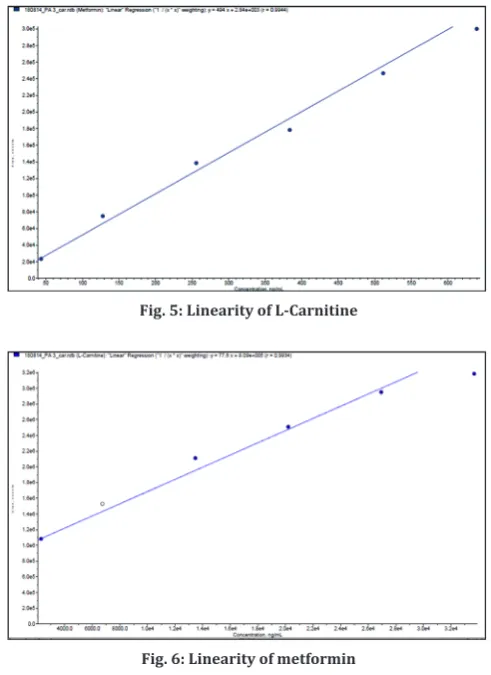
The Bioanalytical method described above is valid for the simultaneous estimation of L-Carnitine and metformin, in human plasma over a range of 2.289 µg/mL to 33.675 µg/mL for L-Carnitine (Fig. 5) and 43.483ng/ml to 639.450ng/ml (Fig. 6) for metformin and is stability proven, linear, rugged, precise, and accurate. This method can be applied for simultaneous quantification in human plasma for drug discovery, therapeutic monitoring or as a prognostic tool if proved. Below instrumental and analytical conditions should be used for validation and analysis.
Analytical Conditions
Liquid chromatographic conditions:
Column name Princenton C18, 50 mm×4.6 mm, 5 µm
Mobile phase Gradient
Rinsing solution Acetonitrile: Water: 50:50 v/v
Column oven 35°C
Auto-injector temperature 10°C
Injection volume 10 µL
Flow rate 0.6 mL/minute
RT of L-Carnitine 0.8 (±0.5) minutes
RT of metformin 1.2 (±0.5) minutes
Run time 2 minutes
RT: Retention time
Fig. 5: Linearity of L-Carnitine Table 5: Blank correction
Blank Level Actual area Corrected area Actual caltd conc Normalised area Normalised accuracy Actual ACC
870876 STD A 1083402.95 212527.326 2251.195 208929.4292 98.30708981 98.307
870876 STD B 1528358.587 657482.963 7982.556 779250.3622 118.5202364 118.52
870876 STD C 2110724.644 1239849.02 15483.866 1425176.915 114.947618 114.948
870876 STD D 2509612.469 1638736.845 20621.839 1672499.175 102.0602655 102.06
870876 STD E 2950658.574 2079782.95 26302.843 2030538.677 97.6322398 97.632
870876 STD F 3184572.427 2313696.803 29315.828 2014137.744 87.05279541 87.053
870876 LLOQ 1 1097191.397 226315.773 2428.8 204031.4978 90.15345909 90.153
870876 QCL 1 1762616.243 891740.619 10999.97 910249.8555 102.0756301 102.076
870876 QCM 1 2110724.644 1239849.02 18931.9 1244673.767 100.3891399 100.389
870876 QCH 1 2509612.469 1638736.845 29007.737 1470389.462 89.72700324 89.727
870876 LLOQ 2 1077625.495 206749.871 2176.777 167051.2878 80.79873856 80.799
870876 QCL 2 1749648.499 878772.875 10832.935 883391.7704 100.5356074 100.526
870876 QCM 2 2353888.163 1483013.539 18615.994 1463941.036 98.7140026 98.714
870876 QCH 2 3121043.573 2250167.949 28497.529 1983496.565 88.14882309 89.727
STD: Standard, LLOQ: Lowest limit of quantification, QCL: Low quality control, MQC: Middle quality control, HQC: High quality control
Fig. 6: Linearity of metformin
A summary of the mass spectrometric conditions is as follows:
Ion source Turbo ion spray positive ion mode
m/z 162/84 (L-Carnitine)
130/71 (metformin)
Gas 1 50
Gas 2 50
Temperature 500
Ion spray voltage 5500
Curtain gas 30
Collisionally activated
dissociation 4
Declustering potential 33 (L-Carnitine), 40 (metformin)
Entrance potential 10
Collision energy 33 (L-Carnitine), 27 (metformin) Collision exit potential 8 (L-Carnitine), 11 (metformin)
Table 6: Robustness
Carnitine
Parameter Actual Robustness %Diff
QCM QCM QCM
Injection volume+2 1491914.157 1698673.822 −13.8587 Injection volume−2 1491914.157 1287318.63 13.71363
Column oven−5° 1491914.157 1278675.428 14.29296
Column oven+5° 1491914.157 1259711.973 15.56404 Flow rate+0.5 ml/minutes 1491914.157 1474863.663 1.14286
Autosampler−5°/minutes 1491914.157 1538935.284 −3.15173
Metformin
Injection volume+2 181472.242 213421.201 −17.6054 Injection volume−2 181472.242 149017.283 17.88426
Column oven−5° 181472.242 176105.183 2.95751
Column oven+5° 181472.242 170891.522 5.830489 Flow rate+0.5 ml/minutes 181472.242 191498.829 −5.52514 Autosampler−5°/minutes 181472.242 184579.975 −1.71251
The bioanalytical method used for measurement of analyte(s) (drug(s) and/or its metabolite(s)) content in biological matrix (like blood, plasma, serum, or urine) should be demonstrated to be reliable and reproducible.
Method validation should be carried out as per United States Food and Drug Administration [5] and International Conference on Harmonization [6] guidelines and the parameters validated are as below:
• Specificity and selectivity • Matrix effect
• Carry over test • Ruggedness
• Precision and accuracy • Recovery
• Reinjection reproducibility • Dilution integrity
• Stability (FT, bench top, dry extract, wet extract, long term)
The weighting factor 1/×2, which was established in method development,
should be utilized for the method validation and sample analysis.
REFERENCES
1. Mingrone G, Greco AV, Capristo E, Benedetti G, Giancaterini A, De Gaetano A, et al. L-carnitine improves glucose disposal in type 2 diabetic patients. J Am Coll Nutr 1999;18(1):77-82.
2. Sowell J, Fuqua M, Wood T. Quantification of total and free carnitine in human plasma by hydrophilic interaction liquid chromatography tandem mass spectrometry. J Chromatogr Sci 2011;49(6):463-8.
3. Zhang W, Han F, Zhao H, Lin ZJ, Huang QM, Weng N. Determination of metformin in rat plasma by HILIC-MS/MS combined with Tecan automation and direct injection. Biomed Chromatogr 2012;26(10):1163-9.
4. Heinig K, Bucheli F. Fast liquid chromatographic-tandem mass spectrometric (LC-MS-MS) determination of metformin in plasma samples. J Pharm Biomed Anal 2004;34(5):1005-11.
5. Bioanalytical Method Validation - Food and Drug Administration. Available from: http://www.fda.gov/downloads/drugs/ guidancecomplianceregulatoryinformation/guidances/ucm368107.pdf 6. Q2(R1) – ICH. Available from: http://www.ich.org/fileadmin/Public_