CSEIT16132 | Received: 05 Nov. 2016 | Accepted: 25 Nov. 2016 | November-December-2016 [(1)3: 06-10]
International Journal of Scientific Research in Computer Science, Engineering and Information Technology © 2016IJSRCSEIT | Volume 1 | Issue 3 | ISSN : 2456-3307
6
Geospatial Study of Agricultural value chain of fruit markets in
Ile – Ife, Osun State, Nigeria
J. E. Adewoyin
1, S. A. Ogunyemi
1, O. Fasote
1, I. A. Jesuleye
1, T. A. Alaga
1 1Cooperative Information Network, Obafemi Awolowo University, Ile – Ife Nigeria
Authors’ contributions
This work was carried out in collaboration between the authors. Author JEA designed the study, wrote the proposal collected the data wrote the first draft of the manuscript, author SAO and OF, analyzed the data. Authors IAJ and
TAA reviewed the relevant literatures. All authors read and approved the final manuscript
ABSTRACT
This study was carried out in Ife East and Ife Central Local governments area of Osun State on agricultural value chain of fruit markets in. The objectives of the study was to examine the spatial distribution of the fruit markets, Identify key supply areas of fruit markets for cost network analysis and produce a price graph for fruits in the study area. Administrative map of the area, GPS coordinates of the markets and oral interview are the sources of data for this study while GIS software and Microsoft Excel were used in analyzing the data. The fruit markets were purposively selected. Results showed that fruit markets were located in the urban parts of the two local government areas and sources of supply were similar with different costs of transportation.
Keywords: Fruit Markets, Cost Network Analysis, Price Graph
I.
INTRODUCTION
Food production has its limitations and so all food cannot be produced in all places. In other words, food production is restricted to specific locations where soil, weather and moisture favor their activity. Nevertheless, food produced has to be consumed worldwide by the human beings, animals, birds and others in need. Market analysis starts with an understanding of the geography of markets: how markets are spatially distributed and linked and how commodities move through this broader market network. It is also critical to know the geographic distribution of key supply areas. (1).
Marketing is as critical to better performance in agriculture as farming itself. Therefore, market reform and marketing system improvement ought to be an integral part of policy and strategy for agricultural development. Marketing is one of those facilities needed for overall economic development of nations. (2).
A market network refers to how a market system is structured spatially, where a particular good originates
and where it ends up. An agricultural value chain is defined as the people and activities that bring a basic agricultural product like maize, fruit vegetables or cotton from obtaining inputs and production in the field to the consumer, through stages such as processing, packaging, and distribution.
Fruit has been recognized as a good source of vitamins and minerals, and for their role in preventing vitamin C and vitamin A deficiency. People who eat fruit as part of an overall healthy diet generally have a reduced risk of chronic diseases.
A value chain is defined as a series of participants along the entire marketing spectrum who collaborate to satisfy market demand for specific products or services to their joint and collective mutual benefit. Wholesaling and retailing are the two main functions within the supply chain.
consumer, usually in small quantities. In an agro-industry set-up, wholesalers may purchase produce directly from the farmer or through commodity brokers. The produce is then sold in bulk to food processing companies, marketing agencies, domestic retail outlets or exported directly to foreign markets. Wholesalers and retailers play an increasingly important role in setting production, packing and distribution standards (3).
Eating a diet rich in fruit may reduce risk for stroke, other cardiovascular diseases and type-2 diabetes. A fruit containing eating pattern is part of an overall healthy diet and may protect against certain cancers. Fruit helps maintain optimum health due to the health promoting phytochemicals it contains – many of which are still being identified. One to 2-1/2 cups of fruit are recommended each day, depending on how many calories an individual need. (4,5,6,7,8,9,10) Fruit and Vegetable crops are important both for health and economy, demand for fruit and vegetables consumption tends to grow very rapidly with urbanization, increased awareness and income of the peoples (11).
There is therefore the need to know where one can get these fruits at each point in time as well as the cost of purchasing them in each of the season since some of these fruits are seasonal, except oranges that is an all year round.
II.
METHODS AND MATERIAL
2.1 Aim
The aim of the study is to spatially assess agricultural value chain of fruits market in the study area.
Specific objectives are:
Assessing spatial distribution of fruit markets in Ile – Ife area, using geospatial techniques.
Identifying key supply areas of fruit markets for cost network analysis
Producing a price graph for fruits in the study area.
2.2 The study area
Ife East Local Government Area in Osun State lies between Longitudes 4°32′E and 4°40′E and Latitudes 7°15’N and 7°35’N, while Ife Central Local Government lies between latitudes 7o 28’ 43.5’’N and
7o37’ 51.41’’N and spans between longitude 4o 27’ 22.5’’E and 4o35’ 40.61’’E.
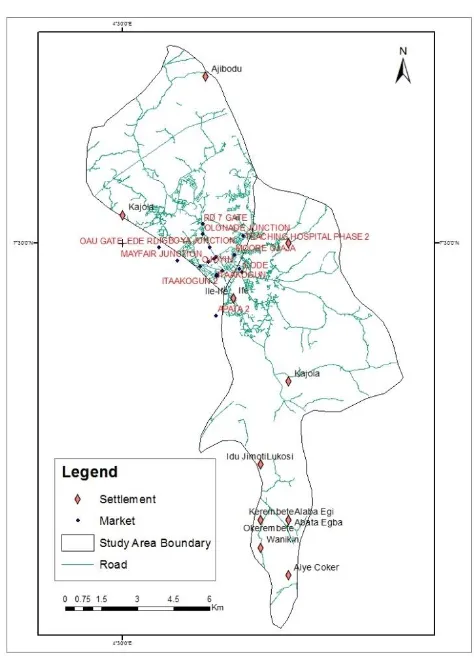
Figure 1 : Study Area, Ife East and Ife Central Local Government Area
III.
RESULTS AND DISCUSSION
3.1 Spatial distribution of fruit markets in Ile - Ife
Figure 2. Distribution of fruit markets in the study area
Figure 2 above shows the spatial distribution of fruit markets in the study area. This also showed that these fruit markets are mainly in the urban areas of the study area because most of these markets are retail markets.
Figure 3. Apata 2 Fruit Market (Ife East Local Government)
Fig. 3 shows one of the fruit markets in the study area. The fruit market is located in Ife east Local Government and the supply areas of this market is Egbejoda and Garaje Olode. This market is patronizing supply area whose cost of transportation is higher than other supply areas. It could be that fruits bought in Garaje Olode is much cheaper than other supply area which covers for the transportation expenses. No marketer will want to make a loss since every marketer will want to maximize profit at all cost.
Table 1 : Cost Comparison Of Supply Area With Two Markets
From table 1, it could be seen that Road 7 Gate fruit market patronizes both Osu and Gbongan and not Egbejoda, whose cost of transportation is least for all the supply areas. While Apata 2 fruit market patronizes Egbejoda and Garaje Olode, not minding the high cost of transportation of Garaje Olode supply area (the highest). One of the reasons for their choice of supply area could be; availability of fruits in all season and cost of purchase may not be as high as in other supply areas. Distance travelled and road accessibility could also account for this.
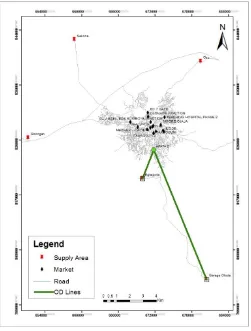
Figure 4. Road 7 Gate Fruit market (Ife Central Local Government)
Fig. 4 is the cost destination of Road 7 Gate Fruit market (Ife Central Local government area) and this market patronizes just Osu and Gbongan supply areas and their cost of transportation is N312 and N448 respectively.
Table 2 : Origin Destination Cost
S/N MARKET SUPPLY AREA TOTAL COST
OF
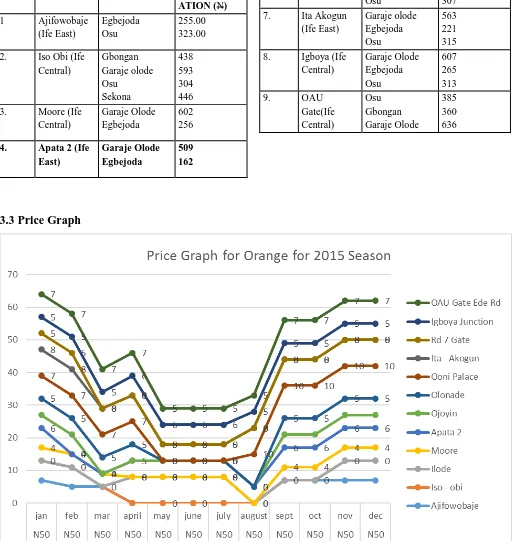
Figure 5. Price graph for orange for 2015 season
The graph shows the quantity of orange that would be bought for N50 in each of the market for the year 2015. The interpretation therefore is as follows that during the period of September to April seven pieces of orange will be bought for N50 at OAU Gate, Ede Rd, while
implication for a consumer is that the best palace to buy from during the months of September and December or January is Ooni’s palace, while it is not advisable to go to either Igboya Junction, Olonade and Moore Markets. It is also available to go to Rd 7 Gate, Ita – Akogun and Ooni’s Palace during the months of February to April to buy oranges because of the quantity.
IV.CONCLUSION
It could be concluded that
(i) there are at least five supply areas where the respondents get their products and all within Osun state. (ii). More than eighty percent of the respondents go to a particular supply area not minding the high cost of transportation and this may be due to the fact that goods there are cheaper compare to the other supply areas and they are able to get the cost of transportation back. (iii). The price graphs showed that there are at least two seasons for oranges with different prices for the commodity.
V.
ACKNOWLEDGEMENT
We acknowledge the immense contribution of Mr. Sam Adeyemi, Mr. K. Muibi and Dr. A. Atijosan and all the authors. Competing Interest: Authors have declared that there is no competing interest.
VI.REFERENCES
[1] Chopak, C. (1998). “Price Analysis for Early Warning Monitoring and Reporting.” FEWS. SADC Regional Early Warning System for Food Security.
[2] Acharya, S., (2004). Agricultural Marketing: Millennium Study of Indian Farmers. vol.17. [3] United Nations, International Market Access
Information Horticulture Sector. Geneva: United Nations, 1998.
[4] Prior, R.L. and Cao, G. 2000. Antioxidant phytochemicals in fruits and vegetables; diet and health implications. Hort Science 35:588-592. [5] Produce for Better Health Foundation. 1999.
Dietary guidelines: the case for fruits and vegetables first. Produce for Better Health Foundation, Wilmington, DE Website : http://www.5aday.com).
[6] Quebedeaux, B. and Bliss, F.A. 1988. Horticulture and human health. Contributions of fruits and vegetables. Proc. 1 Intl. Symp. Hort. and Human Health. Prentice Hall, Englewood, NJ.
[7] Quebedeaux, B. and Eisa, H.M. 1990. Horticulture and human health. Contributions of fruits and vegetables. Proc. 2 Intl. symp. Hort. and Human Health. HortScience 25:1473-1532.
[8] Southon, S. 2000. Increased fruit and vegetable consumption within the EU: potential health benefits. Food Res. Intl. 33:211-217.
[9] Tomas-Barberan, F.A. and Robins, R.J. (eds.). 1997. Phytochemistry of fruits and vegetables. Oxford Science Publ., Oxford, UK, 375 pp.
[10] Wargovich, M.J. 2000. Anticancer properties of fruits and vegetables. HortScience 35:573-575 [11] Muluneh B. ,Kebenu F. and Shimelis G. (2016):