DEVELOPMENT AND VALIDATION OF STABILITY INDICATING REVERSE PHASE
HIGH‑PERFORMANCE LIQUID CHROMATOGRAPHIC METHOD FOR THE ESTIMATION OF
PIRIBEDIL IN BULK DRUG
ROHITH KBV, VENKATA RAMANA G, MADHAVI LATHA N, SUPRIYA P, HARINI U, PAWAR AKM*
Department of Pharmaceutical Analysis & Quality Assurance, A. U. College of Pharmaceutical Sciences, Andhra University, Visakhapatnam, Andhra Pradesh, India. Email: [email protected]
Received: 29 October 2015, Revised and Accepted: 10 November 2015 ABSTRACT
Objective: A simple, precise, fast, economic, accurate, robust, and stability indicating isocratic reverse phase high-performance liquid chromatographic method was developed for the analysis of Piribedil.
Method: The chromatographic conditions were standardized using Unisol C-18 (4.6 × 150 mm × 3.0 μ) column with UV detection at 244 nm, and the mobile phase composed of methanol:acetate buffer-pH 5.0 (85:15, v/v).
Results: The retention time of Piribedil was found to be 3.4 minutes. The calibration curve was linear with correlation coefficient of 0.999 over a
concentration range of 20-100 μg/ml with linear regression equationy=74,69,224.37x−39,46,924.90. The limit of detection and limit of quantitation were found to be 0.04 and 0.4 μg/ml, respectively.
Conclusion: The proposed method has been validated according to the ICH guidelines. Piribedil was subjected to stress conditions including
acidic, alkaline, oxidation, photolysis, and thermal degradation. Piribedil is more sensitive to photolytic stress. There are no interfering peaks from
degradation products at analyte retention time, and thus the method is specific for the estimation of Piribedil in the presence of degradation products. Thus, the proposed method can be successfully applied in the routine quality control and stability samples of Piribedil in bulk drug.
Keywords: Piribedil, Validation, Stability indicating, Reverse phase high-performance liquid chromatographic.
INTRODUCTION
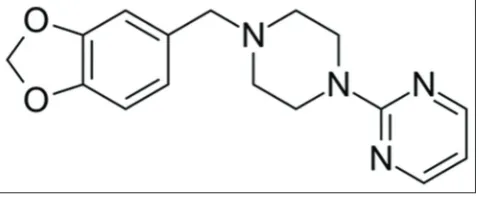
Piribedil chemically 2-[4-(benzo[1,3]dioxol-5-ylmethyl)piperazin-1-yl]pyrimidine (Fig. 1), is an antiparkinsonian agent and piperazine derivative which acts as D2 and D3 receptor agonist. It also has alpha-2 (α2) adrenergic antagonist properties [1]. Piribedil is a
non-ergot dopamine D2 agonist that stimulates cerebral and peripheral
dopamine receptors and corrects dopamine deficiency. It is used
largely, as an adjunct to levodopa therapy (80-140 mg daily) or as monotherapy (150-250 mg daily in divided doses) in the treatment of Parkinson’s disease [2], which is a neurodegenerative disorder that
affects dopaminergic neurons and causes symptoms including muscle rigidity, tremors and changes in speech and gait. After diagnosis,
treatments can help relieve symptoms, but there is no cure [3].
Only a few studies were conducted to determine Piribedil in human
serum, urine, and pharmaceutical dosage form by LC-DAD [4] and its p-hydroxylated, catechol, and N-oxide metabolites in plasma by
high-performance liquid chromatographic (HPLC) [5]. Hence, so far no single stability indicating method (SIM) by HPLC has been
reported for the estimation of Piribedil in bulk drug. The objective of
the present work was to develop a stability indicating reverse phase-HPLC method for the estimation of Piribedil in bulk form and validate it according to ICH guidelines. The objective of the present work was to develop a stability indicating reverse phase-HPLC method for the estimation of Piribedil in bulk form and validate it according to ICH
guidelines [6-9].
METHODS
Instrumentation and chromatograph
The chromatograph used was Agilent 1260 infinity series equipped with a 1260 quaternary pump, 1260 infinity auto sampler unit, 1290 infinity PDA detector with OpenLab CDS EZChrom Ed. workstation. All weighings for analysis were performed on Mettler-Toledo analytical balance Me-204.
Chemicals
The working standard used was Piribedil, which was supplied by
Dr. Reddy’s laboratories Pvt Ltd., Hyderabad, as a gift sample. Methanol, ammonium acetate, hydrochloric acid, sodium hydroxide, hydrogen peroxide and HPLC grade water were procured from Merck Speciality Pvt. Ltd., Mumbai, Maharashtra, India, and Glacial acetic acid from Qualikems Fine Chem Pvt. Ltd., Vadodara, India.
Preparation of standard and sample solutions
Accurately weighed and transferred 100 mg of Piribedil working standard into a 100 ml clean and dry volumetric flask. Dissolved it in 10 ml of methanol by sonication and the volume was made with methanol to get 1000 mg/ml. From the above solution, 10 ml was pipetted out and transferred into a 100 ml clean and dry volumetric
flask and volume were made with diluent (60:40v/v – methanol:water) to get 100 mg/ml. Sample solutions were prepared by appropriate
dilution of standard solutions with the diluent.
Preparation of buffer
Accurately weighed quantity (1.54 g) of Ammonium acetate was
transferred into a 1000 mL volumetric flask. About 900 mL of HPLC grade water was added and degased by subjecting to sonication for 5 minutes and final volume was made with double distilled water to get
20 millimolar solution. The pH of the solution was adjusted to 5.0 with
glacial acetic acid. The buffer was filtered through 0.45 μ filter paper under vacuum before use.
Method development and optimization
The dilutions were chromatographed by a set of conditions on Agilent
Infinity 1260 series. A mixture of methanol: acetate buffer (pH 5.0)
85:15 v/v was used as a mobile phase for the elution of Piribedil on Unisol C-18 (4.6 × 150 mm × 3.0 μ) at 1 ml/minute flow rate and at 20°C column temperature. Piribedil was eluted at 3.4 minutes with a
run time of 5 minutes, and detection was performed by photodiode
array (PDA) detector at 244 nm.
Method validation
The method was validated for analytical procedures according to ICH guidelines to determine the system suitability, specificity, linearity,
accuracy, precision, limit of detection (LOD), limit of quantitation (LOQ), and robustness.
System suitability
System suitability parameters were analyzed to check the system performance consistency. 20 μl of standard solution (60 μg/ml) was injected in six replicates under optimized chromatographic conditions, and column performance characteristics such as tailing factor, the number of theoretical plates, retention time and area were observed.
Percentage of relative standard deviation (%RSD) were calculated and
listed in Table 1.
Forced degradation studies/specificity
Stress testing of the drug substance can help identify the likely
degradation products, which can, in turn, help establish the degradation pathways and the intrinsic stability of the molecule and validate the stability indicating the power of the analytical procedures
used [6].
Stress testing was carried out on the standard solution of Piribedil
having the concentration of 10 μg/ml by exposing to acidic, basic, oxidative, thermal and photolytic stress conditions.
Acid degradation was carried out by using 1M HCl and alkaline degradation by 1M NaOH for 24 hrs at 60°C. After cooling, the solutions
were neutralized and diluted accordingly with mobile phase.
Oxidative stress testing was done using 3% H2O2 at 60°C for 24 hrs. The
sample solution was cooled and diluted.
For thermal stress testing, the drug solution (10 μg/ml) was heated in a hot air oven at 80°C for 48 hrs and the solution was cooled and
used.
Photostability testing was demonstrated by exposing the drug solution
(10 μg/ml) to direct sunlight for 48 hrs.
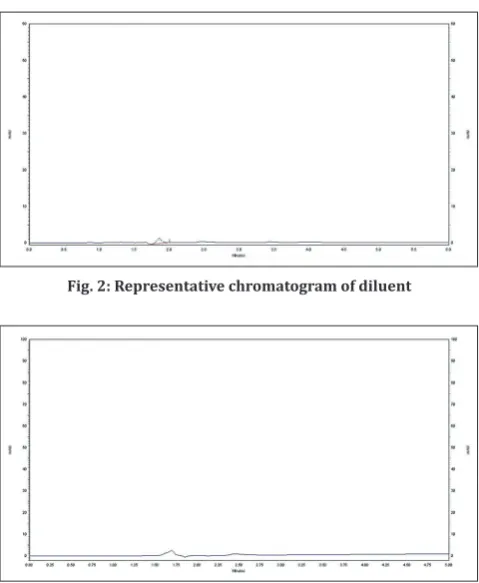
All the above solutions including diluent and blank/mobile phase were filtered before injection and analyzed to evaluate the stability indicating properties and specificity of the method.
The results were shown in Figs. 2-5 and tabulated in Table 2.
Fig. 2: Representative chromatogram of diluent
Fig. 3: Representative chromatogram of blank/mobile phase
Fig. 4: Representative chromatogram of standard (10 μg/ml)
Table 1: System suitability parameters
Injection number Response (area) of Piribedil Theoretical plates Tailing factor Rt
1 440949836 11990 1.05 3.43
2 442189400 11978 1.04 3.44
3 441459973 11897 1.05 3.44
4 442127725 11901 1.03 3.44
5 441333462 11992 1.05 3.44
6 441609209 11945 1.05 3.44
Mean 441611600833 11950 1.045 3.438
Standard deviation 477184.79 43.316 0.008366 0.00408
% RSD 0.11 0.36 0.80 0.12
Linearity
Linearity was evaluated by analyzing different concentrations of the standard solutions of Piribedil. The response was a linear function of
concentration over a range of 20-100 μg/ml which was used as working a range of the method. Peak area and concentration were subjected to statistical methods to calculate the calibration equation and correlation coefficient, which were shown in Table 3 and Fig. 6.
Accuracy
Accuracy was determined by recovery method at three different concentration levels, i.e., 50%, 100% and 150% by using standard addition method and injecting each concentration in triplicate. The results are tabulated in Table 4.
Precision
Intra- (repeatability) and inter-day (intermediate precision) precision
studies for Piribedil were done by injecting the standard solution
(60 μg/ml) on the same day and different days. This was performed with replicates of the standard solution under the same experimental
conditions. The results are shown in Tables 5 and 6.
LOD and LOQ
LOD and LOQ were determined by injecting various concentrations of standard solutions ranging from 0.03 to 0.1 μg/ml, and signal to noise
(s/n) ratio of the peaks were recorded, prior to this the mobile phase
was allowed to equilibrate with stationary phase until steady baseline was obtained.
Robustness
The robustness of the analytical procedure was done by injecting the
standard solution in six replicates and recording the system suitability
parameters after the introduction of small deliberate changes in flow
Fig. 5: Representative chromatogram of photolytic degradation
Fig. 6: Linearity chart
Table 2: Summary of forced degradation studies
Stress condition Time Assay of active
substance % Remarks
Acid hydrolysis (1M HCL) 24 hrs 99.37 No degradation Base Hydrolysis (1M NaOH 24 hrs 98.92 No degradation Oxidation (3% H2O2) 24 hrs 99.94 No degradation
Thermal (80°C) 48 hrs 99.12 No degradation
Photolytic degradation 48 hrs 81.76 Degraded
Table 3: Linearity of detector response
Concentration (μg/ml) Area response of Piribedil
20 142777358
40 295840522
60 442458842
80 604671815
100 735284148
Table 4: Recovery studies of Piribedil
Serial number % Level Spiked amount (μg/ml) Standard amount (μg/ml) Amount found (μg/ml) % Recovery Mean recovery
1 50 20 40 59.89 99.82 Mean=99.703
SD=0.168 RSD=0.17%
20 40 59.70 99.51
20 40 59.86 99.78
2 100 40 40 79.71 99.64 Mean=99.70
SD=0.121 RSD=0.12%
40 40 79.87 99.84
40 40 79.69 99.62
3 150 60 40 100.01 100.01 Mean=99.85
SD=0.156 RSD=0.15%
60 40 99.71 99.71
60 40 99.83 99.83
RSD: Relative standard deviation, RT: Retention time
Table 5: Intra day precision studies
Injection
number Area Observation Acceptance criteria
1 441964329 Mean
SD: Standard deviation, RSD: Relative standard deviation
Table 6: Inter day precision studies
Injection
number Area Observation Acceptance criteria
1 441328151 Mean
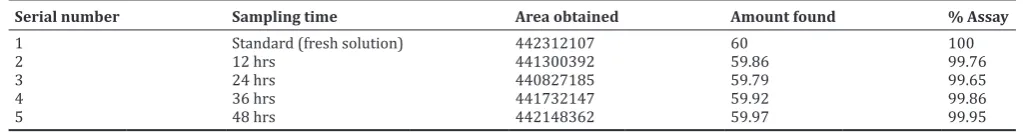
Table 8: Solution stability data
Serial number Sampling time Area obtained Amount found % Assay
1 Standard (fresh solution) 442312107 60 100
2 12 hrs 441300392 59.86 99.76
3 24 hrs 440827185 59.79 99.65
4 36 hrs 441732147 59.92 99.86
5 48 hrs 442148362 59.97 99.95
Table 7: Robustness data or Piribedil
Parameter Change level RT % RSD of peak area Tailing factor USP plate count
Flow rate (±0.2 ml/minute) 0.8 ml/minute 4.27 0.09 1.07 14022
1.2 ml/minute 2.85 0.17 1.00 10238
Column temperature variation 15°C 3.44 0.09 1.07 15062
25°C 3.41 0.14 1.01 10572
Mobile phase composition 70:30 6.22 0.19 1.01 9872
80:20 4.33 0.17 1.01 10672
Buffer pH pH 4.5 3.48 0.10 1.04 15938
pH 5.5 3.42 0.13 1.07 10879
RSD: Relative standard deviation, RT: Retention time
rate (±0.2 ml), temperature (±5°C), mobile phase composition and buffer pH (±0.5). The results obtained are shown in Table 7.
Solution stability study
Stability in solution was evaluated for the standard solution. The
solutions were stored at ambient temperature, without the protection
of light and tested after 12, 24, 36, and 48 hrs. The responses for the
aged solution were evaluated by comparison with freshly prepared solution. The results are shown in Table 8.
RESULTS AND DISCUSSION System sutablity studies
The RSD values for system suitability parameters like retention time, tailing factor, and theoretical plate count were less than 2%
indicating that the present conditions were suitable for the analysis of Piribedil.
Specificity
Degradation was not observed when the drug solutions were subjected
to stress conditions like acid hydrolysis, base hydrolysis, oxidation, and
heat.
Approximately Piribedil showed moderate degradation of about 18% (sum of 3 degradants L1, L2, L3) after exposure to sunlight for 48 hrs. The UV spectra of pure Piribedil and undegraded Piribedil were
compared and found to be similar with regard to λmax and appearance.
The absence of co-eluting peak and well separation of degraded products from parent peak of Piribedil indicated that the developed method is specific for the estimation of Piribedil in the presence of degradation products.
Linearity
The response was found to be linear in the concentration range of
20-100 μg/ml and the correlation coefficient was found to be 0.999.
Accuracy
The values of percentage recoveries of the three concentrations were
within the limits of 100±2% and the mean percentage recovery values close to 100%, and low %RSD values indicate the high accuracy of the
analytical method.
Precision
The low values of the %RSD showed that the repeatability and
intermediate precision of the method were within the acceptable value.
LOD and LOQ
The LOD value was found at 0.04 μg/ml concentration where the signal to noise ratio was found to be 3:1 and the LOQ value was found at 0.14 μg/ml with a signal to noise ratio of 10:1.
Robustness
The low levels of %RSD indicate that the method is robust.
Solution stability
During the study of the stability of stored solutions of standards preparation for assay determination, the solutions were found to be stable for up to 48 hrs. Assay values obtained after 48 hrs were identical with the initial value without a measurable loss.
CONCLUSION
A new stability indicating isocratic reverse phase liquid chromatographic method was developed and validated according to the ICH guidelines. It was simple, fast, precise, accurate, robust and economic. Degradation products resulting from the stress studies were well resolved from the
analyte peak with a significant difference in Rt values.
Even though no attempt has been made for the identification of the degraded products, the proposed method can be used as a SIM for
determination of Piribedil in bulk drug.
ACKNOWLEDGMENTS
The author is thankful to Andhra University College of pharmaceutical
sciences, Visakhapatnam (District), Andhra Pradesh, India for
providing research facilities. I am also thankful to my fellow classmates
N. Honeesha and M. Monica.
REFERENCES
1. Wikipedia. Piribedil. 2015. Available from: https://www.en.wikipedia. org/wiki/Piribedil. [Last cited on 2015 Feb 01].
2. Ailments D. Drugs N. Piribedil - Find Alternatives, Check Prices only at 1mg.com. 1mg.com. 2015. Available from: https://www.1mg.com/ generics/piribedil-210524. [Last cited on 2015 Feb 18].
3. WebMD. Parkinson’s Disease Health Center. 2015. Available from: http:// www.webmd.com/parkinsons-disease/. [Last cited on 2015 Feb 18]. 4. Altiokka G, Can N, Aboul-Enein H. Determination of piribedil in
human serum, Urine and pharmaceutical dosage form by LC-DAD. Chroma 2008;67(11-12):905-10.
chromatography. J Chromatogr B Biomed Sci Appl 1991;563(2):323 32. 6. International Conference on Harmonization (ICH) of Technical
Requirements for the Registration of Pharmaceuticals for Human Use. Stability Testing of New Drug Substances and Products, Q1A (R2). Geneva: International Conference on Harmonization; 2003.
7. Ebi.ac.uk. Compound Report Card. 2015. Available from: https://www. ebi.ac.uk/chembl/compound/inspect/CHEMBL1371770. [Last cited on 2015 Mar 08].
8. International Conference on Harmonization (ICH) of Technical Requirements for the Registration of Pharmaceuticals for Human Use. Validation of Analytical Procedures: Definitions and Terminology, Q2A. Geneva: International Conference on Harmonization; 1996.