EFFECT OF CORRELATED GENE DISTRIBUTION DUE TO SAMPLING ON THE DIALLEL ANALYSIS
RAJA F. NASSARI
Department of Genetics, University of California, Davis
Received December 7 , 1964.
HE theory and analysis of diallel crosses as presented by JINKS and
HAYMAN
T(1953) and JINKS ( 1954), and extended by HAYMAN (1954), has one of its features theV,, W ,
distribution which is used to investigate simultaneously the genetical properties of a group of homozygous parents. The assumptions under- lying this theory are: (i) diploid segregation in the parents; (ii) no difference between reciprocal crosses; (iii) homozygous parents; (iv) two alleles per locus; (v) no nonallelic interaction; (vi) noncorrelated gene distribution between the parents. If all of the above assumptions are met, then the line of regression of W,, the covariance between the offspring of the rth parent and their nonrecurrent parents, on V,, the variance of all these offspring, would have a slope of one. The line of unit slope through the origin is that of complete dominance. Movement of the line of unit slope, upward or downward, relative to the line of complete dominance would reveal decreasing or increasing dominance respectively. The intercept of the line on the ordinate is then a measure of the average degree of dominance. A test for the validity of the above model is the constancy of W , -V,(HAYMAN
1954). It is obvious that the characteristics of the V,, W , distribution are disturbed if any of the listed assumptions fails.HAYMAN
(1954b, 1958) discusses what form the distribution may take under failure of these various assumptions. Of particular relevance is the effect of correlated gene distribution. He states that the V,, W , curve is convex upward with association and is convex downward with dispersion. The effect is slight and hardly alters the slope of the graph.It should be emphasized that the correlation of gene distribution is inevitable in any small sample of parental genotypes, and may be a frequent source of deviations from the expectations provided by the model in the absence of any other failure in the list of assumptions.
The purpose of this study is to investigate by computer simulation the magni- tude of effects of gene correlation arising from random sampling of parental genotypes on the slope and intercept of the (W,, V,) regression line under com- plete and unidirectional dominance. General and specific combining ability vari- ances were also estimated as outlined by GRIFFTNG (1956a) to check on bias, variances and distributions of estimates.
' Preaent address: Department of Animal Husbandry, Institute of Agriculture, St. Paul, Minnesota This research supported in part by Public Health Service Grant 1177841.
M A T E R I A L S A N D M E T H O D S
A program was written for the IBM 704.0 computer to independently make each parental locus 1/1 or 0/0 with a probability of 0.5, according to whether random number was greater than or equal to 0.5, or less than 0.5, each random number being 0 5 r.n.
<
1.The genotype values employed per locus, and genotype frequencies in the base population implied by the method of constructing parental genotypzs, are as follows:
Genotype 141 1
/o
o/o
Genotypic value (Gi)
2u = 1 u + a u = 1
0
Frequency in base population
4 2 = ?4
2q (1 - q ) = ?4?
(1 - 4)* = ?4
The total genotypic value for an individual (parent or F , ) was obtained by summing the appro-
priate values for the ten loci, G = Z Gi.
10 i=l
TO summarize, the system of simulation provided for: (i) homozygosity of parents; (ii) no
reciprocal differences or maternal effects; (iii) no epistasis; (iv) diploid segregation; (v) two alleles per locus; (vi) no correlation between loci in gene distribution in the base population from which homozygous parents were derived; (vii) random sample of parents from base popu- lation; (viii) no forces to change the gene frequency i n the homozygous parents from that of the base population. Correlation between loci in gene distribution i n homozygous parents was then the only factor that could account for deviation of the V,, W , distribution from expectation. Environmental effects were not simulated (that is genotypic values were used as phenotypic values) since to have done so would only have increased the random variance of results.
A total of 180 diallels were simulated, as follows:
No. of diallels No. of parents per diallel
60 6
50 10
50 20
20 40
For each diallel cross the genotypic means of the F , progenies were calculated and then analyzed by the regression of W , on V , (JINKS 1954; HAYMAN 1954) and by GRIFFING’S (1956a) method 3.
R E S U L T S
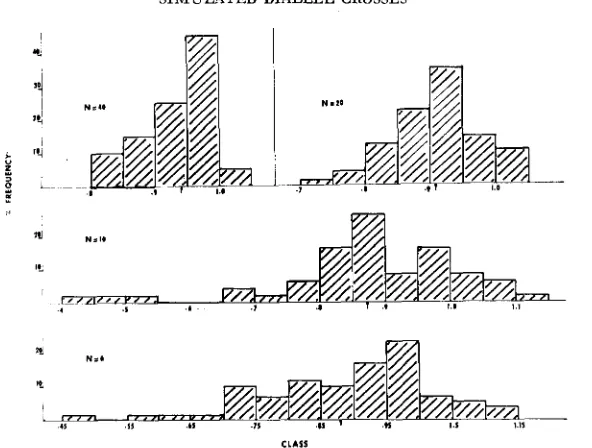
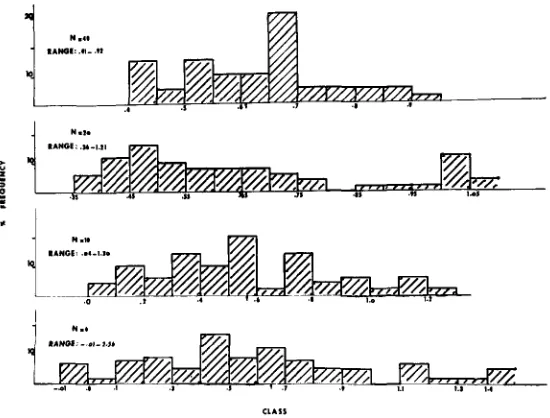
V,, W, distribution: It is clear from Figure 1 that the frequency distribution of the regression coefficients for the dialleles with vaned number of parents showed a consistent downward deviation from 1. As expected, the intensity of the deviation was greatest for the six- and ten-parent diallels and decreased with increase of number of parents. In association with the deviation from a unit slope the regression line almost always intersected the W,-axis at a point below the origin, thus giving rise to a pseudo-overdominance effect (Figure 2). The intensity of this effect was greatest in the diallel of six parents and decreased with increase in the number of parents. The means of the distributions of regressions and inter- cepts of Figures 1 and 2 are tabulated below. They clearly show the intensity of deviation from a unit slope of 1 as well as from a zero intercept at the origin.
Number of parents per diallel
6 10 20 40
S I M U L A T E D DIALLEL CROSSES 11
CLASS
FIGURE 1.-Frequency distributions of regression coefficients of W , o n V , for diallel size 6, 10, 20 and 41).
Gencral (gca) and specific combining ability (sca) variances: Bias: In the con- duct of this work, the assumptions required by GRIFFING (1956b) were met. Accordingly, the following should hold in the absence of nonallelic gene inter- action.
hyca2 = ugL (additive genetic variance)
u y C u 2 = C T ~ ? (dominance variance)
uYL and (rd2 can be written
n
E
2 qx(1-q2) [l+(l-Qql.) at]' u L L 1 = 1CLASS CLASS
TABLE 1
Observed means of general and specific combining ability variance estimates
for each set of parents
Number of parents per diallel
6 10 20 40
Mean gca .643 f ,068 ,561 f ,044. ,651 f .031 ,606 f .028 Mean sca ,573 f ,033 ,605 f ,018 ,619 f .007 .615
+
.007n
4 '(iQ l-Qi)z ai2 U i 2 i = l
where the summation is over the number of loci (COMSTOCK and ROBINSON 1948). Substituting the appropriate numerical values, U =
x,
a = 1, 4 = 1 - Q = and n = 10, ug2 and a d 2 for the base population are found to be 1.25 and0.625. The expected value of gca and sca variances is then 0.625.
The observed mean values (Table 1 ) of the distributions in Figures 3 and 4 as compared to the expected 0.625 reveals that there is no bias in the estimates. Variance of estimates: When the assumption of normality of effects is met and sampling is random, the variance of any mean square, M is
where E ( M ) is the expectation of the mean square and f, the degrees of freedom on which the mean square is based. When a n estimated variance component is derived from two independent mean squares as ( M l - M z ) / N , its variance is
It is of importance to know whether the observed standard deviation of the variance component estimates is in accord with formula 2. In calculating the standard deviation, the mean of all mean square estimates per diallel size was used for the expected mean square in formula 2.
TABLE 2
Means of the general and specific combining ability estimates, and the standard deviations around them
~~ ~
Number of parents per diallel
6 10 20 40
gca variance estimates
SIMULATED DIALLEL CROSSES 13
*
/
N."FIGURE 3-Frequency distributions of general combining ability variance estimates for 6, 10, 20 or 40 parents per diallel.
The means of the gca and sca variance estimates and the standard deviations around them, calculated from formula 2 and empirically, are presented in Table 2. There is good agreement between the standard deviations calculated by the two methods.
Distribution of estimates: The distributions of gca and sca variance estimates are shown in Figures - 3 and 4. As anticipated the variation among estimates varies inversely with number of parents, and is less for sca than for gca estimates
CLASS
within the same set of parents. This is also revealed from the respective standard deviations as tabulated under variance of estimates.
Fiducial limits: The normal approximation limits referred to by BROSS (1950)
were computed for each estimate within a set of parents. These were set at two standard deviations on either side of the estimate. Standard deviation for each estimate was computed from formula (2) by substituting the mean square value for that estimate for the expected mean square, E ( M i ) .
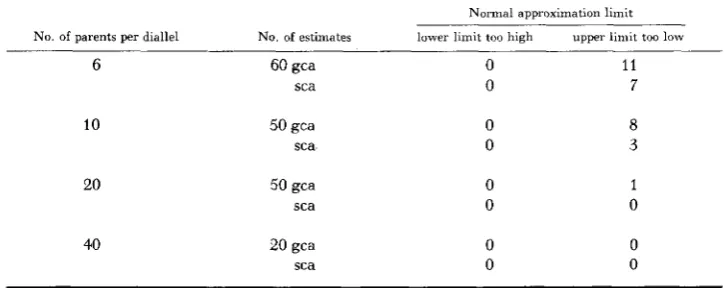
Table 3 clearly reveals that the distributions of gca and sca variance estimates are skewed to the right when the number of degrees of freedom for estimates is small. It is then that these distributions are similar to the chi square distributions of the mean squares from which the estimates were derived. Greater symmetry in distribution is obtained with more degrees of freedom until the fit is normal. This agrees with the results of COMSTOCK et
al.
(1951) in corn.Fiducial limits can be computed, as suggested by BROSS (1950) for variance component estimates where the mean squares are based on few degrees of free- dom. Such limits were computed for the gca variance estimates when the number of parents was six. Results in terms of the number of times the limits failed to include the mean of the estimates are:
No. of parents per diallel No. of estimates Lower limit too high Upper limit too low
6 60 2 2
Whereas about 19% of the estimates failed to include the mean (Table 3 ) under the normal approximation limit, only 5% did so under 90% Bross fiducial limits. The agreement in the latter case is reasonable. If, in computing the normal approximation limits, the standard deviation is used (as computed from formula 2 by substituting the average of all mean squares for the expected mean square), then the gca and sca variance estimates for diallels 6 and 10 of Table 3
agree with the limits.
TABLE 3
Failures of normal approximation limits about individual estimvrtes
to include the means of the estimates
Normal approximation limit
No. of parents per diallel No. of estimates lower limit too high upper limit too low
6
10
20
40
S I M U L A T E D D I A L L E L CROSSES 15
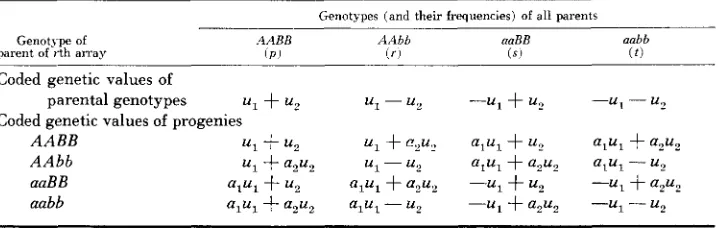
TABLE 4
Genoiype of parent of the rth array plus the genotypes and frequencies of all parents in thai
array along with their progenies and expected genetic ualues
Genotypes (and their frequencies) of all parents
Genotype of
parent of rth array AABB ( P ,
Coded genetic values of
Coded genetic values of progenies parental genotypes U1
+
U?AABB U1
+
U 2AAbb u1
+
aqu2aaBB aabb
Contribution of gene correlation to V, and W,: For two loci, and following the method of COMSTOCK et al. (1952)
,
table 4 gives the genotype of the parent of the rth array and the genotypes and frequencies of all parents in that array, along with their progenies and expected genetic values. Values for V , andW ,
for arrays associated with parents of each of the four genotypes can be derived from Table 4. For example, the contribution of these two loci to V , for the array associated with an A A b b parent is[p-r - (p+r)'] u12
+
[ (s+t - (s+t)' 3
a12 ul*+
[p+s - (p+s)'] aZ2 U''+
[ (r+t) - (r+t)'] u2'+
2 [ p - (p+r) ( p + s ) ] ula2u2 - 2 [ r - (p+r) ( r + t ) ]uluz
+
2 [s - (p+s) ( s + t ) ] alula2uz - 2 [ t-
(s+t) ( r + t ) ] alu1u2 - 2 [ (p+r) (s+t) alul'+
2 ( p + s ) (r+t) a2u,'].Note t h a t p + r + s + t = l , p + r = q l , p + r = q , , s + t = l - ~ q l , a n d s + t = Substituting in the above variance-expression and simplifying we get
1-42.
ql(l--ql) (u1-alu1)2
+
q2(1-qz) (u2+a2u2)'+
g(pt-rs) (ul-alul) (u2+a2uz)For the present genetic model, u1 = u2 = alul = a2uz =
1/.
Therefore
Following the same procedure for all four parental genotypes one obtains the results of Table
5.
From the above results it is evident that disregarding the correlated gene distri- V , ( A A b b ) = q2 ( 1-4').
TABLE 5
Contribution of corre1a;ed gene distribution to V, and W, under complete dom.'nance
bution effect in the term (pt-rs)
,
the contributions to W , and V , by each parental genotype are equal according to expectation.DISCUSSION
Bias
in the
regression of W, o n V,: Table5
shows that for a pair of loci the contribution of correlated gene distribution to W , is (r+s+2t) (pt-rs) and toV,
is 2t(pt-rs).It
can be shown that the expectations of r(pt-rs) and s(pt-rs)are negative, and that of t(pt-rs) and p(pt-rs) are positive. The proof for
r(pt-rs) follows. (The author is indebted to
DR.
R. E. COMSTOCK for his help in this proof.)The probability distribution of AABB, AAbb, aaBB, aabb ( k , , k,, k,, k 4 ) under random sampling from a population follows a multinomial distribution
where
k,
+
k,+
k,
+
k,
=N
= number of parents, and P,, P,, P,, P, = proba- bilities corresponding to AABB, AAbb, d B , aabb.E [ r ( p t - r s ) ] = E ( p t r ) - E ( r 2 s )
Let p = k , / N , r = k , / N , s = k , / N , t k , / N .
Let p =
k , / N ,
r =k , / N ,
s = k , / N , t = k , / N .Then E ( p t r ) = 2 P
( k l ,
k,,k,,
k,) ~ki
kz k,N 3
From that it can be shown that
(N-1) ( N - 2 )
N2
E
( p t r ) = PI P,P,
-
(N-1) (N- 2)
N2
+
P,2 P, E ( r Z s ) = P, P,-
N-IN2
N-1
Therefore, E ( p t r ) - E ( r Z s ) = -
[
P, P3-p-
]
.
Following the same procedure it can be shown that
N-'
7
E
[
t(pt-rs)]
= E[
p(pt-rs)]=
[ P I p ,7
- .( N - 1 ) ( N 2 )
.
SIMULATED DIALLEL CROSSES
17
(N-I) m(m-1)
N2 2
For M loci,
E
[ V - W ] = 2P,
P,The consequence of this, with reference to Table 5, is the V , is almost always larger than W,. Another thing to consider is that the difference between V , and
W , is more for large than for small values. This is due to the fact that larger
V,, W , values are sustained by more recessive genes which contribute to the
( i t - r s ) effect that causes this difference.
If V , is larger than W , in almost all cases and the difference between them is
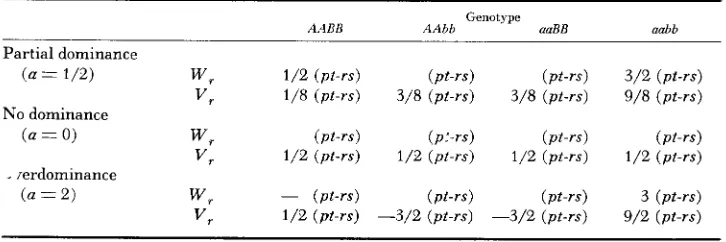
proportional to their values, then a regression of W , on V , is in most cases below a unit slope. The results have shown that this is so. It is suggested that the bias downward in deviation from unit slope and from a zero intercept is even more intense with overdominance and less so with partial dominance. This is revealed in Table 6 and obtained by substituting a=%, 2 in the general V r and W ,
expressions. This bias is also less when dominance is not all in one direction. In the case of no dominance ( a = 0 ) , W , is always twice V r and all the (V,,
W , ) points have the same value as is expected under noncorrelated gene distri-
bution. This was, also, borne out by actual data which were not presented in Judging from the simulation results, correlated gene distribution seems to cause serious disturbances in the V,, W , regression line. These are of frequent occurrence especially in diallels of the size often used by plant breeders. Similar deviations in the slope of the regression line have been reported to be due to non- allelic interactions (JINKS 1954, 1955; HAYMAN 1957; JOHNSON 1963). The evi- dence, however, can never be definitive. One can never know whether deviation from expectations in the (W,., V,) graph is due to correlated gene distribution or to another deviation from assumptions (like epistasis) unless number of parents is much larger than practical. It is not uncommon, also, to get negative
W , values (Figure 5 ) , which strongly suggests to the plant breeder that an inter-
action exists in some of the crosses. The situation becomes even worse when one considers that the disturbances due to gene correlations are exaggerated with increase in the number of loci controlling the character.
RESULTS.
TABLE 6
Contribution of correlated genz distribution to V,. and W, under different degrees of dominance
Genotype
AABB AAbb aaBB aabb
Partial dominance
( a = 1/2) Wr 1/2 ( p t - r s ) (Pt-rs) ( p t - r s ) 3/2 ( p t - r s )
vi-
1/8 ( p t - r s ) 3/8 ( p t - r s ) 3/8 ( p t - r s ) 9/8 ( p t - r s ) No dominance( a = 0) Wr ( p t - r s ) ( p : - r s ) (Pt-rs) ( p t - r s )
vr
1/2 ( p t - r s ) 1/2 ( p t - r s ) 1/2 ( p t - r s ) 1/2 ( p t - r s )( a = 2)
w,
- ( p t - r s ) ( p t - r s ) ( p t - r s ) 3 ( p t - r s )V r 1/2 ( p t - r s ) -3/2 (pt-rs) -3/2 ( p t - r s ) 9/2 ( p t - r s )
The position of the point (V,., W,) on the regression line denotes the relative proportion of dominant and recessive genes in the rth parent. Parents which are recessive correspond to points at the upper end of the line and those that are dominant correspond to points at the lower end of the line. In cases of deviations from a unit slope the ability to estimate the relative proportions of dominant and recessive genes in the parents is reduced owing to the overlap produced in the positions of the V,, W , points on the regression line (Figure
5 ) .
The intercept( W ,
value when V , = 0) is, also, predominantly negative indicating true over- dominance when in fact it is pseudo-overdominance.The results of the gca and sca variance estimates show that one can with fairly low accuracy make inferences about the base population from a diallel of small size. It must be noted that the standard deviations around the means of the gca and sca variance estimates are minimized, since there was no inclusion of en- vironmental variation in the model. Hence, the picture with regard to the accur-
5
1
SIMULATED DIALLEL CROSSES 19
acy of the gca and sca variance estimates is even less favorable than the results suggest.
While this paper was being prepared for publication, HILL (1964) published a paper on the effects of correlated gene distributions in the analysis of diallel crosses. His data were limited to one Drosophila experiment in which he adjusted the real diallel table by adding and subtracting whole arrays in the hope of simulating coupling and repulsion effects. HILL concluded that coupling pro- duced iin upward curvature on the W,./V, graph while dispersion had no effect.
His results are not in agreement with my results. However, adding to or sub- tracting from data in a diallel table is by no means a n adequate representation of the true association and dispersion effects, hence any results arrived at cannot be taken to be representative of the situation at large.
The author is indebted to DR. A. S. FRASER for providing the facilities and encouragement in research. DR. R. E. COMSTOCK for his helpful discussions and suggestions in evaluating the re- sults and for helpful criticism of the manuscript, and DR. P. HANSCHE for the use of his simula- tion program with modifications to perform the crosses and compute genotypic mean values of the F, progenies and for helpful discussions in programming.
S U M M A R Y
Computer simulation of diallel crosses was carried out to investigate (1) the effect of correlated gene distribution due to small samples on the slope of the W,/V, graph, and ( 2 ) the variances of the general and specific combining ability parameter estimates arising from differences among samples of parents. The results showed that correlated gene distribution under complete dominance caused serious deviations in the slope of the W,., V , regression line and the inter- cept ( W , value when V , = 0 ) . As a result, the intercept was predominantly below the origin (simulating overdominance) and the regression line almost consistently had a slope less than one. These deviations are sufficiently frequent in occurrence to throw doubt on any inference from diallel cross data.
General and specific combining ability variance estimates were unbiased, but were subjected to large sampling errors when they were computed from mean squares based on few degrees of freedom. This caused a nonsymmetry in the form of the normal distribution. With more degrees of freedom, however, greater symmetry in distribution, as well as reduced sampling errors, was obtained. The observed standard deviations of the estimates agreed well with values obtained from mean values of pertinent mean squares.
LITERATURE CITED
BROSS, I.. 1950
COMSTOCK, R. E., and H. F. ROBINSON, 1948
Fiducial intervals for variance components. Biometrics 6: 136-144.
The components of genetic variance in populations. Biometrics 4: 254-266. - 1951 Consistency of estimates of variance components. Biometrics 7: 75-82. - 1952 Estimation of average dominance of genes. pp. 494-516.
Hetrrosis. Edited by J. W. GOWEN. Iowa State College Press, Ames.
crossing systems. Australian J. Biol. Sci. 9: 463-493. - 1956b A generalized treat- ment of the use of diallel crosses in quantitative inheritance. Heredity 10: 31-50.
The theory and analysis of diallel crosses. Genetics 39: 789-809. ~
1957 Interaction, heterosis and diallel crosses. Genetics 42: 336-355 - 1958 The theory and analysis of diallel crosses. 11. Genetics 43 : 63-85.
HILL, J., 1964 Effects of correlated gene distributions in the analysis of diallel crosses. Heredity
19: 27-46.
JINKS, J. L., 1954 The analysis of heritable variation in a diallel cross of Nicotiana rustica varieties. Genetics 39: 767-788. - 1955 A survey of the genetical basis of heterosis in a variety of diallel crosses. Heredity 9: 223-238.
The analysis of diallel crosses. Maize Genet. Coop. News Letter 27: 48-54.
Applications of the diallel-cross techniques to plant breeding. Sratistical Genetics and Plant Breeding. Natl. Acad. Sci.-Natl. Res. Council Publ. 982: 561-570. HAYMAN, B. I., 1954
JINKS, J. L., and B. I. HAYMAN, 1953