Jon-Paul Maria.)
Physical vapor deposition of thin film thermites allow for a clean avenue for probing fundamental properties of nanoenergetic materials that prove difficult for traditional powder processing. Precise control over diffusion dimensions, microstructure, and total amount of material are able to be realized with this fabrication technique and the testing of such materials provide valuable insight into how oxidation occurs.
This thesis provides several examples of how existing PVD techniques can be coupled with thermite constituents to further the energetic community’s understanding of how oxidation occurs in the solid state with the variation of geometric and chemical alterations. The goal of these investigations was to elucidate which material properties and mechanisms drive exothermic activity.
The thermite thin films of Al/CuO, Zr/CuO, and Mg/Cuo with varied reducing metal constituents were tested under slow heating conditions. The trend of the metal variation demonstrated the importance of terminal oxide diffusion properties in either impeding or enhancing oxygen exchange. When the reducing metal forms a terminal oxide with limited oxygen diffusivity, exothermicity requires elevated activation energies to commence self- sustaining reaction. In addition to the effects of chemical variation, bilayer thicknesses were varied and found to decrease exothermic peak temperatures similar to the trends found in intermetallic thin film energetics and powder energetic materials.
The thin film thermites were also subjected to extreme initiation methods via laser driven flyer plate impact ignition and high heating rate heat treatment (105 K/s). General insight into nano thermite behavior at environments characteristic of applications was sought, and similar trends discovered among slow vs rapid testing. Decreasing reaction dimensions yielded higher reactivity and diffusion barrier properties role in impacting exothermic behavior persist to into the microsecond regime.
by
Edward Joseph Mily Jr.
A dissertation submitted to the Graduate Faculty of North Carolina State University
in partial fulfillment of the requirements for the Degree of
Doctor of Philosophy
Materials Science and Engineering
Raleigh, North Carolina 2015
APPROVED BY:
_______________________________ ______________________________
Dr. Michael Dickey Dr. Don Brenner
Professor of Chemical Engineering Professor of Materials Science
________________________________ ________________________________ Dr. Doug Irving Dr. Elizabeth Dickey
Professor of Materials Science Professor of Materials Science
________________________________ Dr. Jon-Paul Maria
DEDICATION
BIOGRAPHY
Edward Mily Junior comes from the central Pennsylvanian homestead near Harrisburg Pennsylvania. He is the youngest of three and pursued an education in
engineering early on. His first place science fair experiment in elementary school fostered his interest in the sciences very early in his education. In middle school he participated in the Technology Students Association (TSA) which shaped his interests greatly and pointed them towards the technological fields. This interest in the sciences shaped his high school
curriculum to accentuate and further develop his mathematical and spatial reasoning skills which ultimately led him to pursue education in engineering. He enrolled at the Pennsylvania State University to study materials science and engineering with a specialty polymers
ACKNOWLEDGMENTS
Research is not done in a vacuum and the work described in this dissertation is no exception. First and foremost, I would like to thank my advisor Dr. Jon-Paul Maria for giving me the opportunity to become a part of a great research group. Dr. Maria’s support
throughout my graduate education was invaluable professionally and personally. Without his help and leadership my presentation skills would be bereft of refinement, my experimental technique not as rigorous, and ultimately none of this work would be possible. His uncanny ability to distill problems to their root cause is efficient, effective and allows for a clear path to the solution. I am grateful for the experiences from Pig Picking preparations to late night conference preparations and I thank you.
The collaborative efforts between the 3rd and 2nd floor research groups of Research Building 1 also assisted me greatly on my path through graduate school. General
experimentation advice from Dr. Zlatko Sitar and Dr. Ramón Collazo was very helpful. Their allowance of my access to the UHV system and the XPS analysis is greatly appreciated. The specific rigorous training I received on XPS apparatus operation was graciously done by Christer Akoula was an great help. In addition the assistance I received from the Bryan brothers in all things from experimental procedure to car radiator
replacement was highly appreciated. Pramod Reddy also shouldered my frustrations with XPS data collection and his willingness to be a sounding board did not go unnoticed. A special thanks to Dr. Brenner and Dr. Irving for their advice and perspective from a computational point of view with many valuable insights that would have most assuredly gone unnoticed without their direction. Also, credit must be given to Shijing Lu for his brilliant manipulation of thermodynamic equations to assist our understanding of activation energy calculation through his modeling.
Thanks must also be given to Dr. Elizabeth Dickey for her help in my undergraduate and graduate understanding of material characterization. Your classes and instruction were crucial in my development as a capable material scientist.
Dr. Michael Dickey, I appreciate your help and advisement on my final Thesis committee, thank you .
The work on thermite impact behavior would be nonexistent if not for the help of William Shaw and Dr. Dana Dlott from the University of Illinois. Will’s persistent attention to detail and optimism on the testing of the thin films was exceptional. His patience when explaining shock physics to me and answering my myriad of questions was greatly appreciated.
Dr. Zachariah and Garth Egan were integral in the understanding of the thin film thermite behavior at fast heating rates. Their willingness to work with us on sample preparation and insight into the energetics community were exceptionally helpful.
TABLE OF CONTENTS
LIST OF TABLES ... x
LIST OF FIGURES ... xi
1. Energetics History ... 1
1.1 Early Humans ... 1
1.2 Greek Fire ... 4
1.3 Gunpowder ... 5
1.4 A New Class of Materials ... 6
1.4.1 Dynamite ... 6
1.5 High Explosives ... 9
1.7 Thermite ... 10
1.7.1 Metallic addition to traditional energetics ... 11
1.8 Nano-sized Aluminum ... 12
2. Nano Energetic Materials ... 14
2.1 Nano Powder Mixing ... 16
2.2 Sol Gel Processing of Nano Energetics ... 17
2.2.1 Sol-Gel Chemistry ... 17
2.2.2 Sol-Gel Fabrication of Energetic Materials ... 20
2.3 Arrested Reactive Milling ... 21
2.4 Physical Vapor Deposition ... 22
3. The Role of Terminal Oxide Structure and Properties in Nanothermite reactions ... 27
3.1 Abstract ... 27
3.2 Introduction ... 28
3.3 Experimental Procedure ... 32
3.3.1 Film Deposition ... 32
3.3.2 TEM Sample Preperation ... 32
3.3.3 Annealing Procedure ... 33
3.3.4 X-ray Analysis ... 33
3.3.4.1 Deposition Rate Determination ... 33
3.3.5 Thermal Analysis ... 34
3.4 Results and Discussion ... 34
3.5 Conclusion ... 40
3.6 Aknowledgements ... 40
4. Effect of Thin Film Bilayer Spacing on Thermite Exothermicity ... 41
4.1 Abstract ... 41
4.2 Introduction ... 41
4.3 Experimental ... 42
4.4 Reults and Discussion ... 44
4.4.1 Al/CuO System ... 44
4.4.2 Zr/CuO System ... 49
4.5 Conclusion ... 42
5. Interfacial Anaylsis of Multilayered Nanothermite ... 54
5.1 Interfacial Analysis Background ... 54
5.2 Experimental Procedure ... 56
5.2.1 Substrate Preperation ... 56
5.2.2 X-ray Photoelectron Analysis ... 57
5.3 Results and Discussion ... 57
5.3.1 Copper Oxide Phase Identification ... 57
5.3.2 Aluminum Deposition on CuO ... 58
5.3.3 Zirconium Depostion on CuO ... 63
5.4 Conclusion ... 65
6. Nano-Kirkendall Diffusion ... 66
6.1 Diffusion Monitoring at the Nano Scale ... 66
6.2 Diffusion Marker Deposition ... 70
6.2.1 Nano Particle Deposition ... 70
6.2.2 Electron Beam Deposited Platinum Diffusion Markers ... 76
6.2.2.1 Sample Tracking ... 78
6.3 Pt Deposition Results and Discussion ... 87
6.3.1 Pt Deposition via Focused Ion Beam and Focused Electron Beam ... 96
7. Shock Impact Behavior of Thin Film Thermite ... 105
7.1 Introduction to Impact Testing ... 105
7.1.2 Shock Waves ... 106
7.1.3 Shock Wave Generation ... 107
7.1.4 Laser Driven Flyer Plates ... 107
7.1.5 Composite Energetic High Speed Testing ... 108
7.2 Impact Behavior of Thin Film Thermite ... 109
7.2.1 Variation of Interface Density in Thin Film Thermites ... 111
7.2.2 Variation of Reducing Metal on Thin Film Thermites ... 118
7.3 Conclusion ... 120
8. Rapid Annealing of Thin Film Thermite and the Effeects of Geometric spacing ... 122
8.1 Rapid Annealing Introduction ... 122
8.2 Thin Film Thermite Deposition on Thin Platinum Wires ... 123
8.3 High Speed Annealing ... 127
8.3 Ignition Temperature Modeling ... 136
8.5 Conclusion ... 139
9. Eutectic Melting Effect on Energy Release ... 140
9.1 Introduction ... 140
9.2 Intermetallic Phase Identificaion ... 144
9.2.1 Hot Stage XRD... 144
9.2.2 Auger Electron Spectroscopy ... 118
9.3 Eutectic Thermite Testing... 149
9.4 Conclusion ... 154
REFERENCES ... 155
APPENDICES ... 164
Appendix A- XPS ... 165
I. Aluminum Aging Study ... 165
II. CuO Surface Roughness Study ... 169
III. XRR Confirmation of Thin Film Thickness at the interface of Zr/CuO ... 179
LIST OF TABLES
Table 2.1- Comparison of energetic materials properties ... 14
Table 3.1- Heat of Formation, Oxygen Diffusivity, and Pilling- Bedworth Ratio for each system studied ... 31
Table 4.1- Thin Film Thermite Parameters ... 43
Table 6.1- Input parameters for E-Beam deposited Pt ... 87
Table 8.1- High Speed Ignition Temperature Data ... 129
Table 9.1- Mg/CuO thin film thermite deposition parameters ... 150
LIST OF FIGURES
Figure 1.1- Chemical structure of nitroglycerin ... 7
Figure 2.1- Organic Energetic vs. Inorganic order of reaction distance ... 15
Figure 2.2- Hydrolysis and condensation reactions that occur during sol-gel synthesis ... 18
Figure 2.3- Sol-Gel Synthesis solvent extraction schematic for an Aerogel and Xerogel ... 20
Figure 2.4- Typical microstructure obtained by ARM MIC processing ... 22
Figure 2.5- TEM micrograph of an Al/CuO thermite thin film, with total thickness 1080nm ... 24
Figure 2.6- Dual magnetron sputtering architecture used to fabricate thermite nanostructures ... 25
Figure 3.1- a) Idealized schematic of oxygen exchange reactions at a) the original MO | M interface and b) showing the accumulation of an intermediate barrier layer that accumulates with time ... 30
Figure 3.2- TEM image of Zr-CuO multilayer with 3 total bi-layers ... 35
Figure 3.3- X-ray diffraction patterns for (a) Al-CuO, (b) Mg-CuO, and (c) Zr-CuO reactive nanolaminates exposed to high temperature anneals. The diffraction angles for Cu metal are highlighted for clarity ... 36
Figure. 3.5: Exothermic onset temperature vs terminal oxide diffusivity [cm2/sec] at 500 °C .. 39
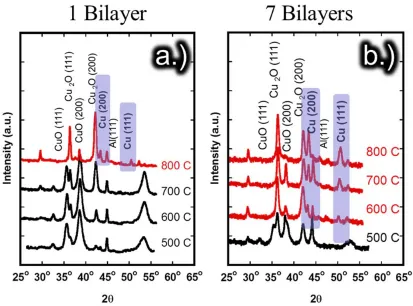
Figure 4.1- XRD Spectra for the Al/CuO system stepwise anneal phase identification for the
a.) 1 bilayer Al/CuO sample and the b.) 7 bilayer Al/CuO sample ... 46
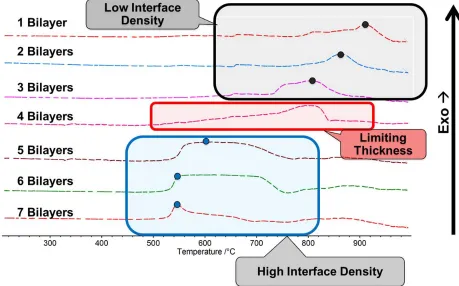
Figure 4.2- DSC data from the Al/CuO thin film samples testing the exothermic behavior of
the samples as a function of the number of bilayers ... 47
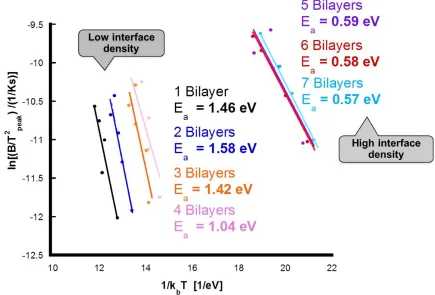
Figure 4.3- Effective activation energy Kissinger analysis plot of the Al/CuO thin film
system ... 48
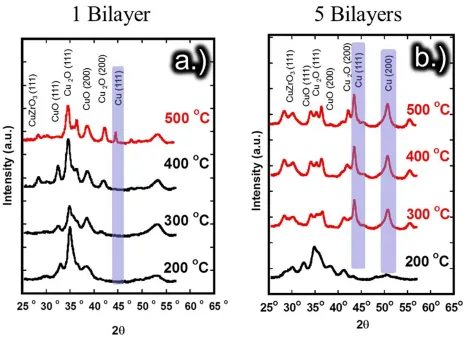
Figure 4.4- XRD Spectra for the Zr/CuO system stepwise anneal phase identification for the
a.) 1 bilayer Zr/CuO sample and the b.) 5 bilayer Zr/CuO sample ... 50
Figure 4.5- DSC data from the Zr/CuO thin film samples testing the exothermic behavior of
the samples as a function of the number of bilayers ... 51
Figure 4.6- Effective activation energy Kissinger analysis plot of the Zr/CuO thin film
system ... 52
Figure 5.1- Visual representation of photo-electrons from each each sample constituent ... 56
Figure 5.2- Cu 2p orbital energy range, showing the affects of aluminum monolayer titration
on the copper oxidation state ... 59
Figure 5.3- Al 2p binding energy range showing a singular peak at 74.7eV corresponding the
sample that iteratively deposited 1 ML of aluminum at a time. The peak shows aluminum
coordinated with oxygen ... 60
Figure 5.4- Al 2p binding enegy range comparing samples with 11ML of aluminum
deposited via mono-layer by monolayer and depossition all at once ... 60
Figure 5.5- Visual representation of metal island growth on the CuO surface, where an
Figure 5.6- Al 2p energy range for samples with different thicknesses of Al deposited on the
surface of CuO. The corresponding layer where metallic aluminum appears is at 7ML of
aluminum or ~2.1 nm ... 63
Figure 5.7- Zr 2p energy range for samples with different thicknesses of Zr deposited on the surface of CuO. The corresponding layer where metallic aluminum appears is at 10ML of aluminum or ~3.2 nm ... 65
Figure 6.1- Self diffusion of metals and oxygen through common oxides ... 67
Figure 6.2- Original Kirkendall diffusion experiment of a brass ingot encased in a copper coating with Molybdenum wires at the surface for diffusion tracking ... 68
Figure 6.3- Schematic of the idealized Nano-Kirkendall Experiment. M’ and MO are the original metal and metal oxide respectively. M and M’Ox are the terminal metal and terminal oxide respectively ... 69
Figure 6.4- Au nanoparticles deposited on CuO at the lowest concentrations ... 73
Figure 6.5- Au nanoparticles deposited on CuO at the medium concentration ... 73
Figure 6.6- Au nanoparticles deposited on CuO at the highest concentration ... 74
Figure 6.7- AFM micrograph of nano-gold particles that had been cast onto a copper oxide thin film from a toluene solution in an attempt to decrease particle size and maintain particle spacing ... 75
Figure 6.8a- Diagram of Pt deposition via e-beam deposition ... 77
Figure 6.8b- Diagram of Pt deposition via e-beam deposition ... 77
Figure 6.9- SEM Macroscopic view of asymetric milled out location aids ... 79
Figure 6.10- SEM micrograph view of asymetric milled out location aids with Pt diffusion markers located next to them ... 80
Figure 6.12- SEM micrograph of CuO film scribed for purposes of sample
location identification ... 83
Figure 6.13- SEM micrograph of Pt bars deposited near the scribed location on CuO ... 84 Figure 6.14- SEM Micrograph of Pt Identification markers flanking diffusion
markers on CuO ... 85
Figure 6.15- SEM micrograph of e-beam deposited Pt bars on an undamaged
CuO surface ... 86
Figures 6.16- a.) Schematic of Pt bars on CuO surface with orientation b.) AFM image of the
lateral and horizontal dimensions of deposited Pt barsc.) AFM height retrace of the Pt bars overall dimension in the Z direction ... 88
Figure 6.17- TEM cross-section of Zr/CuO interface with Pt diffusion markers ... 91 Figure 6.18- TEM cross-section of Zr/CuO interface with a bright
Pt deposit 20nm in width ... 92
Figure 6.19- TEM cross-section of Cr/CuO interface with Pt bars
between Cr and CuO layers ... 93
Figure 6.20- TEM cross-section of Cr/CuO interface with Pt deposit a.) after deposition b.)
after a 1 year anneal at 25oC. ... 94
Figure 6.21- TEM cross-section of annealed Zr/CuO sample devoid Pt markers and of the
CuO thin film layer ... 94
Figure 6.22- Infographic of conductive AFM experiment to check the quality
of the Pt deposition ... 97
Figure 6.23- a.)AFM image of E-beam deposited Pt wires at 5KeV and 13pA at the junction
of sputtered Pt and silica surface b.) Conductive AFM trace over the deposited Pt bars on top of sputter coated Pt c.) Conductive AFM trace over Pt wires on the silica surface ... 98-99
Figure 6.24- a.) SEM Image of Ion beam deposited Pt Wires at 30KV and 0.5nA at the
junction of the Sputtered Pt and Silica surfaces b.) Conductive AFM trace over the deposited Pt bars on top of sputter coated Pt c.) Conductive AFM trace over Pt wires on the silica
Figure 7.1- Schematic showing the principles of the Nd:YAG laser driven flyer plate
apparatus with an Al flyer plate incident on a thin film thermite sample ... 111
Figure 7.2- Organic Masked thermite nanolaminate impact sample ... 112 Figure 7.3- Baseline emission comparison from a Zr/CuO thermite, Zr thin film, and a CuO
thin film. Emission is present for the bare Zr film but at 10% of the intensity of thermite
couple. ... 113
Figure 7.5- Graphical depiction of the Zr/CuO impact samples with the exothermic peak
temperature obtained for each system under slow thermal analysis via differential scanning calorimetry. ... 115
Figure7.6- Intensity vs time data where each trace represents the optical emission spectrum
of increasing flyer plate velocities for a.) Zr/CuO 1bilayer sample, b.) Zr/CuO 2 bilayer
sample, and c.) Zr/CuO 3 bilayer sample ... 115
Figure 7.7- Pictograph of a visual representation of more reaction points or hot spots for
laminates with increased number of bilayers ... 116
Figure 7.8 - Plot of threshold velocity vs. the number of bilayers in the Zr/CuO samples. ... 117 Figure 7.9- Exothermic peak temperature from Differential scanning calorimetric studies vs.
the number of bilayers in the Zr/CuO thermite system ... 117
Figure 7.10- Intensity vs time data where each trace represents the optical emission spectrum
of increasing flyer plate velocities for a.) Al/CuO 3 bilayer sample, b.) Mg/CuO 3 bilayer
sample, and c.) Zr/CuO 3 bilayer sample ... 119
Figure 7.11 - Impact velocity required for thermite reaction as a function of the youngs
modulus of each systems respective terminal oxide ... 120
Figure 8.1- Schematic diagram of the dual beam magnetron system with the sample rotation
axis. ... 124
Figure 8.2- 3-D printed Pt wires substrate holder to allow for minimal sample shadowing
and rotation perpendicular about the axis normal to the deposition source. ... 125
Figure 8.3- Temperature Jump (T-Jump) Pt sample apparatus. This configuration allows for
Figure 8.4- Cross-section SEM micrograph of a Pt wire with a conformal thermite
nanolaminate coating. ... 127
Figure 8.5- Cross-section SEM micrograph of Pt wire with conformal Al/CuO nanolaminate
coating. A columnar morphology is clearly seen in the thin film multilayers. ... 127
Figure 8.6- Cross-section SEM micrographs of Al/CuO nanolaminate with a.) 1 bilayer b.) 3
bilayers, and c.) 6 bilayers ... 127
Figure 8.7- In situ high speed temperature jump frames for the 3, 6, and 10 bilayer samples
during the temperature jump. The scale is the same for each sample, where the bright wire portion of the 3 bilayer sample is 10 mm. ... 128
Figure 8.8- Time of flight mass spectroscopy data for a.) three and b.) six bilayer samples.
The temperatures of ignition ascertained by the optical high speed video are represented by the vertical dashed line. ... 131
Figure 8.9 – Pressure-temperature diagram for CuxOy ... 132 Figure 8.10- Differential scanning calorimetry of a 400nm CuO thin film on sapphire at
5K/min ramp rate in Argon. ... 133
Figure 8.11- X-ray diffraction data for 400nm CuO film at 25°C, 600°C, 850°C and 1200°C
demonstrate the transition of CuO to Cu2O after 800°C. ... 134
Figure 8.12- Still frame from high speed photography showing the collection geometry of
sample products. ... 134
Figure 8.13- SEM micrograph a.) & b.) of post reaction products collected after sample
ejection post ignition from the 10 bilayer Al/CuO nanolaminate coated Pt wire. ... 136
Figure 8.14- Ignition temperatures computed vs. predicted as a function of number of
bilayers. The best fit (R2 coefficient of 0.94) was found to occur with E =20 kJ/mol and
D =7.1x10⁻¹³ m2/s. ... 138
Figure 9.1- Differential scanning calorimetry of Al/CuO thin film thermite samples with
varying number of bilayers ... 142
Figure 9.2- Phase Diagram of Al-Cu displaying the aluminum rich portion where the low
Figure 9.3- XRD of Al/CuO 6 bilayer film at different temperatures indicating the presence
of copper metal. No evidence of any intermetallic is seen. ... 145
Figure 9.4- Auger electron kinetic energy of the Cu LMM transition plotted against the
binding energy of the Cu 2p 3/2 for known phases of copper and oxygen and experimentally obtained data. ... 148
Figure 9.5- EDS map of Zr/CuO interface showing a Cu rich region just below the
overlapping layer of zirconium and oxygen. . ... 149
Figure 9.6- Mg-Cu Phase diagram ... 150 Figure 9.7- XRD of the 8 bilayer Mg/CuO thin film with evidence of intermetallic formation152 Figure 9.8 - DSC of Mg/ CuO multilayered thermite displaying the eutectic influence on the
exothermic behavior... 153
Figure A.1- Schematic of the XPS chamber used to complete the surface analysis ... 155 Figure A.2- Aluminum 2p photoelectron binding energy spectra taken during the first 126
hours after deposition ... 158
Figure A.3 - Aluminum 2p photoelectron binding energy spectra taken incrementally up to
15 days after deposition ... 158
Figures A.4 - AFM map of a.) Uncleaned silicon with a 2.1 nm roughness, b.) a cleaned
silicon wafer with a 100pm roughness... 162
Figure A.5 - AFM of CuO 10nm on silicon with a roughness of 100pm ... 163 Figure A.6 - AFM of CuO 20nm on silicon with a roughness of 316pm ... 163 Figure A.7- AFM of CuO 30nm on silicon with a roughness of 520pm displaying the
transition from layer by layer growth to island growth to coalescence. ... 164
Figure A.8- AFM of a.) CuO 30nm on silicon with a b.) line height retrace to display the
height of the growing island. ... 165
Figure A.11- AFM of CuO 200nm with a roughness of 4.5nm ... 167
Figure A.12- AFM of CuO 300nm with a roughness of 4.8nm ... 167
Figure A.13- AFM of 2um of CuO with a roughness of 11.35nm ... 168
Figure A.14- XRR data from the Zr/CuO interface with a modeled fit to account for a 3nm interfacial layer. ... 170
Figure B.1- SEM micrograph of a milled location aid next to Pt bars deposited at the interface of ... 173
Figure B.2- SEM snapshot of milling out a TEM sample ... 173
Figure B.3- SEM micrograph of the side view of a TEM sample attached to a Molybdenum grid ... 174
Figure B.4- SEM micrograph of the top view of the TEM sample ... 174
Figure B.5- SEM micrograph of the side view of the TEM sample after thinning. ... 175
Figure B.6- SEM micrograph of the top view of the thinned TEM sample ... 175
1. Energetics
History
1.1 Early Humans
In order to understand how nano-thermite fits in with the greater picture of human interaction with energetic materials it is helpful to get a broader view of how humankind has interacted with the release of energy. History has shown our relationship with energy closely revolves around oxidation. Current prevailing wisdom among archaeologists and
anthropologists suggest that humans first started using and interacting with fire around 1.8 million years ago. It is around this time that modern humans biologically first started appearing with major differences from their apelike ancestors. Much controversy and investigation has surrounded the beginnings of human history and the use of fire. The first question to be addressed is what made our ancestors leave the relative safety and comfort of a forested habitat. It has been suggested the motivating factor for the leaving trees and
becoming bipedal was the search for more rich protein sources in the form of meat. This implies that the reason why human beings left the trees was because they were predatory in nature. However this theory leaves much to be desired because modern chimpanzees do in fact behave omnivorously when the opportunity presents itself and yet their main habitat is still a canopied forest[1]. Chimpanzees have been known to kill other species of smaller monkeys and mammals. So this begs the question why did our ancestors change and the chimpanzees did not? An emerging and promising theory is that our ancestors were the first to realize and utilize the control of fire for their benefit and this controlled usage of
combustion is what ultimately separated us from our ape ancestors.
Serengeti of Africa where brushfires are commonly started by lightning, the plains animals seem relatively calm in close proximity to the burning grass [1, 2]. Our ancestors originating in the African continent would have been exposed to these two types of fire yielding a very basic understanding of what types of fire were malignant and what situations were harmless. It is then conceivable that there are certain situations where fear of a burning area would be devoid in our ancestor’s mind. Lack of fear however does not motivate one to approach or attempt to corral a burning environment. A catalytic factor must have been the reason for the ultimate taming used fire. A very reasonable explanation for this comes from the perspective of a hungry apelike animal looking for food. Our earliest ancestors differed very little from chimpanzees. If one was to look at the diet of chimpanzees it would be found that they consume a large portion of fruits, nuts, vegetables, and sources high in protein. The protein that they search for is one that requires the least amount of work, namely they primarily consume insects. Our ancestors, assuming they shared a similar diet to common
Sleeping on the ground provides the hazards of being unprotected and vulnerable. As a reference, only the largest of the great apes occasionally display this ground sleeping behavior. It’s likely the cultivation of fire generated the security needed to no longer rely on the safety of trees. The phasing out of forested habitats no longer requires the presence of overly developed upper body structure and muscles. Taking advantage of the heat release from the oxidation of organic material had another consequence on our ancestors: it allowed us cook our food.
Cooking is a uniquely human activity and its practice has influenced human evolution and facilitated our development into modern Homo Sapiens. The reason for this is simply nutrient absorption. Heating foods doesn’t increase the overall energetic capacity of a nutrient, quite the contrary, it reduces it. However, the amount of nutrients absorbed is substantially higher while the work to access the nutrients is lower. Cooked foods are generally softer, more porous, and consequently have higher surface area than in their raw state. This lessens the burden of digestion of previously tough foods. Consuming cooked over raw foods allows for the body to use less energy to metabolize nutrients. The ingestion of cooked foods produced a number of notable changes to our physiology[2]. Biological anthropologists note that around the same time the cultivation of fire was occurring, the structure of our bodies drastically changed from our previous tree dwelling relatives. Our bodies adapted to the increased ingestion of cooked foods by losing muscle mass around the jawline and developing a less flared rib cage which is indicative of a smaller digestive system. More efficient caloric intake was made possible by the aid of adding fire to food preparation. The primitive human could get all the energy required without the same bulky digestive tract. This modification to our physiology cannot be understated because this meant that less energy was spent on nutrient absorption freeing up metabolic processing power for other functions. Namely, the excess energy previously designated for digestion was allocated for our brain cavities to grow. This difference between our ancestors and current existing primates of similar size is palpable. Apes and chimpanzees designate
of their basal metabolic rate to cerebral function. This seemingly small difference in energy allocation resulted in drastic changes for our ancestors and helps distinguish us from other beings in the animal kingdom.
Incredibly, cultivation of energy release in its primitive forms altered human
existence. We adapted and learned how to tame fire and in doing so propelled our species to what it is today. Fire created a non-solar based form of light that could extend daytime, provided heat allowing access to environments with climates that would normally be inhospitable for primates, and allowed us to cook, and externalized a portion of digestion which actively propelled us to surpass other primates intellectually and thrive as a species.
1.2 Greek Fire
that can be ignited that will not extinguish with water. This is the ancient version of napalm that is used today in modern militaries and its composition, gelatinous gasoline, also takes advantage of its immiscibility in water to effectively burn even when it comes in contact with water. Greek Fire was paramount to the Byzantines for its ability to enhance its creator’s defenses, however chemically it is essentially the oxidation of a carbonaceous material that burns relatively slow[3-5].
1.3 Gunpowder
Roughly 400 years later around 1100 A.D., the Chinese provided the next advancement in the history of human interaction with energetics with their discovery of gunpowder. The earliest reports of gunpowder’s creation dates back 1000 years ago when Chinese alchemists, in their pursuit of an elixir of immortality, discovered a powdered
formulation that had properties that ended up being quite the opposite to its intended purpose. It took another 200 years for Western society to utilize and characterize gunpowder. Roger Bacon is largely credited with deciphering gunpowder’s ingredients for western societies which are saltpeter, charcoal, and sulfur. When first re-created it was noted that “the sound of thunder may artificially be produced”. This is a result of gunpowder’s more rapid reaction than traditional burning of plant life. At the time it was not realized that this was a new chemical reaction pathway for energetic release. The principle of combining a fuel source with an oxidant is the same but instead of using atmospheric oxygen gunpowder uses potassium nitrate as the oxidant and charcoal as the fuel source were sulfur is merely a catalyst of this reaction. As seen in the equation below.
→ ∆
The stored energy of gunpowder allowed for projectiles to significantly increase and surpass the ranges of traditional war machines such as catapults. The new energetic material
gunpowder facilitated the development of high projectile speeds and would prove to change the course of how warfare in modern life was conducted. As an example, this new invention eventually spelled the death of the Byzantine Empire because of the ability of cannons using gunpowder to project a heavy object towards its wall defenses with an order of magnitude more force than what they were designed to defend against. For an 800 year history
gunpowder was the main energetic material of choice by modern societies. The fundamental nature of its chemical constituents changed little but its manufacture was refined for different purposes; as propellant in guns and cannons as well as an explosive for mining industries.
Early on in the 14th century it was noted that small grain charcoal burnt faster than large grain charcoal allowing small grain powders to be employed with rifles and shotguns for shorter burn times and large grain powders being employed for larger bore weapons requiring longer burn times to propel larger projectiles. This is the first instance when a connection was made between the size of the fuel source and it’s affects on energetic behavior[3].
1.4 A new class of materials
1.4.1
Dynamite
The next major advancement in energetics development was initiated by researchers in a completely separate field. At the University of Turin in 1832 Asconio Sobrero, first
Figure 1.1- Chemical structure of Nitroglycerin.
Nitrate compounds at the time were known to have a depressing effect on blood pressure, so it was thought if a compound could be created with high nitrate density it would provide the same blood pressure lowering effects at a more increased effectiveness. He found that the substance once administered to the skin did indeed lower the blood pressure
significantly, however he also noted that in its dry and crystallized form nitroglycerin is extremely shock sensitive and will detonate upon the mildest of disturbances. He had a notion of its potential power but declined to research it any further stating that, “science should not be made a pretext or means of dishonorable undertakings or of business speculations”. This compound would lay dormant until the early 1860s when a Swedish inventor Immanuel Nobel and his son Alfred began researching ways to safely utilize nitroglycerin’s energetic properties. During manufacture the Nobels noted its particular sensitivity to external stimuli making its energetic release quite unpredictable. Many of the formulations used by the father and son team consisted of large percentages of gunpowder with only small percentages of nitroglycerin. This approach was unsuccessful but is most likely the source of Alfred’s idea. The contribution that Alfred gave to this endeavor is as simple as it is ingenious. He noted that the energetic release of nitroglycerin could be initiated with a small amount of lesser explosives like gunpowder. This is when in 1864 he patented his nitroglycerin igniter. The igniter patent provided a way to consistently ignite nitroglycerin, however the issue of its mechanical sensitivity had yet to be addressed. It took Alfred three more years to solve this problem. He ingeniously took an inert naturally
shelled algae and exposed it to nitroglycerin. He posited that if he could get an inert material to absorb the highly sensitive nitroglycerin the resulting composite would be much less sensitive to shock initiation and therefore be more safely handled. This invention for the safe handling of nitroglycerin is more commonly known as dynamite. The creation of this new explosive revolutionized the way warfare, modern construction, and mining were conducted and is the invention Alfred Nobel is best known for [3].
Dynamite was not the only energetic material advancement in the 1800s. During the same time that nitroglycerin was being synthesized another similar nitrated organic
compound was created by Christian Friedrich Schönbun in Germany. As is the case of many scientific discoveries it has been recorded that this invention was created by accident.
1.5 High Explosives
By simply exposing candidate organic molecules to nitric and sulfuric acids it was possible to insert a fuel source and an oxide source in the same molecule. The bonding of an unstable oxygen rich functional group to an organic compound with high carbon content created a new type of energetic material dubbed high explosives. In contrast with gunpowder, this creates a monomolecular energetic where the two reacting groups responsible for the energy release are in atomically close proximity. This combination yields extremely fast reaction rates. The chemical reaction that has to occur in this energetic does not have to go through any atomic transport unlike gunpowder. This eliminates the need for the combination and powder processing that gunpowder requires. Comparing the burn rates of dynamite or nitroglycerin with that of gunpowder, it is clear that the organics reacts 10 times faster. Similar organic explosives have comparable in mostly faster reaction rates the nitroglycerin. These monomolecular energetics react so fast that the rate of energy release that it exceeds the speed of sound in the material. The reaction results in a shockwave through the material with rapid gas production that has a demolishing effect on any material in close proximity. High reaction speed of gas production is what separates energetics designated as high explosives (TNT, RDX, PETN etc.) with low explosives (Gunpowder).
1.6 Combustion: Detonation versus deflagration
distinction is made by how fast the reaction occurs. Low explosives react slower and are said to deflagrate and high explosives react rapidly and are said to detonate. An oxidation reaction slower than the speed of sound in a material is called deflagration or more commonly
burning if the oxygen source is supplied from the environment. If the reaction speed exceeds
the speed of sound in the material it’s called detonation. In a detonation the reaction proceeds through the initiation and continuation of a shockwave. More background on shockwave physics will be covered in chapter 7[6-8].
As is the case with many technological developments in history high explosives were mainly researched for military purposes. With the advent of nitroglycerin, guncotton, and the ease at which organic molecules can be nitrated, the late 1890s to the 1940s saw great innovation of organic energetics that were employed during both world wars.
1.7 Thermite
During the same time of rapid development of organic explosives another energetic formulation was discovered. In 1898 Hans Goldschmidt first reported the reducing capacity of aluminum in his paper to the Journal of the Society of Chemical Industry “Aluminum as a heating and reducing agent”[9]. Goldschmidt’s motivation for investigating the reducing properties of aluminum was the search for an easier refining method to obtain pure metals from their mineral states. At the time he observed that a reaction of lead sulfide with metallic iron yielded pure lead and iron sulfate so he surmised that aluminum would produce a similar result when combined with lead sulfide and indeed it formed aluminum sulfide and pure lead. He continued on to posit that because aluminum oxide was so stable it could be used as a reducing agent to other less stable metal oxides in an attempt to refine the pure metal. Goldschmidt’s experiments with metallic oxides were extensive and very exothermic. The reaction combining a reducing metal with a weaker oxide is shown in reaction below, where
is the reducing metal, is the oxidant, and ∆ represents the heat released.
The oxides of chromium magnesium, iron, copper, titanium, boron, tungsten, molybdenum, nickel, cobalt, zirconium, vanadium, niobium, tantalum, cerium, thorium, barium, calcium, sodium, potassium, lead, and tin were all shown to be reduced by
aluminum. Goldschmidt notes in his paper a possible source of the failure of predecessors to achieve reduction of other metal oxides. He reasoned that previous preparation of the
materials was insufficient because he describes that this oxidative reduction reaction requires granulated aluminum. The granulated aluminum Goldschmidt referred to was created via an agitated slow cooling technique of the molten aluminum. This process of reduction of common metal oxides was found to accomplish his goal of obtaining and refining pure metals. The utility of the heat generated during the oxidative process of a thermite mixture was not lost on Goldschmidt either. He states, “using a cheap and pure aluminum and cheap source of oxygen such as oxide of iron, the process as a key producer possesses considerable commercial value as it can be supplied in cases where would not be convenient to use other sources of heat.” After this discovery thermitic compounds and formulations were used in welding and joining applications specifically joining to railroad ties together when means of welding were unattainable.
1.7.1 Metallic Addition to Traditional Energetics
Deriving from Goldschmidt’s work the oxidation of metals and the extensive heat released from the reactions were primarily used as supplementary additions to traditional energetic materials. The bulk of the research involving metal combustion employed metal particles as additives to existing energetic formulations to enhance their thermal properties. Particular attention was paid to aluminum because of its abundance and high flame
temperatures. Metal particles mostly aluminum, were added to high explosive formulations like TNT, PETN, and RDX [3] to increase their thermal signature.
rocket propellants [10]. Specifically they added aluminum particles of micron to millimeter size to ammonium perchlorate to increase the impulse of the solid rocket fuel. The standard metric in which rocket propellants are measured with is the specific impulse value of the fuel formulation. The impulse is computed from equation 1.3[5, 6], where is the specific impulse, represents the moles per unit weight, is the flame temperature, and is a constant. Increases in flame temperature directionally influence the specific impulse value according to equation solid rocket propellants.
. 1.3
The rocket propellant research community from the 1940s to the 1980’s employed the use of aluminum additions to its formulations for the express purpose of enhancing combustion rates and temperatures. The main parameter the Al addition amplified was combustion flame temperature. More heat can be generated in the same allotted time in which the rocket is fired when metal combustion is added. The effect of the addition was a net improvement in rocket motor characteristics.
1.8 Nano-sized Aluminum
Reshatov et al. [11] first showed in 1984 the benefits that nano sized metal particles contribute to the energetics community. They showed that with the addition of nano
2. Nano Energetic Materials
Military applications for thermite were mainly concentrated on anti-equipment munitions. Thermite grenades were developed to melt through engine blocks and armament of captured war materials to render them useless. The inability to use thermite as a propellant or anything other than a heat source was mainly due to its slow reaction rate as seen in table 2.1.
Table 2.1- Comparison of energetic materials properties. Energetic Material Energy Density [KJ/cm3] Reaction Speed [m/s] Power Density [MW/cm3] Octanitrocubane
ONC 10 10,000 160
Dynamite 2.4 7,000 13
Thermite-Slow 30 10 0.3
Thermite- Fast 30 900 30
over several microns in distance which yields considerably slower reaction velocities. Comparison of the length scales is seen in figure 2.1.
Figure 2.1- Organic Energetic vs. Inorganic order of reaction distance.
energetic systems that promote the fastest avenues of diffusion and decrease the net reaction distance between both reactants.
Until recently, traditional processing technologies have been unable to intimately mix the oxidant and the fuel source below micron sized domains significantly hampering the energy release. However at the advent and utilization of nano aluminum as additives to standard energetics[6], it was then introduced by Aumann et al. the idea of combining two nano sized energetics to form stand-alone explosives[14]. These materials were dubbed metastable intermolecular composites (MICs). MICs represent a subclass of energetic materials that are comprised of traditional energetic components combined at the nanoscale. The motivating reasons are straightforward. If the features of the reactants can be decreased more material will readily participate in rapid reaction. To obtain energetic materials that intimately mix on the order of nanometers several recently developed processing techniques must be utilized. The four main methods of MIC creation are nano powder mixing, sol-gel synthesis, arrested reactive milling (ARM), and thin-film deposition.
2.1
Nano Powder Mixing
The first and most straightforward manner of combining energetic materials at the nano scale is simply the physical mixing of nano particulate sized reactants or nanopowders [15-32]. The theory behind nano powder mixing is trivial; however the creation of nano-sized constituents that are uniformly distributed in size is more involved. As was discussed
previously in chapter 1, nano particles of metals can be realized via an exploding bridge wire design where current is passed through a thin wire of metal, which then creates a plasma that will explode into metal nanoparticle droplets once the circuit is broken. These droplets condense from the vapor phase on prepared sample collection surfaces [14, 33]. Other ways of nanoparticle fabrication include electrospraying, and induction plasma technology. Each method is a different path to the same result; creation of nanoparticulate material [34-37]
stoichiometry and placed in an organic solvent, normally hexane, and sonicated to homogenize the mixing. The resulting solution is then dried in air, sometimes with the assistance of a warm hot plate (40°C), and filtered through screen mesh to ensure a free flowing powder. The powder mixtures obtained via nanopowders mixing react considerably faster than micron sized formulations of the same chemical constituents. High propagation velocities can be achieved (1000m/s) with this methodology. Another consequence of MIC fabrication in this manner is the extreme sensitivity to impact, spark, and friction related insults. In addition to the relatively high price of prepared nanopowders, these properties can provide significant challenges to scale up methods for bulk applications outside the
laboratory but are an excellent way to easily obtain an experimental system to test the influence of varying reaction parameters.
Notable discoveries from the investigation of nanopowders energetics reveal in thermite MICs a slightly fuel rich stoichiometry provides the fastest reaction rates and powder reaction velocity scales with the diameter of the confined burning space[16, 17].
2.2
Sol gel processing of nano energetics
2.2.1
Sol-gel chemistry
In solution chemistry, the sol-gel process itself has been investigated for over 150 years[6, 38] and has been employed to create varying sizes and morphologies of
functional groups. As depicted in figure2.2, when exposed to water, metal alkoxides readily undergo hydrolysis which cleaves the alkoxy-metal bond and replaces it with an alcohol functional group.
Figure 2.2- Hydrolysis and condensation reactions that occur during sol-gel synthesis.
The extent of hydrolysis of the metal is a function of water and catalyst concentration and will completely replace the organic ligands with hydroxyl groups (-OH) if the
bonds, or have a functionality of three or more. A colloidal suspension of metal oxide particles begins to form in solution as the condensation is continued which is called a ‘sol’. As the reaction progresses the suspended particles begin to accumulate and start to impinge on one another. When these particles begin to bond to each other the viscosity of the solution rapidly increases where the resistance to motion is corresponding to the ‘gel-point’. After the particles are linked a ‘gel’ is created consisting of a connected porous network throughout the solution that is enveloped by solvent. Particles with nano sized spherical features that are linked together in the gel are created in uniform size, morphology, and composition through the manipulation of solvent type, temperature, pH of the solution, and the concentration of the reactants [6, 39]. Particle sizes can range from 1 nm to 1000 nm in diameter.
Figure 2.3- Sol-Gel Synthesis solvent extraction schematic for an Aerogel and Xerogel.
2.2.2
Sol-Gel Fabrication of Energetic Materials
This synthesis technique has been applied to create intimate mixtures of energetic materials [15, 39-45]. Several sol-gel methods can be employed to incorporate the reactants together however the most common technique used is the creation of a networked oxidizer such as iron oxide which is infiltrated with metal fuel particles most commonly aluminum. This can be easily realized by the addition of metal particulates at the onset of a viscosity increase right before the gel forms. This simple yet crucial step allows for the addition of nano particulate metals to be suspended in the porous oxide matrix. The metal nanoparticles are not allowed to self-segregate due to gravity because the porous network structure locks the particles in suspension before they can precipitate out of solution. The sol-gel process is not limited to only making oxide networks as evidenced by researchers at Lawrence
feasibility of sol-gel created energetics and explored their physical and reactive properties. Under the right conditions sol-gel [38] prepared thermites have demonstrated reaction velocities up to 900 m/s which is a drastic increase from a traditional thermite reaction of 1 m/s. While this speed is still not eclipsing that of organic energetics it certainly proves that sol-gel nano composites and MIC’s in general are capable of at least supplementing energetic formulations.
Sol-gel chemistry also has the added benefit over nanoparticle mixing of using relatively environmentally benign solvents such as alcohol and water instead of hexanes as is the case for nanopowder physical mixtures. When compared in relation to burn properties nano particle mixing and sol-gel techniques both generate materials that can react rapidly above 500m/s [43, 46]. In current reports some sol-gel prepared nanocomposites burn faster even when both have comparable surface area per volume values[47]. In this case Al and Fe2O3 were combined via nanopowders mixing and sol-gel synthesis with both having similar particle sizes and surface areas but the phase of the commercially obtained Fe2O3 nanopowder was of an amorphous metastable phase whereas the sol-gel prepared oxide was α-Fe2O3 allowing for better transport characteristics.
2.3
Arrested Reactive Milling
function of the milling media diameter and the time allowed to mill. Once the parameters for the specific chemical formulation are known, a larger batch is milled and then the mixing is arrested before spontaneous reaction can occur in order to not damage any of the milling equipment [35, 36, 48-53].
Figure 2.4- Typical microstructure obtained by ARM MIC processing.
The starting powder reactant materials are considerably more affordable than obtaining nanoparticulate starting powders. This method also involves low cost and easy experimental fabrication only requiring a standard milling apparatus. The most notable advantage of this technique however is the ability to create large macroscopic quantities of energetic material that contain nano-sized domains that can be readily implemented in industry.
2.4
Physical Vapor Deposition of Nanoenergetics
the semiconductor industry and are predominantly used for the purpose of assembling varying electronic component architectures that form the basis of transistor fabrication. Each method differs in how experimental execution is undertaken, however the end results are similar: precise deposition of thin layers of material. The most common PVD method in which energetics are created is sputter deposition and is the technique the author has employed to investigate thermitic reactions.
Sputtering is a process by which a source material to be deposited is inserted into a reaction chamber that is placed under vacuum. An inert carrier gas, typically argon, is introduced to the chamber at a specified pressure and a negative bias is applied to the source material. This potential repels free electrons in the gas which collide with and subsequently ionize the argon atoms. The positively charged ions are then attracted to the negatively charged source material called the target and impact the surface with energies proportional to the bias applied and the mean free path of the gas molecules which is a function of
pressure[54].
After impacting the surface several processes can and do take place in response to the incident kinetic energy.
-The ions can be reflected which is the fundamental basis of Ion Scattering
Spectroscopy techniques such as Rutherford Back Scattering (RBS), medium energy ion scattering (MEIS), or low energy ion scattering (LEIS). Each technique differs by the amount of incident ion energy, however each measure the energy loss of the reflected ions to determine specific information about the surface. As probing depth increases with the incident energy (0.1ev-10MeV) compositional and topographical information can be collected.
-The ions can also implant themselves in the matrix of the target which is the phenomena utilized for surface treatments in electronics for specific doping concentrations of beneficial impurities (i.e. P in Si).
-The incident ions can cause a cascade of collisions with the atoms of the target which leads to target atoms being ejected. This ejection is called sputtering[54].
The ejection of the atoms from the target source is a function of the energies used to accelerate the ions into the target, the target atomic mass to the ionic mass ratio, and the pressure of the sputtering gas. When the appropriate conditions are met the ejected atoms can be collected on a substrate surface and thin films of material can be achieved.
When sputtering is used to create energetic materials the prevailing geometry used is a multilayered alternating geometry that creates a laminate microstructure [55-78] seen in figure 2.5.
Figure 2.5- TEM micrograph of an Al/CuO thermite thin film, with total thickness 1080nm.
This layered hierarchy is created by exposing a sample surface to two different source materials with either a rotating substrate carousel while both sources are depositing
simultaneously or an alternating deposition sequence where only one source is on at a time. The simultaneous deposition method with a rotating sample stage allows for less
the non-depositing target. It is in this sequential deposition method that the thin thermite films in this manuscript where created. A schematic of a deposition chamber used to create these thin films is shown in figure 2.6.
Figure 2.6- Dual magnetron sputtering architecture used to fabricate thermite nanostructures
Previous investigations into nanolaminate behavior have shown as the thickness of the reactant layers, also known as bilayer thickness, decreases an increase in reaction velocity is observed [75, 76]. A tradeoff for this increased velocity is how bilayer thickness affects the energetic output [76, 95]. In the laminate geometry it was shown at the interface of the two reactant materials that a small but finite amount of product phase is present. The authors increased the number of bilayers and kept the material volume constant and found the overall energy available for reaction decreased as reactant interfacial area increased. The power of experimentation with laminate geometry is the ease of which its behavior can be transposed to other MIC fabrication methods and provides for valuable insight into how future
3. The role of terminal oxide structure and properties in
nanothermite reactions
Authors: 1E. J. Mily, A. 1Oni, J. M. LeBeau, 1Y. Liu, *H. J. Brown-Shaklee, *J. F. Ihlefeld, and 1J-P. Maria
1North Carolina State University, Department of Materials Science and Engineering, Raleigh NC, 27606 USA * Sandia National Laboratories, Electronic, Optical, and Nanomaterials
Department, Albuquerque, NM 87185 USA doi: 10.1016/j.tsf.2014.05.005
Published in journal “Thin Solid Films”
3.1
Abstract
In this report, thin films of copper oxide, a common thermite oxidant, and varying metallic species (Al, Zr, and Mg) were deposited in an alternating layered geometry on sapphire by magnetron sputtering. Keeping stoichiometric equivalence, effects of varying metallic constituents were studied with respect to their onset reaction temperature and energy output. Reaction progression was characterized by a systematic step wise vacuum anneal followed by subsequent ex situ x-ray diffraction, and differential thermal analysis. It was
found that reaction temperature depends heavily on the terminal oxide’s diffusion properties, showing a correlation of lower reaction temperatures with higher values of anion diffusivity.
3.2
I
NTRODUCTIONThermite reactions have been studied since 1893, and are utilized in applications and fields where high heating rates and temperatures are desired due to their extreme exothermic output upon reaction [60]. The thermite geometry pairs an oxygen source with an adjacent oxygen scavenger in a metastable configuration that can be triggered into action by a supply of energy arriving via a thermal, optical, electrical, or acoustic form. When sufficient energy is added to promote the initial interfacial reaction, oxygen and metal are exchanged between source and sink, and heat is released according to reaction below.
→ ∆
where M and AO are the parent metal and oxide respectively, and ∆ represents the heat
released. These exchange reactions are some of the most exothermic known, commonly exceeding 300 kJ/mol and, when they occur under adiabatic conditions, i.e., heat accumulates
much faster than it can be dissipated to its surroundings, they can produce temperatures in excess of 3000K [96].
A common goal of research in energetic materials is to generate the capability for controllable or tunable energy release from a single material. Regulating either the fraction of material that reacts, or the time during which that reaction occurs enables one to tailor the energy and power outputs respectively. Furthermore, it is also desired that energetic systems exhibit the desired sensitivity to external stimuli to ensure the appropriate predictability and reproducibility for safe and reliable use. In order to understand how energetic materials will behave macroscopically, fundamental explorations of microscale and nanoscale interfacial reaction mechanisms are essential and motivate this study.
majority of nano-energetics consist of powdered systems [15, 23, 24, 27, 30, 41, 96, 100-105] or multi-layered laminate structures [48, 55-60, 65, 74, 76, 83, 84, 89, 90, 106-111]. The multi-layered structures, or reactive nano-laminates (RNLs), are created most commonly by physical vapor deposition of the constituent materials in alternating fashion to obtain the desired stoichiometry. For example, this architecture for energetic materials used by Coffey
et al. shows that reaction progression is influenced by local chemical structure/mixing at the
parent interfaces and the extent to which this interfacial region penetrates into the total stack. [89, 90, 108-110]. Other studies using this geometry show exothermic dependencies on bilayer spacing [76], and effects of intermixing on reaction velocities [65, 66].
Reactive thermite nanolaminates, which are the focus of the present work have been explored by a small group of researchers, with investigations of layer thickness and the limits of interfacial perfection, but the overwhelming majority of experiments focus on the CuO-Al system [56, 57, 59, 60, 83, 84, 96, 100, 102]. While reports exploring the influence of
oxidizers, fuel mixtures, geometry on energy output, ignition, and reaction propagation speed can be found [27, 65, 74, 76, 88] there is a comparative paucity of research addressing the barrier properties of the terminal oxides in these thermite systems and how they affect energy release. Investigations by Zachariah et al. illuminate the importance of the terminal oxide in
Figure 3.1- a) Idealized schematic of oxygen exchange reactions at a) the original MO | M
interface and b) showing the accumulation of an intermediate barrier layer that accumulates with time.
While the structure and properties of the terminal oxide are only one aspect that regulate laminates reactions, their intimate role in transport provides them with a particularly important role, this argument underpins the central hypothesis of the present investigation, that by understanding transport across the thermite terminal oxide, one can rationally select and engineer the precursor scavenger metal such that energy release is tuned for the correct energy/power ratio, and that the sensitivities are practically useful.
zirconia is a fast oxygen anion conductor at elevated temperatures, while MgO has intermediate properties [112-118]. CuO was chosen as the constant oxidizer due to its relative stability in ambient conditions, its ease of fabrication by physical vapor deposition, and its known use as a reducing agent/ oxygen source for thermite reactions. Table 3.1 lists the formation energies, the diffusivity values, and the molar volumes of oxidation for each metal/metal oxide combination [15, 112, 114, 118].
While thermite-based energetic materials are of most interest in a powdered form factor, studying such reactions in a nanolaminate geometry provides a unique opportunity to control initial interface density, contact area, and the extremes of surface to volume ratios. Furthermore, preparing such materials via thin film routes enables one to create pristine and flat interfaces that offer insight into the fundamental structure-property relationships that regulate energy release.
Table 3.1. Heat of Formation, Oxygen Diffusivity, and Pilling-Bedworth Ratio for each
system studied. Thermite System Heat of Formation [kJ/mol]
Heat of Formation /mole oxygen
[kJ/mol]
Oxygen Diffusivity in Terminal Oxide
at 600 °C [cm2/sec]
Pilling-Bedworth Ratio
Al-CuO -1676 -527 2.33 x 10 -28 1.29
Mg-CuO -601 -601 1.31 x 10 -26 0.81
3.3
E
XPERIMENTALP
ROCEDURE3.3.1
F
ILMD
EPOSITIONReactive nano-laminates were created using a load-locked dual magnetron sputtering system with shuttered confocal sources oriented at 180 °. Substrates were mounted with double-sided tape on a rotatable substrate puck at the chamber center. For all experiments the substrate material was c-oriented sapphire that was precision diced into 4 mm x 4 mm
squares. The precision sizes were used to facilitate quantitative thermal analysis. Multilayer stacks were prepared by alternating depositions of CuO and the component metals with a 15 minute rest between each deposition to allow the heat from sputtering to dissipate. The thickness values of the individual layers in each case were chosen to maintain global stoichiometry, i.e., enough oxygen to oxidize the entire metal layer. All samples contain three bi-layersand bilayer thicknesses were 356 nm, 363 nm, and 491 nm for Al/CuO, Zr/CuO, and Mg/CuO respectively. Both magnetron sputtering guns were 2 ” in diameter, and the sputtering metal targets (Al, Mg, and Zr) were purchased from Kurt Lesker. Metals were deposited using a DC power supply with 20 Watts of power under pressure of 0.4 Pa Argon (purity > 99.9999%) with a pre-sputter period of 10 minutes before deposition. CuO was deposited using a CuO sputtering target with an indium bonded copper backing plate also acquired from Kurt Lesker. CuO was layered using an RF power supply in the presence of 0.27 Pa Argon with 100 Watts of power with a pre-sputter period of 1 minute. The Al, Zr, and Mg films were deposited at 13, 10, and 15 nm/min respectively. The CuO films for each system were layered at a deposition rate of 15 nm/min.
3.3.2
T
EMS
AMPLEP
REPARATIONprevent ion beam damage. A probe-corrected FEI Titan G2 60-300 kV S/TEM equipped with a high-brightness Schottky field emission gun operated at 200 kV was used for high-angle annular dark-field- scanning transmission electron microscopy (HAADF-STEM) imaging.
3.3.3
A
NNEALING PROCEDURETo assess reactivity, RNL samples were exposed to vacuum anneals in a turbopumped quartz tube furnace at pressures below 1.3x10⁻⁴ Pa to minimize the influence atmospheric oxygen on reaction progression. All samples were heat treated by direct insertion into a preheated hot zone while under vacuum, ramped at 10K/min, and held at temperature for thirty minutes.
3.3.4
X-
RAYA
NALYSISThe phase assemblage and film thickness was measured by x-ray diffraction using a PANalytical Empyrean diffractometer that uses a Cu Kα source with Bragg-Brentano and parallel beam optics, respectively.
3.3.4.1 Deposition
Rate
Determination
Deposited materials CuO, Al, Mg, and Zr were first coated onto polished silicon substrates for a set amount of time. Samples were then placed in the diffractometer with parallel beam optics. Scanning at low glancing angles (0-2 °) yields the critical angle of total internal reflection Ɵ)crit and subsequent constructive interference fringes Ɵ1, Ɵ2, Ɵ3 etc. at higher angles. From these values the total film thicknesses were computed using the Fresnel equations. Using the computed thicknesses and known exposure times, deposition rates were then computed.
3.3.4.2
Phase Identification
3.3.5
T
HERMALA
NALYSISThermal analysis was conducted using a differential thermal calorimeter (Netszch Proteus Jupiter F3). The calorimeter was calibrated for sensitivity and temperature using pure standards with known melting points and heats of fusion provided by Netszch (Al, Zn, In, Bi, and Au). During analysis a protective gas (Ar 99.999% -AirGas) flow (20 ml/min) was used. Due to mechanical instability when delaminated, the thin film samples were left on sapphire substrates and set in covered alumina crucibles on a power compensated platinum sample stage. The overall thickness of the thin films did not exceed 1.5 μm and the mass of the thin films which were estimated using bulk density values were on the order of 100 μg. A baseline program used for these samples ramped two empty alumina Netzsch crucibles with three dynamic sections. First the program ramped to 1200 °C at 5 Cmin-1 , followed by a 30 Cmin-1 cooling period to 30 °C, then a final ramp to 1200 °C at 5 Cmin-1 . The thermal signal from the oxygen exchange is irreversible and only occurs during the first temperature ramp. To achieve a flat baseline the second ramp was subtracted from the first to clarify the exothermic activity.
3.4
R
ESULTS ANDD
ISCUSSIONand Martin [82] examined the evolution of aluminum oxide formed at the interface of at CuO surface via a stepwise deposition of Al. They detected that the first 7-8 mono layers of Al deposited were corresponding to 2-3 nm of Al2O3, further Al deposition led to metal accumulation. This indicates that while finite reaction occurs at a thin film thermite interface, further oxygen exchange is hindered by the presence of this barrier at room temperature.
Figure 3.2- TEM image of Zr-CuO multilayer with 3 total bi-layers.
Considering this metastable initial state, the temperature at which the reaction becomes rapid is arbitrary to an extent because of its dependency on kinetic factors, the ramp-rate of
Figure 3.3- X-ray diffraction patterns for (a) Al-CuO, (b) Mg-CuO, and (c) Zr-CuO reactive
nanolaminates exposed to high temperature anneals. The diffraction angles for Cu metal are highlighted for clarity.
Fig. 3.3 illustrates a strong relationship between the temperature onset of the self-propagating reaction and chemistry of the initial metal layers, despite the fact that the thermodynamic driving forces for the respective oxygen exchange reactions are similar. The diffraction patterns reveal that the onsets of reaction occur at 800 °C, 500 °C, and 300 °C for the Al, Mg, and Zr samples respectively. These temperatures are in no way fundamental to the specific systems as they depend on thermal boundary conditions and heating rate, however, they are meaningful for relative comparison.
![Figure. 3.5: Exothermic onset temperature vs terminal oxide diffusivity [cm2/sec] at 500 °C](https://thumb-us.123doks.com/thumbv2/123dok_us/1759535.1226124/60.612.192.449.129.344/figure-exothermic-onset-temperature-terminal-oxide-diffusivity-sec.webp)