The OECD FIRE Project - Objectives, Status, Applications
A. Angner1), H. P. Berg2), M. Röwekamp3), W. Werner4) and J. Gauvain5)
1) ESKonsult
2) Bundesamt für Strahlenschutz (BfS)
3) Gesellschaft für Anlagen- und Reaktorsicherheit (GRS) mbH 4) Safety Assessment Consulting (SAC)
5) OECD/NEA
ABSTRACT
Realistic modeling of fire scenarios is still difficult due to the scarcity of reliable data needed for deterministic and probabilistic fire safety analysis. Therefore, it has been recognized as highly important to establish a fire event database on an international level. In consequence, several member countries of the Nuclear Energy Agency (NEA) of the OECD have decided in 2000 to establish the International Fire Data Exchange Project (OECD FIRE) to encourage multilateral co-operation in the collection and analysis of data related to fire events at nuclear power plants. This paper presents the OECD FIRE project objectives, work scope and current status of the OECD FIRE database after four years of operation as well as first preliminary statistical insights gained from the collected data.
INTRODUCTION
Fire hazard analyses as well as probabilistic fire risk analyses have shown that fire may be an important contributor to core damage and plant damage states, particularly for older nuclear power plants (NPP). However, realistic modeling of fire scenarios is still difficult due to the scarcity of reliable data for fire analysis.
Therefore, during its 2000 annual meeting CSNI formally approved to establish an international fire analysis database, similar to that set up by OECD/NEA for common cause failures. The project was formally launched in January 2003. Organizations producing or regulating more than 80 % of nuclear energy generation worldwide contribute data to the OECD FIRE data project. Nine countries signed the OECD FIRE agreement for the first phase of the project. Meanwhile two further countries have joined the project. The institutions from the participating countries involved in the OECD FIRE project are at present:
Canada: Canadian Nuclear Safety Commission (CNSC) Czech Republic: Nuclear Research Institute (NRI) Rez
Finland: Radiation & Nuclear Safety Authority (STUK) with the power utilities Teollisunden Voima Oy and Fortum
France: Institute for Radioprotection and Nuclear Safety (IRSN) supported by the licensee Electricité de France
Germany: Gesellschaft für Anlagen- und Reaktorsicherheit mbH (GRS) supported on the licensee side by VGB and on the regulatory side by BfS
Japan: Japan Nuclear Energy Safety Organization (JNES) The Netherlands: VROM - Inspectie Kernfysische Dienst (KFD) (2007)
Spain: Consejo de Seguridad Nuclear (CSN)
Sweden: Swedish Nuclear Power Inspectorate (SKI) Switzerland: Swiss Federal Nuclear Safety Inspectorate (HSK) United States of America: U.S. Nuclear Regulatory Commission (U.S. NRC).
The OECD FIRE project is headed by a Project Review Group (PRG), meeting approximately twice a year, and is supported by an Operating Agent (OA) establishing and maintaining the database as well as checking the quality and consistency of the submitted data.
OBJECTIVES OF THE OECD FIRE PROJECT
The main objective of the OECD FIRE project is to improve the safety of nuclear power plants by incorporating more feedback from operating experience and by providing common resources for analytical work within the frame of deterministic and probabilistic assessments. To fulfill this objective, the project includes the establishment of a framework for a multi-national co-operation in collecting and analyzing fire data. Initially, within a three years program (2003 - 2005), the primary activities of the OECD FIRE project were to:
• Define a format for collecting fire event experience by international exchange in a quality assured and consistent database;
• Collect and analyze fire events over the long-term so as to better understand such events, their causes, and
their prevention;
• Generate qualitative insights into the root causes of fire events, which can then be used to derive approaches
or mechanisms for their prevention or for mitigating their consequences;
• Establish a mechanism for the efficient feedback of experience gained in connection with fire events,
including the development of defenses against their occurrence, such as indicators for risk based inspections;
• Record event attributes to facilitate quantification of fire frequencies and fire risk analysis.
The database is designed to be used to support model development and validation, to identify all types of events and scenarios for inclusion in fire PSA models to ensure that all mechanisms are accounted for and to evaluate fire occurrence frequencies.
With emphasis on data validity and data quality, an OECD FIRE Coding Guideline has been developed for collecting and classifying fire event data to ensure consistent interpretations and applications. An Operating Procedures Manual and the Quality Assurance Manual complete the project documentation. The data submitted are checked by an independent expert regarding consistency, completeness and compliance with the Coding Guidelines; in case of non conformity, the submitting country is requested to improve the provided data.
DATABASE SCOPE, CURRENT STATUS AND EXPECTED FURTHER USE
Applicable to commercially operated nuclear power plants only, the OECD FIRE project exchanges fire data covering all operating modes including construction and decommissioning phases.
One challenge in setting up an international database is to ensure a consistent reporting level between countries in order to capture all events fulfilling the objectives of the project. Regulatory and utilities' reporting levels are different between member countries (e.g., fire did it or did it not affect safety equipment, different duration thresholds, etc.), and, in addition, the reporting criteria may have changed with time. For example, in Germany the reporting criteria have been changed twice and they are intended to be changed again in 2007.
Therefore, for events from the past, the OECD FIRE database includes for reference the evolution with time of reporting levels. For future events, one objective is to define a project reporting level, which accounts for the countries' policies while correctly addressing the technical objectives of the project.
Fire events considered in the database are defined as follows:
• Any process of combustion characterized by the emission of heat accompanied by (open) flame or smoke or
both;
• Rapid combustion spreading in an uncontrolled manner in time and space.
This includes incipient fires as well as fully developed fires. Fires shall be included in the database, if they are relevant to safety, and also, if the same type of fire has the potential to be significant for safety under different boundary conditions (such as different ventilation conditions, other plant operating states (POS), same components affected in other locations, etc.). Explosions not resulting in an open flame shall be excluded.
As of March 31, 2007 the database contains 310 events. However, the statistics shown below is derived from only 241 events, for which the QA process is already completed.
The second project phase of the OECD FIRE project is scheduled from 2006 to 2008. Whereas the first project phase has been focused on data collection, the aim of the second project phase is to perform more detailed analyses, which are to be carried out within the OECD FIRE project by the participating organizations as soon as a sufficient number of events becomes available in the database. However, such analysis results will not be available in the near-term but may be generated at the end of the second phase of the OECD FIRE project in 2008.
DATABASE STRUCTURE
The OECD FIRE event is described by the narrative event description and a number of coded descriptive fields with attributes selectable from predefined menus. The source of information normally is the narrative event description; the entries in the coded fields are derived from the narrative event description. Tables 1 and 2 summarize this structure.
Through coded attributes, the classifications of the OECD FIRE database provide the possibility to search for and identify specific fire events of interest and their specific features for a wide range of applications.
To facilitate the use of the collected data for particular applications, relevance indices grading both the completeness and the quality of the data are assigned to each of the narrative and coded fields.
Table 1. Narrative part in the OECD FIRE database
Event description: A short description or title of the event, followed by a detailed factual description of the fire event, including all relevant circumstances
Sequence of events: A structured record of the sequence of the event in form of a bullet list with time and description of the event. The reader should be able to understand how the event developed in time Event interpretation: Further explanations and interpretation, if required
Ignition phase comments: Further details and comments on the fire ignition phase
Extinguishing phase comments: Further details and comments on the fire extinguishing phase Comments on consequences and corrective actions
Table 2. Coded fields in the OECD FIRE database
Ignition phase: The initial course of the fire including items such as location of the fire, type of detection, fire loads, ignition mechanism and root cause
Extinguishing phase: The course of the event after the fire alarm trigged (type of extinguishing equipment used, who extinguished the fire)
Consequences: Heat and smoke influence on plant operation and systems are described (by use of codes); secondary effects and corrective actions are included
References: References used, and where to find more information on the specific fire event
STATISTICAL OBSERVATIONS
The basic statistical information on fire relevant issues is derived from the database and presented in the format of bar charts. On the ordinate of each chart those attributes are listed that turned out to be important for the considered issue. Numbers of occurrence of the selected attributes are shown on the abscissa.
The presented statistics is not exhaustive, i.e. only significant contributors to the various issues are displayed. In several of the bar charts more than one item contributed to a bar. Therefore the sum of the length of the bars may exceed the number of reported events. This is mentioned in the respective figure captions.
Some countries such as Finland and Sweden report all fire events in their plants; others such as Germany and the U.S. report only events above a certain severity level. Therefore, the spectrum of events may be tilted towards the more severe ones.
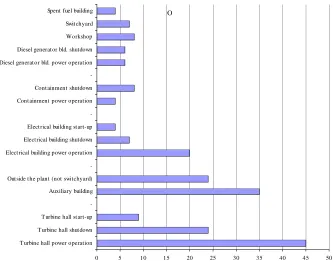
Fig. 1 shows that dominant contributions are from the turbine building, the auxiliary building and the electrical building. The large amount of fires in the turbine building results from oil igniting on hot equipment (e.g. bearings, pipes). Fires in the containment mostly happened during shutdown periods and are mainly due to hot work.
Apart from fires caused by hot work on various structural elements and components, a majority of fires originated at high or medium voltage electrical equipment such as transformers, turbine generators, bus bars, motors, and power cables (Fig. 2). As the data collection includes many small fires that were quickly extinguished, the contributions of “miscellaneous” and “other components” as components where the fire started are fairly high. It comprises plastic sheets and bins, garbage sacks, fabric soaked with flammable liquid, mobile vacuum cleaners and other general plant and transient material.
The ignition mechanism (Fig. 3) is dominated by electrical problems such as insulation faults, arcing, followed by overheating of components, hot work (mostly welding), and mechanical problems such as heat generation by excessive friction in damaged bearings.
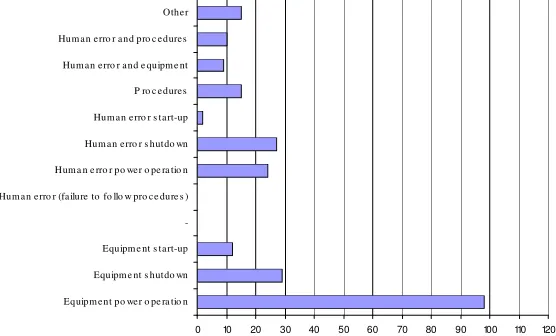
Fig. 4 shows that two thirds of the fires were caused by equipment problems; the remaining one third involved some kind of human errors. Most of the fires were detected by a fire alarm system illustrating the significance of the proper location and maintenance of such equipment (Fig. 5). Detection by workers or plant personnel at the scene where the fire started was also important, in particular in the event of fires caused by hot work.
"Normal" dominates in Fig. 6, indicating the good response of the systems when they were challenged. “Not applicable” is also relatively large and mainly result from situations of fires detected early and subsequently extinguished quickly by plant personnel available in the fire area, and fires at locations without detectors, for example outside buildings. Excluding the "Not applicable" cases, the fire detection systems are seen to have performed as intended in almost all real demand situations.
Most of the fires were detected by automatically actuated smoke and heat detectors. The amount of “not applicable” for fire detection is relatively high; it mainly comprises fires at locations without detectors, for example, outside buildings. The number of "no detector actuation" is also relatively high; it mainly refers to fires that were extinguished by plant personnel before the fire detectors were actuated. "Unknown" mainly refers to cases with alarms being triggered, but the inability to trace the alarm actuation to specific detectors.
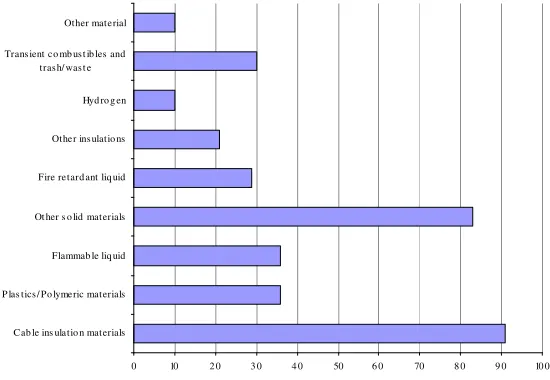
The individual materials shown in the Fig. 7 constitute fire loads also in combination with other materials. Therefore, the sum of all bars is larger than the number of events. Cable insulation material was the most common fire load, consistent with the dominance of electrical ignition mechanisms. It also includes events, for which this was not explicitly coded, but the event description suggests that cable insulation material was amongst the fire loads. Other solid materials are also high. Together with transient combustibles and trash/waste it, reflects the high share of small fires.
Most of the fires were extinguished by manual fire fighting means, self-extinguishing fires were also significant, as well as isolation of the fire source (which is also a manual action). As shown in Fig. 8, all combinations of actions include manual actions; successful fire extinguishing is strongly dominated by manual actions.
Among the available fire extinguishing means with different extinguishing media, the use of water hoses, dry chemicals and carbon dioxide is dominant. “not applicable” mainly refers to self-extinguished fires. The high share of “unknown” in Fig. 9 results from small fires that occurred many years ago and which are poorly described, making it impossible to identify the equipment used.
In sixty-five percent of demands for fire fighting the initial attempt at fire suppression was successful; but in twelve percent of the cases several attempts, using redundant means, were required.
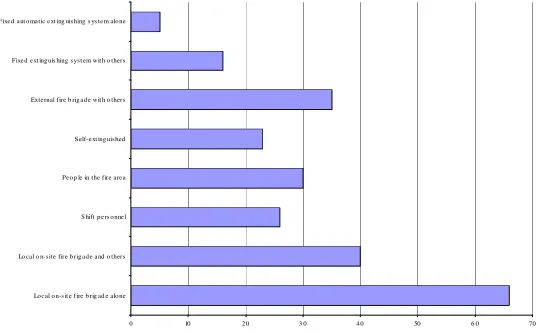
Fig. 10 shows the number of those events, where fire fighting teams/features were involved, also in combination with others. Therefore, the sum of all bars is larger than the number of events:
• Most fires were extinguished by the local on-site fire brigade, either alone or in combination with other teams;
• Extinguishing by shift personnel and other people available in the fire area, as well as “self-extinguished” was also important,;
• The plant external fire brigade alone was rarely needed (only 5 cases, not shown in the diagram) but its intervention was crucial in the event of severe fires.
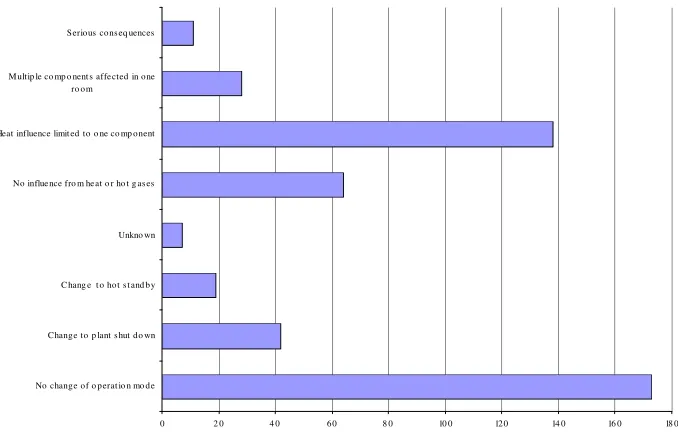
• Fixed fire extinguishing systems were automatically actuated only in the event of transformer fires. The upper three bars in Fig. 11 show the effect of fires on the operation mode. The operation mode remained unchanged in seventy-four percent of the reported fires, in seventeen percent of the events the plant was shut down, and in eight percent of the cases the operation mode was changed from operation to hot standby.
The lower group of bars shows the effects of fires on plant systems and fire barriers. There was no influence of heat or hot gases on the plant in twenty-six percent of the cases, and heat influence was limited to only one component in fifty-seven percent of the fires. Twelve percent of the fires affected multiple components in one room, and less than five percent led to serious consequences such as “total loss of one room”, affected “more than one fire compartment”, and “structural damage/collapse”.
O
0 5 10 15 20 25 30 35 40 45 50 Turbine hall power operation
Turbine hall shutdown Turbine hall start-up -Auxiliary building Outside the plant (not switchyard) -Electrical building power operation Electrical building shutdown Electrical building start-up -Containment power operation Containment shutdown -Diesel generator bld. power operation Diesel generator bld. shutdown Workshop Switchyard Spent fuel building
0 5 10 15 20 25 30 35 40 45
High vo ltage trans fo rm er Me dium and lo w vo ltage trans fo rm er Turbine ge nerato r Bus bar Hea ter Elec tric mo to r P o wer c able High o r m edium vo ltage elec tric cabinet Lo w vo ltage elec tric cabinet Die s el ge nerato r Va lves Othe r co m po ne nts S tructure s , co m po ne nts with ho t wo rk Mis c ellaneo us m aterial
Fig. 2. Component where the fire started versus number of events
0 10 2 0 3 0 4 0 50 6 0 70 8 0 9 0
Elect rical, p o wer o p werio n Elect rical, s hut d o wn Electrical, s t art -up Ho t co mp o nent , p o wer o p eratio n. Ho t co mp o nent , s hut d o wn Ho t co mp o nent , s t art -up Ho t wo rk, p o wer o p erat io n Ho t wo rk, s hut d o wn Mechanical, p o wer o p erat io n Me chanical, s hut d o wn Mechanical, s t art -up S elf-ig nit io n, p o wer o p eratio n. Self-ig nitio n, s t art -up Ot her
Fig. 3. Ignition mechanism versus number of events
0 10 20 30 40 50 60 70 80 90 100 110 120
Equipment po wer o pe ra tio n Equipme nt s hutdo wn Equipme nt s tart-up -Human erro r (failure to fo llo w pro ce dure s ) Huma n e rro r po wer o pe ra tio n Human erro r s hutdo wn Human erro r s tart-up P ro c edures Human erro r and e quipme nt Human erro r and pro c edures Other
0 2 0 4 0 60 8 0 10 0 120 Fire alarm system
Plant personnel Plant walkd own Plant walkd own and ind irect signals Fire alarm syst em and plant personnel Ind irect signal Fire alarm system and ind irect signals Fire guard/ watch Ot her co mbinat ions
Fig. 5. Type of fire detections versus number of events
0 20 4 0 6 0 80 10 0 12 0 140 160 180
No rmal No t ap plicable M alfunct ion No informat ion
Fig. 6. Fire Detection Systems Performance versus number of events
0 10 2 0 3 0 4 0 50 6 0 70 8 0 9 0 10 0
Cab le ins ulatio n materials Plas tics/ Po lymeric materials Flammab le liq uid Ot her s o lid materials Fire retard ant liq uid Other insulatio ns Hyd ro g en Transient co mb ust ib les and
trash/ wast e Other material
0 2 0 4 0 6 0 8 0 100 120 140 160 M anual fire fighting
Self-exting uis hing and manual fire fighting Is olation o f fire s ource m manual fire
fig hting Fixed s ystem - automatic actuatio n and
manual fire fig hting Fixed s ystem - manual actuatio n Fixed s ystem - manual actuatio n
andmanual fire fig hting Fixed system - auto matic actuatio n
Unkno wn
Fig. 8. Type of extinguishing versus number of events
0 10 2 0 3 0 4 0 50 6 0 70
Dry chemical (p o rtab le) Water ho s e Carb o n d io xid e Gas (p o rtab le) Other p o rtab le eq uip ment Sp ray water d elug e and wet
sp rinkler Fixed inert g as s ys tem
Unkno wn No t ap p licab le
Fig. 9. Type of system/equipment versus number of events
0 10 20 3 0 40 50 6 0 70
Local on-s it e fire brig ad e alone Lo cal o n-site fire brigade and o thers Shift pers onnel Peop le in the fire area Self-ext inguished External fire b rigade wit h o thers Fixed ext inguis hing syst em wit h o thers Fixed aut omatic ext ing uishing s ys tem alone
0 2 0 4 0 60 8 0 10 0 120 14 0 16 0 18 0 No change of o perat io n mo de
Change to p lant shut do wn C hang e t o hot st and by Unkno wn No influence fro m heat o r ho t g ases Heat influence limit ed to o ne co mp onent Multip le co mp o nent s affected in one
ro om Serious conseq uences
Fig. 11. Consequences of fire versus number of events
CONCLUDING REMARKS
The number of collected event reports is still too low for making corroborated statistical inferences. The spectrum of events may also be tilted towards the more severe events because of the inhomogeneous reporting level. Yet, from the current contents of the database some fairly obvious observations can be made:
• Most fires originated in the turbine building, the auxiliary building and the electrical building. Fires in the containment mainly occurred during shutdown periods and were due to hot work.
• Most fires inside buildings originated at electrical equipment. The amount of fires caused by hot work is also significant.
• A little more than half of the fires were caused by equipment problems; the remaining ones involved some kind of human errors.
• Most of the fires were detected by automatically actuated smoke or heat detectors.
• Cable insulation materials are the most common fire load, consistent with the dominance of electrical ignition mechanisms.
• No (complete) malfunction of fire extinguishing systems has been reported. However, in thirteen percent of the reported events several fire fighting means had to be used to achieve success.
• Only few cases of severe fires have been reported to require an external fire brigade to extinguish the fire.
• Twelve percent of the fires affected multiple components in one room, and less than one percent affected more than one fire compartment.
• The share of fires occurring in the shut down or start-up mode is significantly higher than the percentage of time the plants are in these operating modes. This illustrates the increased susceptibility to fires while the plants are in theses modes of operation.
ACKNOWLEDGEMENT
Several experts from various organizations of the participating OECD member states and from OECD/NEA contributed to the OECD FIRE project in many ways by providing financial support for the project, by providing data to the database as well as project management and technical support to the OECD FIRE group, by participating in the PRG meetings, or by providing peer comments to the Coding Guidelines and Operating Manual, and by discussing the first results of potential database applications as well as this paper.