R E S E A R C H
Open Access
Audio video based fast fixed-point
independent vector analysis for multisource
separation in a room environment
Yanfeng Liang
*, Syed Mohsen Naqvi and Jonathon A Chambers
Abstract
Fast fixed-point independent vector analysis (FastIVA) is an improved independent vector analysis (IVA) method, which can achieve faster and better separation performance than original IVA. As an example IVA method, it is designed to solve the permutation problem in frequency domain independent component analysis by retaining the higher order statistical dependency between frequencies during learning. However, the performance of all IVA methods is limited due to the dimensionality of the parameter space commonly encountered in practical
frequency-domain source separation problems and the spherical symmetry assumed with the source model. In this article, a particular permutation problem encountered in using the FastIVA algorithm is highlighted, namely the block permutation problem. Therefore a new audio video based fast fixed-point independent vector analysis algorithm is proposed, which uses video information to provide a smart initialization for the optimization problem. The method cannot only avoid the ill convergence resulting from the block permutation problem but also improve the separation performance even in noisy and high reverberant environments. Different multisource datasets including the real audio video corpus AV16.3 are used to verify the proposed method. For the evaluation of the separation performance on real room recordings, a new pitch based evaluation criterion is also proposed.
Introduction
The cocktail party problem was first described by Colin Cherry in 1953 [1]. Cherry and Taylor [2] further worked on this problem, which is captured by the question: “How do we recognize what one person is saying when others are speaking at the same time (the “cocktail party prob-lem”)?”. The problem relates to the situation where there are several people talking simultaneously in a room envi-ronment, and we only want to focus on one of them. For human beings, it is easy to focus attention on a target speaker. However, for a machine, it is much more difficult to achieve this goal. Solving the machine cocktail party problem requires the design of a method to focus on the desired speech signal while suppressing or ignoring all the other competing speech sounds [3]. Attempts to solve the machine cocktail party problem have come from the signal processing community in the form of blind source sepa-ration (BSS) [4] and generally from the computer science
*Correspondence: [email protected]
School of Electronic, Electrical and System Engineering, Loughborough University, Leicestershire, LE11 3TU, UK
community in the form of computational auditory scene analysis (CASA) [5]. CASA is motivated by understanding the human auditory scene analysis. While our focus in this article is signal processing based approaches such as blind source separation.
To address the BSS problem, many methods have been proposed. Herault and Jutten seem to have been the first who addressed the problem of blind source separation in 1985 [6]. In their study, the mixtures are assumed to be instantaneous in the standard BSS problem, which means that the sound would only be transmitted directly from the sources to the microphones without any delay. Com-mon formally established an instantaneous linear mixing model and clearly defined the term independent compo-nent analysis in 1994 [7]. Meanwhile, he also proposed an algorithm which can measure the independence by capturing higher-order statistics of the sources.
However, for a real room environment, the problem becomes more complicated because the acoustic sources take multiple paths to the microphone sensors due to the reflections from the ground, ceiling and walls. As such a
convolutive model is required to describe the sound prop-agation in a real room environment. Thus the practical speech separation problem becomes a convolutive blind source separation (CBSS) problem. During the last sev-eral decades, many efforts have been made on overcoming this problem [8]. Initially, solutions were posed in the time domain. However, since real room impulse responses are typically on the order of thousands of samples in length, the computational cost of these time domain methods renders them impractical. To mitigate this problem, a fre-quency domain solution was proposed by Parra [9]. As convolution in the time domain corresponds to multipli-cation in the frequency domain, the transformation into the frequency domain converts the convolutive mixing problem to that of independent complex instantaneous mixing operations at each frequency bin provided the transform block length is not too large. Transformation into the frequency domain reduces the computational cost, but there are two indeterminacies which are inherent to BSS, namely the scaling and permutation ambiguities, which are magnified in the frequency domain operation.
The scaling ambiguities across frequencies can be man-aged by matrix normalization [4,10-13]. On the other hand, the permutation ambiguities are more challenging to solve and various methods have been proposed [8]. All of these methods need prior knowledge about the loca-tions of the sources or post-processing exploiting some feature of the separated signals [14,15]. A new algorithmic approach to mitigate the permutation problem, named independent vector analysis (IVA), was proposed by Kim [16]. This approach can potentially preserve the higher order statistical dependencies and structures of signals across frequencies and thereby mitigate the permutation problem [17]. It avoids the need for post-processing, and thus it is a natural way to overcome the permutation prob-lem. Based on the original IVA method, several extended IVA methods have been recently proposed. An adaptive step size IVA method was proposed to improve the con-vergence speed by controlling the learning step size [18]. A fast fixed-point IVA method which applies Newton’s method to a contrast function of complex-valued vari-ables was given in [19] which achieves a fast and good separation performance.
For the FastIVA, although it can achieve fast conver-gence, sometimes it can still suffer a special permutation problem which we term as the “block permutation prob-lem”. Block permutation is different from the classical permutation problem. Block permutation means that the whole frequency range is divided into several blocks, each block containing several frequencies, and the intra-block permutation is consistent, but the inter-block permuta-tion is different. However, the classical permutapermuta-tion prob-lem means that the permutation is likely to be different for each frequency bin. In recent research study [20], a similar
problem with the convergence of IVA is termed as “partial permutation”, but without analysis about why this prob-lem can occur. In this article, this special probprob-lem is first highlighted and analytically demonstrated, we show that such ill-convergence can be mitigated by setting a good initialization of the unmixing matrix.
Initialization is important for the optimization problem because it can improve the convergence speed by ensur-ing a short cut convergence path avoidensur-ing local minimum points which yield poor separation. Source position infor-mation is important prior knowledge for setting a good initialization, and it can be obtained by audio localiza-tion or video localizalocaliza-tion. Audio localizalocaliza-tion for a single active speaker is difficult because human speech is an intermittent signal and contains much of its energy in the low-frequency bins where spatial discrimination is impre-cise. Audio localization can also be affected by noise and room environment. Additionally, audio localization is not always effective due to the complexity in the case of mul-tiple concurrent speakers [21]. Therefore, the accuracy of the audio localization would be degraded in a multisource real room environment with noise and reverberations, but video localization is robust in such an environment. On the other hand, video localization is not always effective, especially when the face of a human being is not visible to at least two cameras due to some obstacles, for exam-ple when the environment is cluttered, camera angle is wide, or illumination conditions are varying. For human beings, we not only use our ears to solve the cocktail party problem, but also our eyes. Thus, it is natural to com-bine video information into the solution. For audio-video combined source separation method, besides the direc-tion of arrival informadirec-tion, another type of combinadirec-tion is using lip reading for separation. For example, Wang et al. [22] and Rivet et al. [13] used this type of audio-video combination to help the separation. However, for a room environment such as AV16.3, it is not possible to do the lip reading due to practical environment. Therefore, we use cameras to capture the locations of the speakers in this article. Then the positions can be used to obtain a smart initialization for the convergence of the learning algorithm. Thus, we propose a new audio video based fast fixed-point independent vector analysis (AVIVA) method, which uses video information to initialize the algorithm. The issue of combined audio-video localization to pro-vide more robust input to the smart initialization is left as future study.
[23], which not only confirms the advantages of the pro-posed method, but also confirms the practical advantage of this study.
For real dataset, the separation performance evalua-tion becomes a problem. There is no objective evaluaevalua-tion method proposed to evaluate such real room recordings. Traditional evaluations are all based on prior knowledge such as the mixing filters or source signals. For instance, the performance index (PI) needs the mixing filters [10], and the interference ratio (SIR) or signal-to-distortion ratio (SDR) require the original speech sig-nals [24]. However, for a real recorded dataset, the only information we have is the audio mixtures. Therefore, a new evaluation method is needed without requiring any other prior knowledge. In this article, we employ a new evaluation method based on pitch information. It detects the pitches of all the separated signals, and then calculates the pitch differences between them, and thereby provides an objective relative evaluation between methods.
The article is organized as follows, in Section ‘Fast fixed-point independent vector analysis’, a brief summary of the FastIVA algorithm is provided. The reason for the block permutation problem of FastIVA is analyzed in Section ‘Block permutation problem of FastIVA’. Then the AVIVA approach is proposed in Section ‘Audio video based fast fixed-point independent vector analysis’. The pitch based evaluation method for the real dataset is introduced in Section ‘Pitch based evaluation for real recordings’, and the experimental results by using differ-ent multisource datasets are discussed in Section ‘Exper-iments and results’. Finally, conclusions are drawn in Section ‘Conclusions’.
Fast fixed-point independent vector analysis Model
The basic noise free blind source separation generative model in the time domain isx(t)=Hs(t), wherein, omit-ting the time indextfor convenience,x=[x1,x2,. . .,xm]T
is the observed mixed signal vector,s =[s1,s2,. . .,sn]T
is the source signal vector,His the mixing matrix with
m×ndimension, and(·)T denotes the transpose oper-ator. In this article, we focus on the exactly determined case, i.e.,m= n. Our target is to find the inverse matrix Wof mixing matrixH. Due to the scaling and permuta-tion ambiguities, we cannot generally obtainWuniquely. Actually,W=PDH−1, therefore,sˆ=Wx=PDs, where Pis a permutation matrix,Dis a scaling diagonal matrix, andsˆis the estimation of the source signal vectors.
In a real room environment, due to the reverberation, there are many pathes between the microphones and the sources, thus it is a convolutive case, which can be described as:
xi(t)= n
j=1
L−1
l=0
hij(l)sj(t−l) i=1,. . .,m (1)
wherehij(l),l=0,. . .,L−1 represents theL-tap impulse
response from sourcejto microphonei. In order to reduce the computational cost of the time domain methods, the source separation problems are generally solved in the frequency domain. Thus, the noise free model in the frequency domain is described as:
x(k)=H(k)s(k) (2)
ˆ
s(k)=W(k)x(k) (3)
where x(k) =[x(k)
1 ,x
(k) 2 ,. . .,x
(k)
m ]T is the observed
sig-nal vector in the frequency domain, and ˆs(k) = [sˆ1(k),sˆ2(k),. . .,sˆn(k)]Tis the estimated signal vector in the
frequency domain. The indexkdenotes thekth frequency bin. It is a multivariate model.
Independent vector analysis
Traditionally, independent component analysis (ICA) is the central tool for the blind source separation problem [11]. However, ICA cannot solve the permutation ambigu-ity by itself, but needs prior knowledge of source position or post processing based upon exploiting certain feature of the sources. In order to retain the dependency between different frequency bins, one method is the joint blind source separation based on multiset canonical correlation analysis [25], another widely used method is independent vector analysis, which is focused in this article. Inde-pendent vector analysis is a modification of indeInde-pendent component analysis by adopting multivariate quantities. It can preserve the higher order statistical dependencies between frequency bins and remove the dependencies between sources [17]. Thus it can address the permutation problem during learning without the help of other prior knowledge or post processing.
In order to separate multivariate sources from mul-tivariate observations, a cost function for mulmul-tivariate random variables is needed. The IVA method adopts Kullback-Leibler divergence between the joint probability density functionp(s1,ˆ . . .,ˆsn)and the product of
proba-bility density functions of the individual source vectors
q(ˆsi). This is used as the cost function of the IVA model.
J=KL(p(ˆs1,. . .,sˆn)||
q(sˆi))
= p(sˆ1,. . .,ˆsn)log
p(s1,ˆ. . .,ˆsn) q(sˆi)
dsˆ1,. . .,dˆsn
=const−
K
k=1
log|det(W(k))| − n
i=1
E[ logq(ˆsi)]
where E[·] denotes the statistical expectation operator, det(·) is the matrix determinant operator, andK is the number of frequency bins. The dependency between the source vectors would be removed but the dependency between the components of each vector can be retained, when the cost function is minimized.
The gradient descent method is adopted to minimize the cost function. By differentiating the cost function J
with respect to the coefficients of the separating matri-cesw(ijk), the update of the coefficients can be obtained as follows:
w(ijk)= − ∂J ∂w(ijk) =
wij(k)−H−Eϕ(k)(ˆsi(1),. . .,sˆi(k))x∗j(k)
(5)
where (·)H and (·)∗ denote the Hermitian transpose and the conjugate operators, respectively, and ϕ(k)(·) is the multivariate nonlinear function which can retain the higher order statistical dependency between frequency bins. As discussed in [17], the source prior is assumed to be the multivariate Laplacian distribution, and we can obtain a simple but effective form for the nonlinear func-tion as:
ϕ(k)(ˆs(i1),. . .,ˆs(ik))= ˆs (k) i
K
k=1 |ˆs(ik)|2
(6)
Fast fixed-point independent vector analysis
FastIVA is a fast form of IVA algorithm. It employs Newton’s method update rules, which converges quadrat-ically and is free from selecting an efficient learning rate. In order to apply Newton’s method in the update rules, a quadratic Taylor series polynomial approximation is introduced in the notations of complex variables which can be used for a contrast function of complex-valued variables [19]. The contrast function used by FastIVA is as follows:
J=
i
E
G
k |ˆs(ik)|2
−
k
λ(ik)(w(ik)(w(ik))H−1)
(7)
where,wi is theith row of the unmixing matrixW, and λi is theith Lagrange multiplier.G(·) is the nonlinearity function, which can take on several different forms as dis-cussed in [19]. The form of which is the main difference between FastIVA and FastICA. For FastIVA, it is a multi-variate function of the summation of the desired signals in
all frequency bins. With normalization, the learning rule is:
(w(ik))H ←E
G
k |ˆs(ik)|2
+ |ˆs(ik)|2G
k |ˆs(ik)|2
×w(ik) H
−E
(ˆs(ik))∗G
k |ˆs(ik)|2
xk
(8)
where G(·) andG(·)denote the derivative and second derivative ofG(·), respectively. And if this is used for all sources, an unmixing matrix W(k) can be constructed which must be decorrelated with
W(k)←(W(k)(W(k))H)−1/2W(k) (9)
We next discuss an important convergence problem which is encountered in FastIVA algorithm.
Block permutation problem of FastIVA
Although it is claimed that IVA algorithms can solve the permutation problem in frequency domain source sepa-ration, convergence can be affected by the dimensionality of the parameter space as in time domain algorithms [26]. Moreover, the spherical symmetry of the source model adopted by IVA algorithms can be a weakness. This kind of source model assumes that the dependencies between all frequency bins are the same. However, it is highly likely that the dependencies between frequency bins which are far away from each other are weak [27]. Thus, such spher-ical symmetry is a constraint which can lead to a block permutation problem. The block permutation problem means the separation alignment is different for blocks of frequency bins, which is a different problem from the conventional permutation problem in the frequency domain independent component analysis approaches. In this section, we will analyze the block permutation prob-lem based on a 2×2 exactly determined case when using the FastIVA algorithm.
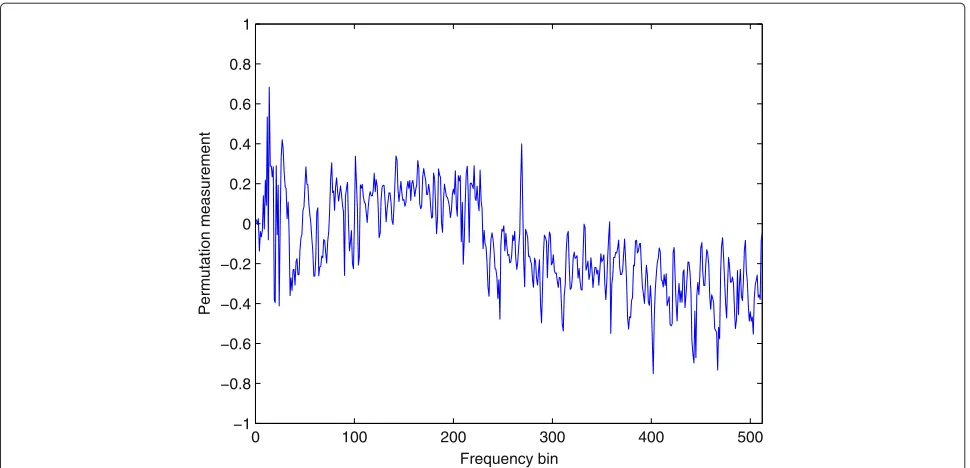
In order to observe the alignment across frequency bins, the permutation measurement (PM) for a 2×2 case is adopted [28].
PM(k)=abs
f11(k)f22(k) −abs
f12(k)f21(k) (10)
when the block permutation problem happens is shown in Figure 1.
The occurrence of the block permutation problem can be understood by examining the cost function. According to Equation (7), the cost function is:
J=E
G
k |ˆs(1k)|2
+E G k |ˆs(2k)|2
−
k
λ(1k)(w(1k)(w(1k))H−1)
−
k
λ(2k)(w(2k)(w(2k))H−1)
(11)
as in [19], where the Lagrange multiplierλ(ik)is:
λ(ik)=E
|ˆs(ik)|2G
k |ˆs(ik)|2
(12)
whereG(·)denotes the derivative ofG(·).
Here the spherical symmetric Laplace distribution is adopted as the source model. The correspondent nonlin-ear function is:
G(z)=√z (13)
Thus, the cost function becomes:
J=E
⎡
⎣
k |ˆs(1k)|2
⎤
⎦+E
⎡
⎣
k |ˆs(2k)|2
⎤ ⎦ − k E ⎡ ⎢ ⎣ |ˆs
(k)
1 |2
2k|ˆs(1k)|2 ⎤ ⎥
⎦(w(1k)(w1(k))H−1)
−
k E
⎡ ⎢ ⎣ |ˆs
(k)
2 |2
2k|ˆs(2k)|2 ⎤ ⎥
⎦(w(2k)(w2(k))H−1)
(14)
If the block permutation problem happens, there is a fre-quency bin block over the range [kb,ke] with a separation
alignment which is different from other frequency bins, andw1, w2 are exchanged. Therefore, the cost function becomes:
J1=E
⎡ ⎢ ⎣
kb−1
k=1
|ˆs(1k)|2+
ke
k=kb
|ˆs(2k)|2+
K
k=ke+1
|ˆs(1k)|2 ⎤ ⎥ ⎦ +E ⎡ ⎢ ⎣
kb−1
k=1
|ˆs(2k)|2+
ke
k=kb
|ˆs(1k)|2+
K
k=ke+1
|ˆs(2k)|2 ⎤ ⎥ ⎦
0 100 200 300 400 500 −1 −0.8 −0.6 −0.4 −0.2 0 0.2 0.4 0.6 0.8 1 Frequency bin Permutation Measurement
− kb−1
k=1
E ⎡ ⎢ ⎢ ⎢ ⎢ ⎢ ⎢ ⎣
|ˆs(1k)|2
2 kb−1
k=1
|ˆs(1k)|2+ ke
k=kb
|ˆs(2k)|2+ K
k=ke+1
|ˆs(1k)|2 ⎤ ⎥ ⎥ ⎥ ⎥ ⎥ ⎥ ⎦
×w(1k)(w1(k))H−1
− ke
k=kb
E ⎡ ⎢ ⎢ ⎢ ⎢ ⎢ ⎢ ⎣
|ˆs(2k)|2
2 kb−1
k=1
|ˆs(1k)|2+ ke
k=kb
|ˆs(2k)|2+ K
k=ke+1
|ˆs(1k)|2 ⎤ ⎥ ⎥ ⎥ ⎥ ⎥ ⎥ ⎦
×w(2k)(w(2k))H−1
− K
k=ke+1
E ⎡ ⎢ ⎢ ⎢ ⎢ ⎢ ⎢ ⎣
|ˆs(1k)|2
2 kb−1
k=1
|ˆs(1k)|2+ ke
k=kb
|ˆs(2k)|2+ K
k=ke+1
|ˆs(1k)|2 ⎤ ⎥ ⎥ ⎥ ⎥ ⎥ ⎥ ⎦
×w(1k)(w(1k))H−1
− kb−1
k=1
E ⎡ ⎢ ⎢ ⎢ ⎢ ⎢ ⎢ ⎣
|ˆs(2k)|2
2 kb−1
k=1
|ˆs(2k)|2+ ke
k=kb
|ˆs(1k)|2+ K
k=ke+1
|ˆs(2k)|2 ⎤ ⎥ ⎥ ⎥ ⎥ ⎥ ⎥ ⎦
×w(2k)(w2(k))H−1
− ke
k=kb
E ⎡ ⎢ ⎢ ⎢ ⎢ ⎢ ⎢ ⎣
|ˆs(1k)|2
2 kb−1
k=1
|ˆs(2k)|2+ ke
k=kb
|ˆs(1k)|2+ K
k=ke+1
|ˆs(2k)|2 ⎤ ⎥ ⎥ ⎥ ⎥ ⎥ ⎥ ⎦
×w(1k)(w(1k))H−1
− K
k=ke+1
E ⎡ ⎢ ⎢ ⎢ ⎢ ⎢ ⎢ ⎣
|ˆs(2k)|2
2 kb−1
k=1
|ˆs(2k)|2+ ke
k=kb
|ˆs(1k)|2+ K
k=ke+1
|ˆs(2k)|2 ⎤ ⎥ ⎥ ⎥ ⎥ ⎥ ⎥ ⎦
×w(2k)(w2(k))H−1
(15)
It is evident that when
ke
k=kb
|ˆs(1k)|2= ke
k=kb
|ˆs(2k)|2 (16)
is satisfied, the cost function has the same value, i.e.,
J =J1. This indicates that there is no penalty for the Fas-tIVA converging to a block permutation solution, which is also a global minimum as the correct solution. For the case where there are more sources, a similar analysis can also be used to confirm that the block permutation can happen.
To confirm the problem occurs regularly, we chose dif-ferent speech signals randomly from http://www.kecl.ntt. co.jp/icl/signal/sawada/demo/bss2to4/index.html, which is Hiroshi Sawada’s dataset, and positioned them at a vari-ety of different locations in a room environment to gen-erate microphone measurements by using image method. Then the FastIVA method was used to separate them. We found that approximately 30% of them suffer the block permutation problem which justifies the need to overcome the ill-convergence. Moreover, if the block per-mutation problem happens, when the separated signals in the frequency domain are transferred back into the time domain, the mixtures cannot be separated at all. So it is a significant problem for FastIVA. Therefore, a good ini-tialization is needed for the FastIVA to converge to the correct global minimum point.
Audio video based fast fixed-point independent vector analysis
Based on the analysis and discussion in the above section, it is necessary to set a proper initialization for the Fas-tIVA algorithm to mitigate the block permutation prob-lem. Moreover, a proper initialization can also achieve faster convergence and better performance, which is com-mon for optimization problem. In additional, such a video localization based algorithm can improve the separation performance especially when there is background noise and a high reverberant room environment, because audio localization can be seriously affected by such noise and reverberation.
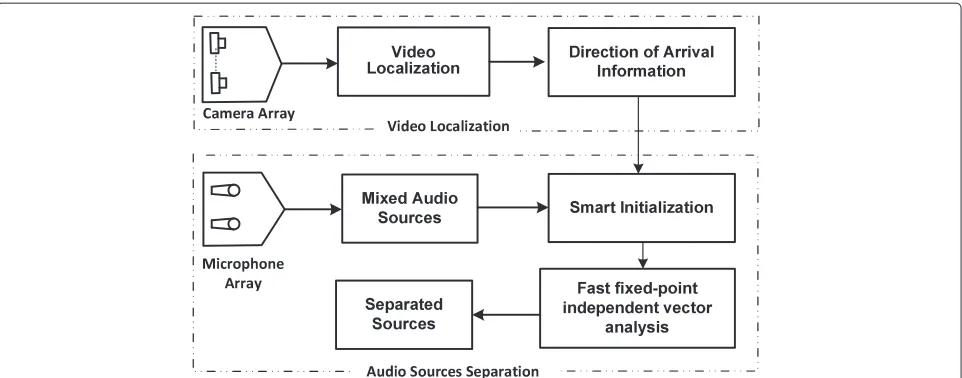
Figure 2Block figure of the AVIVA.Video localization is based on face and head detection. The visual location of each speaker is approximated after processing the 2D image information and obtained from at least two synchronized color video cameras through calibration parameters and an optimization method. The position of the microphone array and the output of the visual localizer are used to calculate the direction of arrival information of each speaker. Based on this information, a smart initialization is set for the FastIVA algorithm.
First, video localization based on face and head detec-tion is used to obtain the visual locadetec-tion of each speaker which is approximated after processing the 2D image information and obtained from at least two synchronized color video cameras through calibration parameters [29] and an optimization method [30].
After estimating the 3D position of each speakeri, the elevation (θi) and azimuth (φi) angles of arrival to the
center of the microphone array are calculated from
ri=
(uxi−u
xc)2+(uyi−u
yc)2+(uzi−u
zc)2 (17)
θi=tan−1
uyi−u
yc
uxi−u
xc
(18)
φi=sin−1
uyi−u
yc
risin(θi)
(19)
whereuxi,uyi, anduziare the 3D positions of the speaker
i, whileuxc,uyc, anduzc are Cartesian coordinates of the center of the microphone array.
Then the mixing matrix can be calculated under the plane wave propagation assumption by using the direction of arrival information.
H(k)=[h(k)(θ1,φ1),. . .,h(k)(θn,φn)] (20)
where
h(k)(θi,φi)=
⎡ ⎢ ⎢ ⎢ ⎢ ⎢ ⎢ ⎣
exp(−jκ(sin(θi)cos(φi)ux1+sin(θi)sin(φi)u
y1
+cos(θi)uz1))
.. .
exp(−jκ(sin(θi)cos(φi)uxm+sin(θi)sin(φi)u
ym +cos(θi)uzm))
⎤ ⎥ ⎥ ⎥ ⎥ ⎥ ⎥ ⎦
(21)
andκ =k/cwherecis the speed of sound in air at room temperature. The coordinatesuxi,uyi, anduzi are the 3D positions of theith microphone.
Thus, the initialization of the unmixing matrix can be obtained by following the approach in [12]
W(k)=Q(k)H(k) (22)
whereQis the whitening matrix. The above albeit biased estimation can be used as the initialization of the unmix-ing matrix of FastIVA rather than an identity matrix or random matrix. The real room recordings will be used to test this proposed method, and an evaluation criterion for real room recording will be presented in the following section.
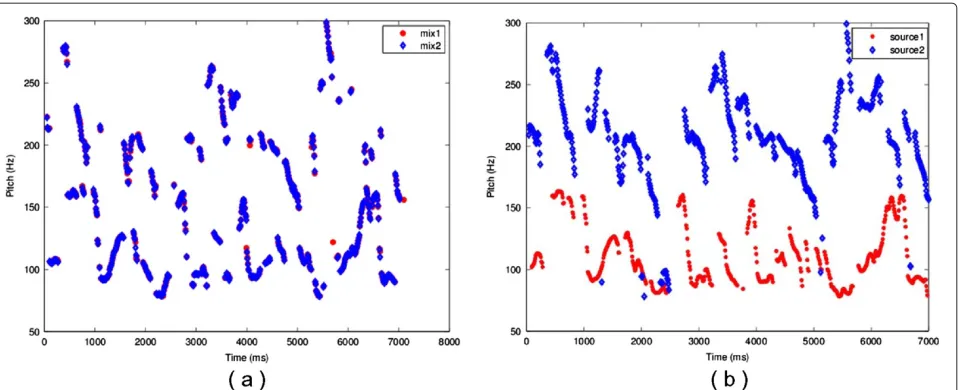
Pitch based evaluation for real recordings
Figure 3Comparison of the pitch of a mixture signal and separated signals.(a)the pitches of the mixed signals,(b)the pitches of separated signals.
features which can help to evaluate the separation perfor-mance, because different speech sections at different time slots have different pitches [31] provided that the orig-inal sources do not have substantially overlapping pitch characteristics. We adopt the sawtooth waveform inspired pitch estimator (SWIPE) method [32], which has better performance compared with traditional pitch estimators.
Figure 3a shows that the pitches of the mixed sig-nals are still mixed, while the pitches of the source signals in Figure 3b are well separated. It is obvious
that good separated pitches can indicate good separa-tion performance provided that the original sources do not have substantially overlapping pitch characteristics. In order to evaluate objectively, we calculate the pitch differences:
pdiff(t)=
i=j
(pi(t)−pj(t))2i,j=1,. . .,mandt=1,. . .,T
(23)
0 100 200 300 400 500 0
0.5 1
Frequency bin
Performance Index
FastIVA algorithm
0 100 200 300 400 500 −1
−0.5 0 0.5 1
Frequency bin
Permutation Measurement
Table 1 Separation performance comparison when block permutation problem happens
FastIVA AVIVA
SDR (dB) SIR (dB) SDR (dB) SIR (dB)
Two sources 2.81 4.12 6.11 7.35
Three sources 0.12 1.06 6.63 8.42
where T is the number of time slots. Then we set a thresholdpthr, if the pitch difference is greater than the threshold at a certain time slot, we can consider that the mixed signals are separated at that time slot and set the separation status equal to 1, otherwise 0, as defined by
sep status(t)=
1 if pdiff(t) >pthr
0 otherwise (24)
Finally, we can calculate a separation rate to evaluate the separation performance.
sep rate=
tsep status(t)
T (25)
The separation performance improves as the separation rate increases. We need to highlight here that it can-not evaluate the absolute quality of the separated speech signal, but it can be used for comparing the separation performance when using different separation methods.
Experiments and results
In this section, we will show three different kinds of exper-imental results by using different multisource datasets to
show the advantage of the proposed AVIVA algorithm. The first experiment will show that the proposed AVIVA algorithm can successfully avoid the block permutation problem. The second experiment will demonstrate the advantage of AVIVA in the aspect of convergence speed and separation performance improvement in a noisy envi-ronment and in a high reverberant envienvi-ronment. The positions of the source speech signal are assumed known in these two experiments, and the initialization is based on these positions. The last experiment shows the proposed method used in a real application by using the real multi-source dataset. The 3D video localizer is used to capture the source positions.
Experimental demonstration of the block permutation problem
For the real room recordings, we can’t obtain the mixing filters, therefore we cannot observe the block permuta-tion visually. In the first simulapermuta-tion, we assume that we know the source signals and mixing filters to experimen-tally demonstrate the block permutation problem. The speech signals are from Hiroshi Sawada’s dataset, the web-site is http://www.kecl.ntt.co.jp/icl/signal/sawada/demo/ bss2to4/index.html. Each speech signal is approximately 7 s long. The image method was used to generate the room impulse responses, and the size of the room is [7, 5, 3], which represents the length, the width and the height, respectively, and the measure unit is meter. The DFT length is 1024, and RT60=200 ms. We use a 2×2 mixing case, for which the microphone positions are
0 100 200 300 400 500 0
0.5 1
Frequency bin
Performance Index
AVIVA approach
0 100 200 300 400 500 −1
−0.5 0 0.5 1
Frequency bin
Permutation Measurement
0 100 200 300 400 500 −1
−0.8 −0.6 −0.4 −0.2 0 0.2 0.4 0.6 0.8 1
Frequency bin
Permutation measurement
Figure 6One permutation measurement of the separation result for three sources when using FastIVA.
[3.48, 2.50, 1.50] and [3.52, 2.50, 1.50], respectively in Cartesian coordinates. The sampling frequency is 8 kHz. The separation performance is evaluated objectively by performance index (PI) [10], the signal-to-distortion ratio (SDR) and signal-to-interference ratio (SIR) [24]. The toolbox used for calculating the SDR and SIR can be obtained from the website http://sisec2010.wiki.irisa.fr/ tiki-index.php.
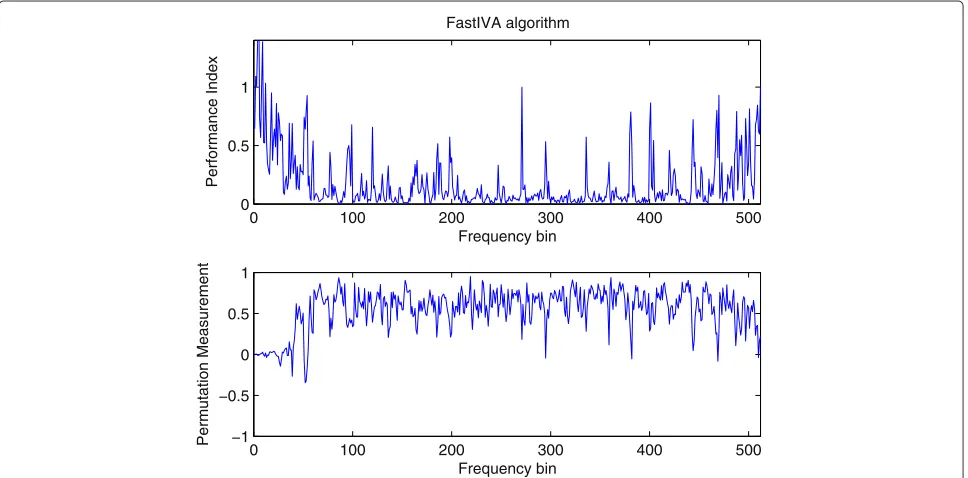
We chose two speech signals, and placed them at posi-tions [4.8, 3.25, 1.5] and [2.75, 3.8, 1.5], whose azimuth angles are, respectively, 60 and−30° with reference to the normal to the microphones. Then the FastIVA method is used to separate the mixtures. The result is shown in Figure 4. The frequency bin range [0, 512] corresponds to [0, 4000] Hz as the sampling frequency is 8 kHz. The upper part of the figure is the performance index, the
0 100 200 300 400 500 −1
−0.8 −0.6 −0.4 −0.2 0 0.2 0.4 0.6 0.8 1
Frequency bin
Permutation measurement
0 100 200 300 400 500 0
0.5 1
Frequency bin
Performance Index
FastIVA algorithm
0 100 200 300 400 500 −1
−0.5 0 0.5 1
Frequency bin
Permutation Measurement
Figure 8Separation performance of FastIVA in the noisy environment.The upper part is the performance index figure, and the bottom part is the permutation measurement figure.
closer it is to zero, the better the separation performance. And the bottom part is the permutation measurement (PM). It is clear that there is a block permutation problem. Thus the mixtures cannot be properly separated by Fas-tIVA. The objective measurements are shown in Table 1.
SDR is 2.81 dB and SIR is 4.12 dB, which also confirms that it is still mixed.
Then, the proposed AVIVA method is used to separate the mixtures. The result is shown in Figure 5. It confirms that the block permutation problem has been solved. As
0 100 200 300 400 500 0
0.5 1
Frequency bin
Performance Index
FastIVA algorithm
0 100 200 300 400 500 −1
−0.5 0 0.5 1
Frequency bin
Permutation Measurement
Table 2 Separation performance comparison in noisy environment
FastIVA AVIVA
Iterations SDR SIR Iterations SDR SIR
(dB) (dB) (dB) (dB)
mixtures 1 30 3.68 7.00 21 6.34 10.70
mixtures 2 28 6.60 10.68 25 7.01 11.47
mixtures 3 23 7.51 14.16 14 7.61 14.41
mixtures 4 26 6.33 11.27 11 6.76 12.79
mixtures 5 22 6.24 12.38 15 6.45 13.30
such, the performance is improved, which can be verified by the performance index figure in Figure 5. Moreover, the objective measurement SDR is 6.11 dB and SIR is 7.35 dB, which confirms the mixtures are better separated.
Then we use a 3×3 mixing case to confirm the block permutation problem, for which the microphone posi-tions are [3.46, 2.50, 1.50], [3.50, 2.50, 1.50], and [3.54, 2.50, 1.50], respectively. We chose three speech signals, and placed them at positions [4.80, 3.25, 1.5], [3.50, 4.00, 1.50], and [2.75, 3.8, 1.5], whose azimuth angles are, respectively, 60, 0, and−30° with reference to the normal to the microphones. For the 3×3 case, it is hard to use the permutation measurement directly, we need to calculate the permutation measurement of each 2×2 sub matrix in the 3×3 matrix. The FastIVA algorithm is first used to sep-arate the mixtures, and Figure 6 shows one permutation measurement which has the block permutation problem between source 1 and source 3. For the frequencies above frequency bin 220, the mean value of the permutation
measurement is negative, whereas for the other frequen-cies, the mean value is positive, which shows the block permutation problem. And the objective results shown in Table 1 confirm the bad separation, the SDR is 0.12 dB and SIR is 1.06 dB.
Then the AVIVA approach is used to separate the mixtures. The permutation measurement is shown in Figure 7. Combining with the objective measurements SDR and SIR, which are 6.63 and 8.42 dB, respectively, it confirms that the block permutation problem has been solved.
These simulations have confirmed that the block per-mutation problem can happen. And the experimental results verify that the AVIVA algorithm can avoid the block permutation problem successfully by using a proper initialization.
Experiments in noisy and reverberant room environment In the second simulation, we will show the separation performance of the AVIVA approach in a noisy envi-ronment to represent a multisource case. Moreover, we also show that the AVIVA approach can achieve better separation performance in a high reverberant environ-ment. The positions of the sources and microphones are assumed known to generate different reverberant envi-ronments by changing the absorption coefficients of the image method. We use a 2×2 mixing case, for which the microphone positions are [3.48, 2.50, 1.50] and [3.52, 2.50, 1.50], respectively. The noise is assumed to be Gaussian distributed and its standard deviation is selected to be 2.5% of the maximum magnitude of the speech signal. We chose different speech signals from the TIMIT dataset [33]. This simulation is used to show the AVIVA algorithm
Figure 11Room environment for one of the AV16.3 corpus recordings.(a)A single video frame from camera 1.(b)A single video frame from camera 2.
is suitable for different kinds of mixtures, and can achieve a better separation performance with faster convergence in a noisy environment. All the experiment parameters are the same as the 2×2 case in experiment 1. The separation performance is also evaluated by SDR and SIR.
First of all, we will show that the block permutation problem still can happen when using the TIMIT dataset in a noisy environment. We chose two speech signals from the TIMIT dataset, and placed them at positions [4.8, 3.25, 1.5] and [2.75, 3.8, 1.5], whose azimuth angles are, respectively, 60 and−30° with reference to the normal to the microphones. FastIVA and AVIVA are used to sep-arate the mixtures, respectively. The results are shown in Figures 8 and 9. When using the FastIVA algorithm, the objective separation performance SDR and SIR are 0.19 and 2.45 dB, which confirms the limited separation
performance. When using the AVIVA approach, the block permutation problem is solved and the SDR and SIR are 6.43 and 14.90 dB which indicate a good separation.
Then, we will show the convergence advantage of the AVIVA approach. We chose two different speech signals randomly from the TIMIT dataset and convolved them into two mixtures. Then FastIVA and AVIVA were used to separate the mixtures, respectively. Then we changed the source positions to repeat the simulation. For every pair of speech signals, three different azimuth angles for the sources relative to the normal to the microphone array were set for testing, these angles were selected from 30, 45, 60, and −30°. After that, we chose another pair of speech signals to repeat the above simulations. In total, we used five different pairs of speech signals (including combinations with one male speech signal and one female
0 500 1000 1500 2000 2500 3000 3500 4000 4500 5000
60 80 100 120 140 160 180 200 220 240 260
Time (ms)
Pitch (Hz)
mix1 mix2 mix3
0 500 1000 1500 2000 2500 3000 3500 4000 4500 5000 50
100 150 200 250 300
Time (ms)
Pitch (Hz)
source1 source2 source3
Figure 13The pitches of separated signal by FastIVA.
speech signal, combinations with two male speech sig-nals and combinations with two female speech sigsig-nals), and repeated the simulation for 15× at different posi-tions. Table 2 shows the average separation performance for each pair of speech signals.
The results shown in Table 2 confirm the advantage of the proposed AVIVA algorithm in that it can achieve a faster convergence and better separation performance in a noisy environment. The FastIVA is already a fast form algorithm, however, the AVIVA can improve the convergence speed approximately by 60%. Meanwhile,
the separation performances are also improved generally. Comparing with the FastIVA algorithm, the average fur-ther improvement in SDR is approximately 0.75 dB, and the average further improvement in SIR is approximately 1.4 dB.
Then, we chose a pair of speech signals randomly from the TIMIT dataset and placed them at the positions whose azimuth angles are 60 and −30 relative to the normal to the microphone array. The room reverberation RT60 changed from 200 to 700 ms to test the eparation ability of FastIVA and AVIVA algorithms in a high reverberant
0 500 1000 1500 2000 2500 3000 3500 4000 4500 5000
50 100 150 200 250 300 350
Time (ms)
Pitch (Hz)
source1 source2 source3
Table 3 Separation performance for the real room recordings
Time slot (s) FastIVA AVIVA
Iterations Separation Iterations Separation
Rate Rate
200–205 70 0.03 49 0.14
220–225 192 0.05 54 0.06
240–245 58 0.20 56 0.23
200–220 77 0.14 71 0.16
environment. The results are shown in Figure 10. The experimental results indicate that the AVIVA approach can consistently achieve better separation performance than FastIVA algorithm in different reverberant environ-ments. Comparing with the FastIVA algorithm, the aver-age further improvements in SDR and SIR are 2.4 and 2.9 dB, respectively.
Experiments by using the real room recordings
In the last simulation, we use the real room recordings AV16.3 corpus to test the proposed AVIVA algorithm [23]. “16.3” stands for 16 microphones and 3 cameras, recorded in a fully synchronized manner. We use the “seq37-3p-0001” recording to perform the experiment, which contains three speakers. Figure 11 shows the room environment, the positions of microphone arrays and the positions of the three speakers. There are two microphone arrays, we choose three microphones (mic3, mic5, and mic7) from microphone array 1 which is in the red circle. The audio sampling frequency of the recording is 16 kHz. The RT60 is approximately 700 ms, which means that it is a high reverberant environment and the accuracy of audio localization will be seriously affected. For this simulation, we used our proposed pitch based evaluation method, and the pitch threshold in (25) is set to 5, which has been found empirically.
We extracted the recorded speech from 200 to 205 s, during which three speakers are speaking simultaneously. Then, the positions of the speakers are obtained by using the video information. After that, FastIVA and AVIVA were applied, respectively. The experimental results are shown in Figures 12, 13, 14, and Table 3.
Figure 12 shows that the pitches of the mixed signals are all mixed. Figure 13 is the separation result by using Fas-tIVA. Although the pitches are separated to some extent, there are still many mixed pitches. Figure 14 is the separa-tion results by using AVIVA. It shows that the pitches are separated better compared with the result of FastIVA. The objective evaluation separation rate is shown in Table 3. Then we chose different time slots to repeat the simula-tion, and the results are also shown in Table 3. It is high-lighted that all the three speakers in this experiment are all male, and the proposed pitch based evaluation method
still works well. The experimental results indicate that the proposed AVIVA algorithm can be used in a real multi-source room environment successfully with faster conver-gence and better separation performance than FastIVA.
Conclusions
In this article, first, we analyzed the block permuta-tion problem of independent vector analysis methods. Then we proposed an AVIVA algorithm which can use the geometric information obtained from video to set a proper initialization. The proposed algorithm can avoid the block permutation problem of independent vector analysis methods. Moreover, it can also achieve a faster and better separation performance in a noisy environment and a high reverberant environment when compared with FastIVA. Meanwhile, we also proposed a pitch based eval-uation method for the real multisource dataset, which doesn’t need any prior information such as the mixing filters and source signals. The experimental results con-firm the advantages of the proposed AVIVA algorithm, and also verified that the proposed pitch based evalua-tion method can be used for comparing the separaevalua-tion performance.
Competing interest
The authors declare that they have no competing interests.
Received: 10 April 2012 Accepted: 27 July 2012 Published: 22 August 2012
References
1. C Cherry, Some experiments on the recognition of speech, with one and with two ears, J. Acoust. Soc. Am. 25, 975–979 (1953)
2. C Cherry, W Taylor, Some further experiments upon the recognition of speech, with one and with two ears, J. Acoust. Soc. Am.
26, 554–559 (1954)
3. S Haykin, Z Chen, The cocktail party problem, Neural Comput. 17, 1875–1902 (2005)
4. P Comon, C Jutten,Handbook of Blind Source Separation: Independent Component Analysis and Applications(Academic Press, San Diego, CA, 2009)
5. M Cooke, D Ellis, The auditory organization of speech and other sources in listeners and computational models, Speech Commun.
35, 141–177 (2001)
6. J Herault, C Jutten, B Ans. Detection de grandeurs primitives dans un message composite par une architecture de calcul neuromimetique en apprentissage non supervis, inProc. GRETSIVol 2 (Nice, France, 1985), pp. 1017–1022
7. P Comon, Independent component analysis—a new concept? Signal Process.36, 287–314 (1994)
8. MS Pedersen, J Larsen, U Kjems, LC Parra. A survey of convolutive blind source separation methods, inSpringer Handbook on Speech Processing and Speech Communication(Springer, New York, 2007), pp. 1–34 9. L Parra, C Spence, Convolutive blind separation of non-stationary sources,
IEEE Trans. Speech Audio Process.8, 320–327 (2000)
10. A Cichocki, S Amari,Adaptive Blind Signal and Image Processing: Learning Algorithms and Applications(Wiley, New York, 2003)
11. A Hyvarinen, J Karhunen, E Oja,Independent Component Analysis(Wiley, New York, 2001)
13. B Rivet, L Girin, C Jutten, Mixing audiovisual speech processing and blind source separation for the extraction of speech signals from convolutive mixtures, IEEE Trans. Audio Speech Lang. Process.
15, 96–108 (2007)
14. L Parra, C Alvino, Geometric source separation: merging convolutive source separation with geometric beamforming, IEEE Trans. Speech Audio Process.10, 352–362 (2002)
15. N Murata, S Ikeda, A Ziehe, An approach to blind source separation based on temporal structure of speech signals, Neurocomputing.41, 1–24 (2001)
16. T Kim, I Lee, TW Lee. Independent vector analysis: definition and algorithms, inFortieth Asilomar Conference on Signals, Systems and Computers 2006(Asilomar, USA, 2006), pp. 1393–1396
17. T Kim, H Attias, S Lee, T Lee, Blind source separation exploiting higher-order frequency dependencies, IEEE Trans. Audio Speech Lang. Process.15, 70–79 (2007)
18. Y Liang, S Naqvi, J Chambers. Adaptive step size indepndent vector analysis for blind source separation, in17th International Conference on Digital Signal Processing(Corfu, Greece, 2011), pp. 1–6
19. I Lee, T Kim, TW Lee, Fast fixed-point independent vector analysis algorithms for convolutive blind source separation, Signal Process. 87, 1859–1871 (2007)
20. T Itahashi, K Matsuoka, Stability of independent vector analysis, Signal Process.93, 1809–1820 (2012)
21. HK Maganti, D Gatica-Perez, I McCowan, Speech enhancement and recognition in meetings with an audio-visual sensor array, IEEE Trans. Audio Speech Lang. Process.15, 2257–2269 (2007)
22. W Wang, D Cosker, Y Hicks, S Sanei, JA Chambers. Video assisted speech source separation, inProc. ICASSP,vol 5 (Philadelphia, USA, 2005), pp. 425–428
23. G Lathoud, J Odobez, D Gatica-Perez. AV16.3: an audio-visual corpus for speaker localization and tracking, inProceedings of the MLMI’04 Workshop
(Martigny, Switzerland, 2004). LNCS 3361, pp. 182–195
24. E Vincent, C Fevotte, R Gribonval, Performance measurement in blind audio source separation, IEEE Trans. Audio Speech Lang. Process. 14, 1462–1469 (2006)
25. YU Li, T Adali, W Wang, VD Calhoun, Joint blind source separation by multiset canonical correlation analysis, IEEE Trans. Signal Process. 57(10), 3918–3929 (2009)
26. F Nesta, P Svaizer, M Omologo, Convolutive BSS of short mixtures by ICA recursively regularized across frequencies, IEEE Trans. Audio Speech Lang. Process.19, 624–639 (2011)
27. I Lee, GJ Jang, TW Lee, Independent vector analysis using densities represented by chain-like overlapped cliques in graphical models for separation of convolutedly mixed signals, Electron. Lett.
45, 710–711 (2009)
28. SM Naqvi, M Yu, JA Chambers, A multimodal approach to blind source separation of moving sources, IEEE J. Sel. Topics Signal Process. 4, 895–910 (2010)
29. RY Tsai, A versatile camera calibration technique for high-accuracy 3D machine vision metrology using off-the-shelf TV cameras and lenses, IEEE J. Robot. Autom.RA-3, 323–344 (1987)
30. R Hartley, A Zisserman,Multiple View Geometry in Computer Vision
(Cambridge University Press, Cambridge, 2001)
31. H Shabani, MH Kahaei. Missing feature mask generation in BSS outputs using pitch frequency, in17th International Conference on Digital Signal ProcessingCorfu, Greece, 2011, pp. 1–6
32. A Camacho, JG Harris, A sawtooth waveform inspired pitch estimator for speech and music, J. Acoust. Soc. Am.c.124(3), 1638–1652 (2008) 33. JS Garofolo, LF Lamel, WM Fisher, JG Fiscus, DS Pallett, NL Dahlgren, V
Zue. TIMIT acoustic-phonetic continuous speech corpus, inLinguistic Data Consortium. (Philadelphia, 1993)
doi:10.1186/1687-6180-2012-183
Cite this article as: Liang et al.: Audio video based fast fixed-point independent vector analysis for multisource separation in a room environment. EURASIP Journal on Advances in Signal Processing 2012 2012:183.
Submit your manuscript to a
journal and benefi t from:
7Convenient online submission 7Rigorous peer review
7Immediate publication on acceptance 7Open access: articles freely available online 7High visibility within the fi eld
7Retaining the copyright to your article