A Perceptual Model for Sinusoidal Audio Coding
Based on Spectral Integration
Steven van de Par
Digital Signal Processing Group, Philips Research Laboratories, 5656 AA Eindhoven, The Netherlands Email:[email protected]
Armin Kohlrausch
Digital Signal Processing Group, Philips Research Laboratories, 5656 AA Eindhoven, The Netherlands
Department of Technology Management, Eindhoven University of Technology, 5600 MB Eindhoven, The Netherlands Email:[email protected]
Richard Heusdens
Department of Mediamatics, Delft University of Technology, 2600 GA Delft, The Netherlands Email:[email protected]
Jesper Jensen
Department of Mediamatics, Delft University of Technology, 2600 GA Delft, The Netherlands Email:[email protected]
Søren Holdt Jensen
Department of Communication Technology, Institute of Electronic Systems, Aalborg University, DK-9220 Aalborg, Denmark Email:[email protected]
Received 31 October 2003; Revised 22 July 2004
Psychoacoustical models have been used extensively within audio coding applications over the past decades. Recently, parametric coding techniques have been applied to general audio and this has created the need for a psychoacoustical model that is specifically suited for sinusoidal modelling of audio signals. In this paper, we present a new perceptual model that predicts masked thresholds for sinusoidal distortions. The model relies on signal detection theory and incorporates more recent insights about spectral and temporal integration in auditory masking. As a consequence, the model is able to predict the distortion detectability. In fact, the distortion detectability defines a (perceptually relevant) norm on the underlying signal space which is beneficial for optimisation algorithms such as rate-distortion optimisation or linear predictive coding. We evaluate the merits of the model by combining it with a sinusoidal extraction method and compare the results with those obtained with the ISO MPEG-1 Layer I-II recommended model. Listening tests show a clear preference for the new model. More specifically, the model presented here leads to a reduction of more than 20% in terms of number of sinusoids needed to represent signals at a given quality level.
Keywords and phrases:audio coding, psychoacoustical modelling, auditory masking, spectral masking, sinusoidal modelling,
psychoacoustical matching pursuit.
1. INTRODUCTION
The ever-increasing growth of application areas such as con-sumer electronics, broadcasting (digital radio and televi-sion), and multimedia/Internet has created a demand for
This is an open-access article distributed under the Creative Commons Attribution License, which permits unrestricted use, distribution, and reproduction in any medium, provided the original work is properly cited.
A promising approach to achieve low bit rate coding of digital audio signals with minimum perceived loss of quality is to use perception-based hybrid coding schemes, where au-dio signals are decomposed and coded as a sinusoidal part and a residual. In these coding schemes, different signal com-ponents occurring simultaneously are encoded with diff er-ent encoders. Usually, tonal componer-ents are encoded with a specific encoder aimed at signals composed of sinusoids and the remaining signal components are coded with a waveform or noise encoder [5,6,7, 8,9]. To enable the selection of the perceptually most suitable sinusoidal description of an audio signal, dedicated psychoacoustical models are needed and this will be the topic of this paper.
One important principle by which auditory perception can be exploited in general audio coding is that the modelling error generated by the audio coding algorithm is masked by the original signal. When the error signal is masked, the modified audio signal generated by the audio coding algo-rithm is indistinguishable from the original signal.
To determine what level of distortion signal is allowable, an auditory masking model can be used. We, for example, consider the case where the masking model is used in a trans-form coder. Here the model will specify, for each spectro-temporal interval within the original audio signal, what dis-tortion level can be allowed within that interval such that it is perceptually just not detectable. With an appropriate signal transformation, for example, an MDCT filter bank [10,11], it is possible to selectively adapt the accuracy with which each different spectro-temporal interval is described, that is, the number of bits used for quantisation. In this way, the spectro-temporal characteristics of the error signal, can be adapted such that auditory masking is exploited effectively, leading to the lowest possible bit rate without perceptible dis-tortions.
Most existing auditory masking models are based on the psychoacoustical literature that predominantly studied the masking of tones by noise signals (e.g., [12]). Interestingly, for subband coders and transform coders the nature of the signals is just the reverse; the distortion is noise-like, while the masker, or original signal, is often tonal in character. Nev-ertheless, based on this psychoacoustical literature dedicated psychoacoustical models have been developed for audio cod-ing for the situation where the distortion signal is noise-like such as the ISO MPEG model [1].
Masking models are also used for sinusoidal coding, where the signal is modelled by a sum of sinusoidal com-ponents. Most existing sinusoidal audio coders, for exam-ple, [5,6,13] rely on masking curves derived from spectral-spreading-based perceptual models in order to decide which components are masked by the original signal, and which are not. As a consequence of this decision process, a number of masked components are rejected by the coder, resulting in a distortion signal that is sinusoidal in nature. In this paper a model is introduced that is specifically designed for predict-ing the maskpredict-ing of sinusoidal components. In addition, the proposed model takes into account some new findings in the psychoacoustical literature about spectral and temporal inte-gration in auditory masking.
This paper is organised as follows. InSection 2we discuss the psychoacoustical background of the proposed model. Next, in Section 3, the new psychoacoustical model will be introduced, followed by Section 4, which describes the cal-ibration of the model. Section 5 compares predictions of the model with some basic psychoacoustical findings. In
Section 6, we apply the proposed model in a sinusoidal audio modelling method and inSection 7we compare, in a listen-ing test, the resultlisten-ing audio quality to that obtained with the ISO MPEG model [1]. Finally, inSection 8, we will present some conclusions.
2. PSYCHOACOUSTICAL BACKGROUND
Auditory masking models that are used in audio coding are predominantly based on a phenomenon known as simulta-neous masking (see, e.g., [14]). One of the earlier relevant studies goes back to Fletcher [15] who performed listening experiments with tones that were masked by noise. In his experiments the listeners had to detect a tone that was pre-sented simultaneously with a bandpass noise masker that was spectrally centred around the tone. The threshold level for detecting the tones was measured as a function of the masker bandwidth while the power spectral density (spectrum level) was kept constant. Results showed that an increase of band-width, thus increasing the total masker power, led to an in-crease of the detection thresholds. However, this inin-crease was only observed when the bandwidth was below a certain crit-ical bandwidth; beyond this critcrit-ical bandwidth, thresholds were independent of bandwidth. These observations led to the critical band concept which is the spectral interval across which masker power is integrated to contribute to the mask-ing of a tone centred within the interval.
The implication of such experiments should be treated with care. When different maskers and signals are chosen, the resulting conclusions about the auditory filter shape are quite different. For example, a tonal masker proves to be a much poorer masker than a noise signal [17]. In addition, the fil-ter shapes seem to depend on the masker type as well as on the masker level. These observations suggest that the basic assumptions of linear, that is, level independent, auditory fil-ters and an energy criterion that defines audibility of distor-tion components, are only a first-order approximadistor-tion and that other factors play a role in masking. For instance, it is known that the basilar membrane behaves nonlinearly [18], which may explain, for instance, the level dependence of the auditory filter shape. For a more elaborate discussion of au-ditory masking and auau-ditory filters, the reader is referred to [19,20,21].
Despite the fact that the assumption of a linear auditory filter and an energy detector can only be regarded as a first-order approximation of the actual processing in the audi-tory system, we will proceed with this assumption because it proves to give very satisfactory results in the context of au-dio coding with relatively simple means in terms of compu-tational complexity.
Along similar lines as outlined above, the ISO MPEG model [1] assumes that the distortion or noise level that is allowed within a specific critical band is determined by the weighted power addition of all masker components spread on and around the critical band containing the distortion. The shape of the weighting function that is applied is based on auditory masking data and essentially reflects the under-lying auditory filter properties. These “spectral-spreading”-based perceptual models have been used in various para-metric coding schemes for sinusoidal component selection [5,6,13]. It should be noted that in these models, it is as-sumed that only the auditory filter centred around the dis-tortion determines the detectability of the disdis-tortion. When the distortion-to-masker ratio is below a predefined thresh-old value in each auditory filter, the distortion is assumed to be inaudible. On the other hand, when one single filter ex-ceeds this threshold value, the distortion is assumed to be audible. This assumption is not in line with more recent in-sights in the psychoacoustical literature on masking and will later in the paper be shown to have a considerable impact on the predicted masking curves. Moreover, in the ISO MPEG model [1], a distinction is made between masking by noisy and tonal spectral components to be able to account for the difference in masking power of these signal types. For this purpose a tonality detector is required which, in the Layer I model, is based on a spectral peak detector.
Threshold measurements in psychoacoustical literature consistently show that a detection threshold is not a rigid threshold. A rigid threshold would imply that if the signal to be detected would be just above the detection threshold, the signal would always be detected while it would never be detected when it would be just below the threshold. Contrary to this pattern, it is observed in detection threshold measure-ments that the percentages of correct detection as a function of signal level follow a sigmoid psychometric function [22].
The detection threshold is defined as the level for which the signal is detected correctly with a certain probability of, typ-ically, 70%–75%.
In various theoretical considerations, the shape of the psychometric function is explained by assuming that within the auditory system some variable, for example, the stim-ulus power at the output of an auditory filter, is observed. In addition, it is assumed that noise is present in this ob-servation due to, for example, internal noise in the au-ditory system. When the internal noise is assumed to be Gaussian and additive, the shape of the sigmoid function can be predicted. For the case that a tone has to be de-tected within broadband noise, the assumption of a stimu-lus power measurement with additive Gaussian noise leads to good predictions of the psychometric function. When the increase in the stimulus power caused by the presence of the tonal signal is large compared to the standard devia-tion of the internal noise, high percentages of correct de-tection are expected while the reverse is true for small in-creases in stimulus power. The ratio between the increase in stimulus power and the standard deviation of the internal noise is defined as the sensitivity index d and can be cal-culated from the percentage of correct responses of the sub-jects. This theoretical framework is based on signal detec-tion theory and is described more extensively in, for example, [23].
In several more recent studies it is shown that the audibil-ity of distortion components is not determined solely by the critical band with the largest audible distortion [24,25]. Buus et al. [24] performed listening tests where tone complexes had to be detected when presented in a noise masker. They first measured the threshold levels of several tones separately each of which were presented simultaneously with wideband noise. Due to the specific spectral shape of the masking noise, thresholds for individual tones were found to be constant across frequency. In addition to the threshold measurements for a single tone, thresholds were also measured for a com-plex of 18 equal-level tones. The frequency spacing of the tones was such that each auditory critical band contained only a single tone. If the detectability of the tones was only determined by the filter with the best detectable tone, the complex of tones would be just audible when one individual component of the complex had the same level as the mea-sured threshold level of the individual tones. However, the experiments showed that thresholds for the tone complex were considerably lower than expected based on the best-filter assumption, indicating that information is integrated across auditory filters.
dtotal, can be derived from the individual sensitivity indicesdn
as follows:
dtotal = K
n=1
d2
n, (1)
whereKdenotes the number of tones and where each indi-vidual sensitivity index is proportional to the tone-to-masker power ratio [22]. According to such a framework, each dou-bling of the number of auditory filters that can contribute to the detection process will lead to a reduction of 1.5 dB in threshold. The measured thresholds by Buus et al. are well in line with this prediction. In their experiments, the com-plex of 18 tones leads to a reduction of 6 dB in detection threshold as compared to the detection threshold of a sin-gle tone. Based on (1) a change of 6.3 dB was expected. More recently, Langhans and Kohlrausch [25] performed similar experiments with complex tones having a constant spacing of 10 Hz presented in a broadband noise masker, confirm-ing that information is integrated across auditory filters. In addition, results obtained by van de Par et al. [26] indicate that also for bandpass noise signals that had to be detected against the background of wideband noise maskers, the same integration across auditory filters is observed.
As indicated, integration of information across a wide range of frequencies is found in auditory masking. Similarly, integration across time has been shown to occur in the au-ditory system. Van den Brink [27] investigated the detection of tones of variable duration that were presented simultane-ously with a noise masker with a fixed duration that was al-ways longer than that of the tone. Increasing the duration of the tone reduced the detection thresholds up to a duration of about 300 milliseconds. While this result is an indication of integration across time, it also shows that there is a limitation in the interval for which temporal integration occurs.
The above findings with respect to spectral and tem-poral integration of information in auditory masking have implications for audio coding which have not been consid-ered in previous studies. On the one hand it influences the masking properties of complex signals as will be discussed inSection 5, on the other hand it has implications for rate distortion optimisation algorithms. To understand this, con-sider the case where for one particular frequency region a threshold level is determined for distortions that can be in-troduced by an audio coder. For another frequency region a threshold can be determined similarly. When both distor-tions are presented at the same time, the total distortion is expected to become audible due to the spectral integration given by (1). This is in contrast to the more conventional models, such as the ISO MPEG model [1], which would pre-dict this simultaneous distortion to be inaudible.
The effect of spectral integration, of course, can easily be compensated for by reducing the level of the masking thresh-olds such that the total distortion will be inaudible. But, based on (1), assuming that it holds for masking by com-plex audio signals, there are many different solutions to this equation which lead to the samedtotal. In other words, many
x
hom γi
+
Ca
Within channel distortion detectability
Di
Cs
+ x D
Figure1: Block diagram of the masking model.
different distributions of distortion levels per spectral region will lead to the same total sensitivity index. However, not every distribution of distortion levels will lead to the same amount of bits spent by the audio coder. Thus, the concept of a masking curve which determines the maximum level of dis-tortion allowed within each frequency region is too restric-tive and can be expected to lead to suboptimal audio coders. In fact, spectral distortion can be shaped such that the associ-ated bit rate is minimised. For more information the reader is referred to a study where these ideas were confirmed by listening tests [28].
3. DESCRIPTION OF THE MODEL
In line with various state-of-the-art auditory models that have been presented in the psychoacoustical literature, for example, [29], the structure of the proposed model follows the various stages of auditory signal processing. In view of the computational complexity, the model is based on frequency domain processing and consequently neglects some parts of peripheral processing, such as the hair cell transformation which performs inherent nonlinear time-domain processing. A block diagram of the model is given inFigure 1. The model inputxis the frequency domain representation of a short windowed segment of audio. The window should lead to sufficient rejection of spectral side lobes in order to fa-cilitate adequate spectral resolution of the auditory filters. The first stage of the model resembles the outer- and middle-ear transfer functionhom, which is related to the filtering of
the ear canal and the ossicles in the middle ear. The transfer function is chosen to be the inverse of the threshold-in-quiet functionhtq. This particular shape is chosen to obtain an
ac-curate prediction of the threshold-in-quiet function when no masker signal is present.
The outer- and middle-ear transfer function is followed by a gammatone filter bank (see, e.g., [30]) which resembles the filtering property of the basilar membrane in the inner ear. The transfer function of annth-order gammatone filter has a magnitude spectrum that is approximated well by
γ(f)=
1 +
f −f
0
kERBf0
2−n/2
, (2)
where f0 is the centre frequency of the filter, ERB(f0) is the
the filter order which is commonly assumed to be 4, and
k=2(n−1)(n−1)!/π(2n−3)!!, a factor needed to ensure that
the filter indeed has the specified ERB. The centre frequencies of the filters are uniformly spaced on an ERB-rate scale and follow the bandwidths as specified by the ERB scale [31]. The power at the output of each auditory filter is measured and a constantCais added to this output as a means to limit the detectability of very weak signals at or below the threshold in quiet.
In the next stage, within-channel distortion detectabil-ities are computed and are defined as the ratios between the distortion and the masker-plus-internal noise seen at the output of each auditory filter. In fact, the within-channel dis-tortion detectabilityDiis proportional to the sensitivity in-dexdas described earlier. This is an important step; the dis-tortion detectability (ord) will be used as a measure of per-ceptual distortion. This perper-ceptual distortion measure can be interpreted as a measure of the probability that subjects can detect a distortion signal in the presence of a masking sig-nal. The masker power within theith filter due to an original (masking) signalxis given by
Mi= 1 N
f
hom(f)2γi(f)2x(f)2, (3)
whereNis the segment size in number of samples. Equiva-lently, the distortion power within theith filter due to a dis-tortion signalεis given by
Si= 1 N
f
hom(f)2
γi(f)2ε(f)2. (4)
Note that (1/N)|x(f)|2 denotes the power spectral density
of the original, masking signal in sound pressure level (SPL) per frequency bin, and similarly (1/N)|ε(f)|2 is the power
spectral density of the distorting signal. The within-channel distortion detectabilityDiis given by
Di= Si
Mi+ (1/N)Ca. (5)
From this equation two properties of the within-channel dis-tortion detectabilityDican be seen. When the distortion-to-masker ratioSi/Miis kept constant while the masker power is much larger than (1/N)Ca, distortion detectability is also constant. In other words, at medium and high masker levels the detectabilityDiis mainly determined by the distortion-to-masker ratio. Secondly, when the masker power is small compared to (1/N)Ca, the distortion detectability is indepen-dent of the masker power, which resembles the perception of signals near the threshold in quiet.
In line with the multiband energy detector model [23], we assume that within-channel distortion detectabilitiesDi
are combined into a total distortion detectability by an addi-tive operation. However, we do not add the squared sensitiv-ity indices as in (1), but we simply add the indices directly. Al-though this may introduce inaccuracies, these will later turn
out to be small. A benefit of this choice is that the distortion measure that will be derived from this assumption will have properties that allow a computationally simple formulation of the model (see (11)). In addition, recent results [26] show that at least for the detection of closely spaced tones (20 Hz spacing) masked by noise, the reduction in thresholds when increasing the signal bandwidth is more in line with a direct addition of distortion detectabilities than with (1). There-fore, we state that
D(x,ε)=CsLeff
i
Di (6)
=CsLeff
i
fhom(f)2γi(f)2ε(f)2
NMi+Ca , (7)
whereD(x,ε) is the total distortion detectability as it is pre-dicted for a human observer given an original signalxand a distortion signalε. The calibration constantCsis chosen such thatD =1 at the threshold of detectability. To account for the dependency of distortion detectability on the duration of the distortion signal (in line with [27]), a scaling factorLeffis
introduced defined as
Leff=min
L
300 ms, 1
, (8)
where L is the segment duration in milliseconds. Equa-tion (8) resembles the temporal integration time of the human auditory system which has an upper bound of 300 milliseconds [27].1
Equation (7) gives a complete description of the model. However, it defines only a perceptual distortion measure and
not a masking curve such as is widely used in audio coding nor a masked threshold such as is often used in psychoacous-tical experiments.
In order to derive a masked threshold, we assume that the distortion signalε(f)=A. Here,Ais the amplitude of the distortion signal andthe normalised spectrum of the dis-tortion signal such that2=1 which is assumed to
corre-spond to a sound pressure level of 0 dB. Without yet making an assumption about the spectral shape of, we can derive that, assuming thatD =1 at the threshold of detectability, the masked thresholdA2for the distortion signalis given
by
1
A2 =CsLeff
i
fhom(f) 2
γi(f)2(f)2
NMi+Ca . (9)
When deriving a masking curve it is important to con-sider exactly what type of signal is masked. When a mask-ing model is used in the context of a waveform coder, the
1An alternative definition would be to state thatL
eff=N, the total
distortion signal introduced by the coder is typically assumed to consist of bands of noise. For a sinusoidal coder, however, the distortion signal contains the sinusoids that are rejected by the perceptual model. Thus, the components of the distor-tion signal are in fact more sinusoidal in nature. Assuming now that a distortion component is present in only one bin of the spectrum, we can derive the masked thresholds for si-nusoidal distortions. We assume that(f)=v(fm)δ(f−fm) withv(fm) being the sinusoidal amplitude and fm the sinu-soidal frequency. Together with the assumption thatD=1 at the threshold of detectability,vcan be derived such that the distortion is just not detectable. In this way, by varying fm
over the entire frequency range, v2constitutes the masking
curve for sinusoidal distortions in the presence of a masker
x. By substituting the above assumptions in (7) we obtain
1
v2fm =CsLeff
i hom
fm 2γifm 2
NMi+Ca . (10)
Substituting (10) in (7), we get
D(x,ε)= f
ε(f)2
v2(f) . (11)
This expression shows that the computational load for calcu-lating the perceptual distortionD(x,ε) can be very low once the masking curvev2has been calculated. This simple form
of the perceptual distortion, such as given in (11), arises due to the specific choice of the addition as defined in (6).
4. CALIBRATION OF THE MODEL
For the purpose of calibration of the model, the constants
Cafor absolute thresholds andCsfor the general sensitivity of the model in (7) need to be determined. This will be done using two basic findings from the psychoacoustical literature, namely the threshold in quiet and the just noticeable differ-ence (JND) in level of about 0.5 - 1 dB for sinusoidal signals [33].
When considering the threshold in quiet, we assume that the masking signal is equal to zero, that is, x =0 and that the just detectable sinusoidal distortion signal is given by
ε(f) = htq(fm)δ(f − fm) for some fm, where htq is the
threshold-in-quiet curve. By substituting these assumptions in (7) (assuming thatD=1 corresponds to a just detectable distortion signal), we obtain
Ca=CsLeff
i
γifm 2. (12)
Note that (12) only holds ifi|γi(fm)|2is constant for allfm,
which is approximately true for gammatone filters.
We assume a 1 dB JND which corresponds to a masking condition where a sinusoidal distortion is just detectable in the presence of a sinusoidal masker at the same frequency, say
fm. For this to be the case, the distortion level has to be 18 dB lower than the masker level, assuming that the masker and distortion are added inphase. This specific phase assumption
is made because it leads to similar thresholds as when the masker and signal are slightly off-frequency with respect to one another, the case which is most likely to occur in au-dio coding contexts. We therefore assume that the masker signal is x(f) = A70δ(f − fm) and the distortion signal
ε(f)=A52δ(f −fm), withA70andA52being the amplitudes
for a 70 and 52 dB SPL sinusoidal signal, respectively. Using (3) and (7), this leads to the expression
1
Cs =Leff
i
hom
fm 2γifm 2A2 52
hom
fm 2γifm 2A270+Ca
. (13)
When (12) is substituted into (13), an expression is ob-tained whereCsis the only unknown. A numerical solution to this equation can be found using, for example, the bi-section method (cf. [34]). A suitable choice for fm would be fm = 1 kHz, since it is in the middle of the auditory range. This calibration at 1 kHz does not significantly reduce the accuracy of the model at other frequencies. On the one hand the incorporation of a threshold-in-quiet curve pre-filter provides the proper frequency dependence of thresh-olds in quiet. On the other hand, JNDs do not differ much across frequency both in the model predictions and humans.
5. MODEL EVALUATION AND COMPARISON
WITH PSYCHOACOUSTICAL DATA
To show the validity of the model, some basic psychoacous-tical data from listening experiments will be compared to model predictions. We will consider two cases, namely sinu-soids masked by noise and sinusinu-soids masked by sinusinu-soids.
Masking of sinusoids has been measured in several ex-periments for both (white) noise maskers [12,35] and for si-nusoidal maskers [36].Figure 2ashows masking curves pre-dicted by the model for a white noise masker with a spectrum level of 30 dB/Hz for a long duration signal (solid line) and a 200 millisecond signal (dashed line) with corresponding lis-tening test data represented by circles [12] and asterisks [35], respectively. Figure 2b shows the predicted masking curve (solid line) for a 1 kHz 50 dB SPL sinusoidal masker along with corresponding measured masking data [36]. The model predictions are well in line with data for both sinusoidal and noise maskers, despite the fact that no tonality detector was included in the model such as is conventionally needed in masking models for audio coding (e.g., [1]). Only at lower frequencies, there is a discrepancy between the data for the noise masker and the predictions by the model. The reason for this discrepancy may be that in psychoacoustical studies, running noise generators are used to generate the masker sig-nal rather than a single noise realisation, as it is done in au-dio coding applications. The latter case has, according to sev-eral studies, a lower masking strength [37]. This difference in
104
103
102
Frequency (Hz) 0
20 40 60 80 100
M
ask
ed
thr
eshold
(dB
SPL)
(a)
104
103
102
Frequency (Hz) 0
20 40 60 80 100
M
ask
ed
thr
eshold
(dB
SPL)
(b)
Figure2: (a) Masking curves predicted by the model for a white noise masker with a spectrum level of 30 dB/Hz for a long dura-tion signal (solid line) and a 200- millisecond signal (dashed line) with corresponding listening test data represented by the circles [12] and asterisks [35], respectively. (b) Masking curves for a 1 kHz 50 dB SPL sinusoidal masker. The dashed line is the threshold in quiet. Circles show data from [36].
As can be seen inFigure 2, the relatively weaker mask-ing power of a sinusoidal signal is predicted well by the model without the need for explicit assumptions about the tonality of the masker such as those included in, for ex-ample, the ISO MPEG model [1]. Indeed, in the case of a noise masker (Figure 2a), the masker power within the critical band centred around 1 kHz (bandwidth 132 Hz) is approximately 51.2 dB SPL, whereas the sinusoidal masker (Figure 2b) has a power of 50 dB SPL. Nevertheless, pre-dicted detection thresholds are considerably lower for the sinusoidal masker (35 dB SPL) than for the noise masker (45 dB SPL). The reason why the model is able to predict these data well is that for the tonal masker, the distortion-to-masker ratio is constant over a wide range of auditory filters. Due to the addition of within-channel distortion de-tectabilities, the total distortion detectability will be relatively large. In contrast, for a noise masker, only the filter centred on the distortion component will contribute to the total dis-tortion detectability because the off-frequency filters have a very low distortion-to-masker ratio. Therefore, the wideband noise masker will have stronger masking effect. Note that for narrowband noise signals, the predicted masking power, in line with the argumentation for a sinusoidal masker, will also be weak. This, however, seems to be too conservative [38].
101
100
Number of components 20
40 60 80 100
M
ask
ed
thr
eshold
(dB
SPL)
Figure 3: Masked thresholds predicted by the model (solid line) and psychoacoustical data (circles) [25]. Masked thresholds are ex-pressed in dB SPL per component.
A specific assumption in this model is the integration of distortion detectabilities over a wide range of auditory fil-ters. This should allow the model to predict correctly the threshold difference between narrowband distortion signals and more wideband distortion signals. For this purpose an experiment is considered where a complex of tones had to be detected in the presence of masking noise [25]. The tone complex consisted of equal-level sinusoidal components with a frequency spacing of 10 Hz centred around 400 Hz. The masker was a 0–2 kHz noise signal with an overall level of 80 dB SPL. The number of components in the complex was varied from one up to 41. The latter case corresponds to a bandwidth of 400 Hz, which implies that the tone complex covers more than one critical band. Equation (9) was used to derive masked thresholds. As can be seen inFigure 3, there is a good correspondence between the model predictions and the data from [25]. Therefore, it seems that the choice of the linear addition that was made in (6) did not lead to large discrepancies between psychoacoustical data and model pre-dictions.
To conclude this section, a comparison is made between predictions of the MPEG-1 Layer I [1] and the model pre-sented in this study which incorporates spectral integration in masking. The MPEG model is one of a family of mod-els used in audio coding that are based on spectral-spreading functions to model spectral masking. When the masking of a narrowband distortion signal is considered, it is assumed that the auditory filter that is spectrally centred on this dis-tortion signal determines whether the disdis-tortion is audi-ble or not. When the energy ratio between distortion sig-nal and masking sigsig-nal as seen at the output of this audi-tory filter is smaller than a certain criterion value, the dis-tortion is inaudible. In this manner the maximum allowable distortion signal level at each frequency can be determined which constitutes the masking curve. An efficient implemen-tation for calculating this masking curve is a convolution be-tween the masker spectrum and a spreading function both represented on a Bark scale. The Bark scale is a perceptu-ally motivated frequency scale similar to the ERB-rate scale [39].
104
103
102
Frequency (Hz) 0
20 40 60 80
Le
ve
l
(d
B
)
(a)
104
103
102
Frequency (Hz) 0
20 40 60 80
Le
ve
l
(d
B
)
(b)
Figure4: Masked thresholds predicted by the spectral integration model (dashed line) and the ISO MPEG model (solid line). The masking spectrum (dotted line) is for (a) a 1 kHz sinusoidal signal and (b) a short segment of a harpsichord signal.
filters. This can have a strong impact on the predicted mask-ing curves.Figure 4a shows the masking curves for a sinu-soidal masker at 1 kHz for the MPEG model (solid line) and the spectral integration model (dashed line). The spectrum of the sinusoidal signal is also plotted (dotted line), but scaled down for visual clarity. As can be seen, there is a reason-able match between both models, showing some differences at the tails. InFigure 4b, in a similar way the masking curves are shown but now resulting from a complex spectrum (part of a harpsichord signal). It can be seen that the masking curves differ systematically showing much smoother mask-ing curves for the spectral integration model as compared to the MPEG model. For the spectral integration model mask-ing curves are considerably higher in spectral valleys. This effect is a direct consequence of the spectral integration as-sumption that was adopted in our model (cf. (6)). In the spectral valleys of the masker, distortion signals can only be detected using the auditory filter centred on the distortion which will lead to relatively high masked thresholds. This is so because off-frequency filters will be dominated by the masker spectrum. However, detection of distortion signals at the spectral peaks of the masker is mediated by a range of auditory filters centred around the peak, resulting in rela-tively low masked thresholds. In this case the off-frequency filters will reveal similar distortion-to-masker ratios as the on-frequency filter. Thus, in the model proposed here, de-tection differences between peaks and troughs are smaller, resulting in smoother masking curves as compared to those observed in a spreading-based model such as the ISO MPEG model.
The smoothening effect is observed systematically in complex signal spectra typically encountered in practical sit-uations and represents the main difference between the spec-tral integration model presented here and existing spreading-based models.
6. APPLICATION TO SINUSOIDAL MODELLING
Sinusoidal modelling has proven to be an efficient technique for the purpose of coding speech signals [40]. More recently, it has been shown that this method can also be exploited for low-rate audio coding, for example, [41,42,43]. To account for the time-varying nature of the signal, the sinusoidal anal-ysis/synthesis is done on a segment-by-segment basis, with each segment being modelled as a sum of sinusoids. The si-nusoidal parameters have been selected with a number of methods, including spectral peak-picking [44], analysis-by-synthesis [41,43], and subspace-based methods [42].
In this section we describe an algorithm for selecting si-nusoidal components using the psychoacoustical model de-scribed in the previous section. The algorithm is based on the matching pursuit algorithm [45], a particular analysis-by-synthesis method. Matching pursuit approximates a sig-nal by a finite expansion into elements (functions) chosen from a redundant dictionary. In the example of sinusoidal modelling, one can think of such functions as (complex) ex-ponentials or as real sinusoidal functions. Matching pursuit is a greedy, iterative algorithm which searches the dictionary for the function that best matches the signal and subtracts this function (properly scaled) to form a residual signal to be approximated in the next iteration.
In order to determine which is the best matching func-tion or dicfunc-tionary element at each iterafunc-tion, we need to for-malise the problem. To do so, letD =(gξ)ξ∈Γbe a complete dictionary, that is, a set of elements indexed byξ∈Γ, where
Γis an arbitrary index set. As an example, consider a dictio-nary consisting of complex exponentialsgξ =ei2πξ(·). In this
case, the index setΓis given byΓ=[0, 1). Obviously, the in-dexing parameterξis nothing more than the frequency of the complex exponential. Given a dictionaryD, the best match-ing function can be found by, for each and every function, computing the best approximation and selecting that func-tion whose corresponding approximafunc-tion is “closest” to the original signal.
In order to facilitate the following discussion, we assume without loss of generality that gξ = 1 for all ξ. Given a particular functiongξ, the best possible approximation of the signalxis obtained by the orthogonal projection ofx onto the subspace spanned bygξ(seeFigure 5). This projection is given byx,gξgξ. Hence, we can decomposexas
x= x,gξgξ+Rx, (14)
whereRxis the residual signal after subtracting the projec-tionx,gξgξ. The orthogonality ofRxandgξimplies that
x
Rx gξ
x,gξgξ span(gξ)
Figure5: Orthogonal projection ofxonto span(gξ).
We can do this decomposition for each and every dictionary element and the best matching one is then found by selecting the elementgξfor whichRxis minimal, or, equivalently, for which |x,gξ|is maximal. A precise mathematical for-mulation of this phrase is
ξ=arg sup
ξ∈Γ
x,gξ. (16)
It must be noted that the matching pursuit algorithm is only optimal for a particular iteration. If we subtract the ap-proximation to form a residual signal and approximate this residual in a similar way as we approximated the original sig-nal, then the two dictionary elements thus obtained arenot
jointly optimal; it is in general possible to find two differ-ent elemdiffer-ents which together form a better approximation. This is a direct consequence of the greedy nature of the algo-rithm. The two dictionary elements which together are opti-mal could be obtained by projecting the signalxonto all pos-sible two-dimensional subspaces. This, however, is in general very computationally complex. An alternative solution to this problem is to apply, after each iteration, a Newton optimisa-tion step [46].
To account for human auditory perception, the unit-norm dictionary elements can be scaled [43], which is equiv-alent to scaling the inner products in (16). We will refer to this method as theweighted matching pursuit (WMP) algo-rithm. While this method performs well, it can be shown that it does not provide a consistent selection measure for elements of finite time support [47]. Rather than scaling the dictionary elements, we introduce a matching pursuit algo-rithm where psychoacoustical properties are accounted for by a norm on the signal space. We will refer to this method aspsychoacoustical matching pursuit(PAMP). As mentioned inSection 3(see (11)), the perceptual distortion can be ex-pressed as
D= f
ε(f)2
v2(f) =
f
a(f)ε(f)2, (17)
wherea=v−2. It follows from (10) that
a(f)=CsLeff
i
hom(f)2
γi(f)2
NMi+Ca . (18)
100 90 80 70 60 50 40 30 20 10 0
Number of sinusoids 0
20 40 60
P
er
ceptual
dist
o
rt
ion
Figure6: Perceptual distortion associated with the residual signal after sinusoidal modelling as a function of the number of sinusoidal components that were extracted.
By inspection of (18), we conclude thatais real and positive so that, in fact, the perceptual distortion measure (17) defines a norm
x2=
f
a(f)x(f)2. (19)
This norm is induced by the inner product
x,y =
f
a(f)x(f)y∗(f), (20)
facilitating the use of the distortion measure in selecting the perceptually best matching dictionary element in a matching pursuit algorithm. InFigure 6, the perceptual distortion as-sociated with the residual signal is shown as a function of the number of real-valued sinusoids that have been extracted for a short segment of a harpsichord excerpt (cf. (11)). As can be seen the perceptually most relevant components are selected first, resulting in a fast reduction of the perceptual distor-tion for the first components. For a detailed descripdistor-tion the reader is referred to [47,48]. The fact that the distortion de-tectability defines a norm on the underlying signal space is important, since it allows for incorporating psychoacoustics in optimisation algorithms. Indeed, rather than minimising the commonly usedl2-norm, we can minimise the
percep-tually relevant norm given by (19). Examples include rate-distortion optimisation [32], linear predictive coding [49], and subspace-based modelling techniques [50].
7. COMPARISON WITH THE ISO MPEG MODEL
IN A LISTENING TEST
reference and because of its frequent application, it is still a de facto state-of-the-art model.
Using the MPEG-1 psychoacoustic model masking curve directly in the PAMP algorithm for sinusoidal extraction is not reasonable because the MPEG-1 psychoacoustic model was developed to predict the masking curve in the case of noise maskees (distortion signals). It predicts for every fre-quency bin how much distortion can be added within the critical band centred around the frequency bin. This pre-diction is, however, too conservative in the case that tions are sinusoidal in nature since in this case the distor-tion energy is not spread over a complete critical band but is concentrated in one frequency bin only. Hence, we can adapt the MPEG-1 model by scaling the masking function with the critical bandwidth such that the model now predicts the detection thresholds in the case of sinusoidal distortion. The net effect of this compensation procedure is an increase of the masking curve at high frequencies by about 10 dB, thereby de-emphasizing high-frequency regions during si-nusoidal estimation. In fact, this masking power increase at higher frequencies reduces the gap between the mask-ing curves between the ISO MPEG model and the proposed model (cf.Figure 4) By applying this modification to the ISO MPEG model, and by extending the FFT order to the size of the PAMP dictionary, it is suited to be used in the PAMP method. The dictionary elements in our implementation of the PAMP method were real-valued sinusoidal functions windowed with a Hanning window, identical to the window used in the analysis-synthesis procedure described below.
In the following, we present results obtained by listening tests with audio signals. The signals are mono, sampled at 44.1 kHz, where each sample is represented by 16 bits. The test excerpts are Carl Orff, Castanet, C´eline Dion, Harpsi-chord Solo, contemporary pop music, and Suzanne Vega.
The excerpts were segmented into fixed-length frames of 1024 samples (corresponding to 23.2 milliseconds) with an overlap of 50% between consecutive frames using a Han-ning window. For each signal frame, a fixed number of per-ceptually relevant sinusoids per frame were extracted using the PAMP method described above, where the perceptual weighting functions awere generated from masking curve derived from the proposed perceptual model (see (18)) and the modified MPEG model described above, respectively. For the MPEG model we made use of the recommendations of MPEG Layer II, since these support input frame lengths of 1024 samples. The masking curves were calculated from the Hanning-windowed original signal contained within the same frame that is being modelled using the PAMP method. Finally, modelled frames were synthesized from the esti-mated sinusoidal parameters and concatenated to form mod-elled test excerpts, using a Hanning window-based overlap-add procedure.
To evaluate the performance of the proposed method, we used a subjective listening test procedure which is somewhat comparable to the MUSHRA test (multistimulus test with hidden reference and anchors) [51]. For each test excerpt, listeners were asked to rank 6 different versions: 4 excerpts modelled using the modified MPEG masking curve and fixed
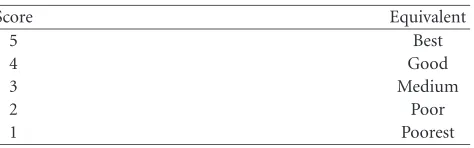
Table1: Scores used in subjective test.
Score Equivalent
5 Best
4 Good
3 Medium
2 Poor
1 Poorest
model orders (i.e., the number of sinusoidal components per segment) ofK = 20, 25, 30, andK = 35, and one excerpt modelled using the proposed perceptual model withK=25. In addition, to have a low-quality reference signal, an excerpt modelled with K = 30, but using the unmodified MPEG masking curve was included. As a reference, the listeners had the original excerpt available as well, which was identified to the subjects. Unlike the MUSHRA test, no hidden reference and no anchors were presented to the listeners.
The test excerpts were presented in a “parallel” way, us-ing the interactive benchmarkus-ing tool described in [52] as an interface to the listeners. For each excerpt, listeners were requested to rank the different modelled signals on a scale from 1–5 (in steps of 0.1) as outlined inTable 1. The lis-teners were instructed to use the complete scale such that the poorest-quality excerpt was rated with 1 and the highest-quality excerpt with 5. The excerpts were presented through high-quality headphones (Beyer-Dynamic DT990 PRO) in a quiet room, and the listeners could listen to each signal ver-sion as often as needed to determine the ranking. A total of 12 listeners participated in the listening test, of which 6 lis-teners worked in the area of acoustic signal processing and had previously participated in such tests. The authors did not participate in the test.
Figure 7shows the overall scores of the listening test, av-eraged across all listeners and excerpts. The circles represent the median score, and the error bars depict 25 and 75 per-cent ranges of the total response distributions. As can be seen, the excerpts generated with the proposed perceptual model (SiCAS@25) show better average subjective perfor-mance than any of the excerpts based on the MPEG psychoa-coustic model, except for the MPEG case using a fixed model order of 35 (MPEG@35). As expected, the MPEG-based ex-cerpts have decreasing quality scores for decreasing model order. Furthermore, the low-quality anchor (MPEG@30nt, i.e., the MPEG model without spectral tilt modification) re-ceived the lowest-quality score on average. The statistical difference between the quality scores was analysed using a paired t-test using a significance level of p < 0.01, and by working on the scoredifferencesbetween the proposed per-ceptual model and each of the MPEG-based methods. The
H0hypothesis was that the mean of such difference
distribu-tion was zero (µ∆ =0), while the alternative hypothesisH1
7 6 5 4 3 2 1 0
SiCAS@25 MP
EG@35
MP
EG@30
MP
EG@25
MP
EG@20
MP
EG@30nt
0 1 2 3 4 5 6
Poorest Poor Medium Good Best
Figure7: Subjective test results averaged across all listeners and ex-cerpts.
leads to a reduction of more than 20% in terms of number of sinusoids needed to represent signals at a given quality level. As mentioned already inSection 5the most relevant dif-ference between the proposed model and the ISO MPEG model is the incorporation of spectral integration properties in the proposed model. This leads to systematically smoother masking curves such as predicted by our model for complex masker spectra (cf.Figure 4). The effect of this is that fewer
sinusoidal components are used for modelling spectral val-leys of a signal with the proposed perceptual model as com-pared to the ISO MPEG model. We think that this difference accounts for the improvement in modelling efficiency that we observed in the listening tests and we expect that simi-lar improvements would have been observed when our ap-proach was compared to other perceptual models that are based on the spectral-spreading approach such as those used in the ISO MPEG model.
8. CONCLUSIONS
In this paper we presented a psychoacoustical model that is suited for predicting masked thresholds for sinusoidal dis-tortions. The model relies on signal detection theory and in-corporates more recent insights about spectral and temporal integration in auditory masking. We showed that, as a con-sequence, the model is able to predict distortion detectabili-ties. In fact, the distortion detectability defines a (perceptu-ally relevant) norm on the underlying signal space which is beneficial for optimisation algorithms such as rate-distortion optimisation or linear predictive coding. The model proves to be very suitable for application in the context of sinu-soidal modelling, although it is also applicable in other au-dio coding contexts such as transform coding. A compara-tive listening test using a sinusoidal analysis method called psychoacoustical matching pursuit showed a clear preference for the model presented here over the ISO MPEG model [1].
More specifically, the model presented here leads to a re-duction of more than 20% in terms of number of sinusoids needed to represent signals at a given quality level.
ACKNOWLEDGMENTS
The authors would like to thank Nicolle H. van Schijndel, Gerard Hotho, and Jeroen Breebaart and the reviewers for their helpful comments on this manuscript. Furthermore, the authors thank the participants in the listening test. The research was supported by Philips Research, the Technol-ogy Foundation STW, Applied Science Division of NWO, the Technology Programme of the Dutch Ministry of Economic Affairs, and the EU project ARDOR, IST-2001-34095.
REFERENCES
[1] IISO/MPEG Committee,Coding of moving pictures and asso-ciated audio for digital storage media at up to about 1.5 Mbit/s - part 3: Audio, 1993, ISO/IEC 11172-3.
[2] T. Yoshida, “The rewritable minidisc system,” Proc. IEEE, vol. 82, no. 10, pp. 1492–1500, 1994.
[3] A. Hoogendoorn, “Digital compact cassette,” Proc. IEEE, vol. 82, no. 10, pp. 1479–1589, 1994.
[4] T. Painter and A. Spanias, “Perceptual coding of digital audio,” Proc. IEEE, vol. 88, no. 4, pp. 451–515, 2000.
[5] K. N. Hamdy, M. Ali, and A. H. Tewfik, “Low bit rate high quality audio coding with combined harmonic and wavelet representation,” inProc. IEEE Int. Conf. Acoustics, Speech, Sig-nal Processing (ICASSP ’96), vol. 2, pp. 1045–1048, Atlanta, Ga, USA, May 1996.
[6] S. N. Levine,Audio representations for data compression and compressed domain processing, Ph.D. thesis, Stanford Univer-sity, Stanford, Calif, USA, 1998.
[7] H. Purnhagen and N. Meine, “HILN—the MPEG-4 paramet-ric audio coding tools,” inProc. IEEE Int. Symp. Circuits and Systems (ISCAS ’00), vol. 2000, pp. 201–204, Geneva, Switzer-land, May 2000.
[8] W. Oomen, E. Schuijers, B. den Brinker, and J. Breebaart, “Ad-vances in parametric coding for high-quality audio,” inProc. 114th AES Convention, Amsterdam, The Netherlands, March 2003, preprint 5852.
[9] F. P. Myburg,Design of a scalable parametric audio coder, Ph.D. thesis, Technische Universiteit Eindhoven, Eindhoven, The Netherlands, 2004.
[10] H. S. Malvar,Signal Processing with Lapped Transforms, Artech House, Boston, Mass, USA, 1992.
[11] P. P. Vaidyanathan,Multirate Systems and Filter Banks, Pren-tice Hall Signal Processing Series, PrenPren-tice Hall, Englewood Cliffs, NJ, USA, 1993.
[12] J. E. Hawkins and S. S. Stevens, “The masking of pure tones and of speech by white noise,”Journal of the Acoustical Society of America, vol. 22, pp. 6–13, 1950.
[13] T. S. Verma,A perceptually based audio signal model with ap-plication to scalable audio coding, Ph.D. thesis, Stanford Uni-versity, Stanford, Claif, USA, 1999.
[14] R. L. Wegel and C. E. Lane, “The auditory masking of one pure tone by another and its probable relation to the dynamics of the inner ear,”Phys. Rev., vol. 23, pp. 266–285, 1924. [15] H. Fletcher, “Auditory patterns,”Reviews of Modern Physics,
vol. 12, no. 1, pp. 47–65, 1940.
[17] J. P. Egan and H. W. Hake, “On the masking pattern of a simple auditory stimulus,”Journal of the Acoustical Society of America, vol. 22, pp. 622–630, 1950.
[18] K. G. Yates, I. M. Winter, and D. Robertson, “Basilar mem-brane nonlinearity determines auditory nerve rate-intensity functions and cochlear dynamic range,” Hearing Research, vol. 45, no. 3, pp. 203–220, 1990.
[19] R. D. Patterson, “Auditory filtershapes derived with noise stimuli,”Journal of the Acoustical Society of America, vol. 59, pp. 1940–1947, 1976.
[20] M. van der Heijden and A. Kohlrausch, “The role of envelope fluctuations in spectral masking,”Journal of the Acoustical So-ciety of America, vol. 97, no. 3, pp. 1800–1807, 1995.
[21] M. van der Heijden and A. Kohlrausch, “The role of distortion products in masking by single bands of noise,”Journal of the Acoustical Society of America, vol. 98, no. 6, pp. 3125–3134, 1995.
[22] J. P. Egan, W. A. Lindner, and D. McFadden, “Masking-level differences and the form of the psychometric function,” Per-ception and Psychophysics, vol. 6, pp. 209–215, 1969.
[23] D. M. Green and J. A. Swets,Signal Detection Theory and Psy-chophysics, Krieger, New York, NY, USA, 1974.
[24] S. Buus, E. Schorer, M. Florentine, and E. Zwicker, “Decision rules in detection of simple and complex tones,”Journal of the Acoustical Society of America, vol. 80, no. 6, pp. 1646–1657, 1986.
[25] A. Langhans and A. Kohlrausch, “Spectral integration of broadband signals in diotic and dichotic masking experi-ments,”Journal of the Acoustical Society of America, vol. 91, no. 1, pp. 317–326, 1992.
[26] S. van de Par, A. Kohlrausch, J. Breebaart, and M. McKinney, “Discrimination of different temporal envelope structures of diotoic and dichotic targets signals within diotic wide-band noise,” inProc. 13th International Symposium on Hearing, pp. 334–340, Dourdan, France, August 2003.
[27] G. van den Brink, “Detection of tone pulse of various dura-tions in noise of various bandwidths,”Journal of the Acoustical Society of America, vol. 36, pp. 1206–1211, 1964.
[28] S. van de Par and A. Kohlrausch, “Application of a spec-trally integrating auditory filterbank model to audio coding,” inFortschritte der Akustik, Plenarvortr¨age der 28. Deutschen Jahrestagung f¨ur Akustik, DAGA-02, pp. 484–485, Bochum, Germany, 2002.
[29] T. Dau, D. P¨uschel, and A. Kohlrausch, “A quantitative model of the ‘effective’ signal processing in the auditory system. I. Model structure,”Journal of the Acoustical Society of America, vol. 99, no. 6, pp. 3615–3622, 1996.
[30] R. D. Patterson, “The sound of a sinusoid; spectral models,” Journal of the Acoustical Society of America, vol. 96, no. 3, pp. 1409–1418, 1994.
[31] B. R. Glasberg and B. C. J. Moore, “Derivation of audi-tory filter shapes from notched-noise data,”Hearing Research, vol. 47, no. 1-2, pp. 103–138, 1990.
[32] R. Heusdens, J. Jensen, W. B. Kleijn, V. Kot, O. Niamut, S. van de Par, N. H. van Schijndel, and R. Vafin, “Sinusoidal coding of audio and speech,” in preparation forJournal of the Audio Engineering Society, 2005.
[33] B. C. J. Moore,An Introduction to the Psychology of Hearing, Academic Press, London, UK, 3rd edition, 1989.
[34] G. Charestan, R. Heusdens, and S. van de Par, “A gamma-tone based psychoacoustical modeling approach for speech and audio coding,” inProc. ProRISC/IEEE: Workshop on Cir-cuits, Systems and Signal Processing, pp. 321–326, Veldhoven, The Netherlands, November 2001.
[35] A. J. M. Houtsma, “Hawkins and Stevens revisited at low
frequencies,” Journal of the Acoustical Society of America, vol. 103, no. 5, pp. 2848–2848, 1998.
[36] E. Zwicker and A. Jaroszewski, “Inverse frequency dependence of simultaneous tone-on-tone masking patterns at low levels,” Journal of the Acoustical Society of America, vol. 71, pp. 1508– 1512, 1982.
[37] A. Langhans and A. Kohlrausch, “Differences in auditory per-formance between monaural and diotic conditions. I. Masked thresholds in frozen noise,”Journal of the Acoustical Society of America, vol. 91, pp. 3456–3470, 1992.
[38] S. van de Par and A. Kohlrausch, “Dependence of binaural masking level differences on center frequency, masker band-width and interaural parameters,”Journal of the Acoustical So-ciety of America, vol. 106, pp. 1940–1947, 1999.
[39] E. Zwicker and H. Fastl,Psychoacoustics—Facts and Models, Springer, Berlin, Germany, 2nd edition, 1999.
[40] R. J. McAulay and T. F. Quatieri, “Sinusoidal coding,” in Speech Coding and Syntesis, W. B. Kleijn and K. K. Paliwal, Eds., chapter 4, pp. 121–173, Elsevier Science B. V., Amster-dam, The Netherlands, 1995.
[41] M. Goodwin, “Matching pursuit with damped sinusoids,” inProc. IEEE Int. Conf. Acoustics, Speech, Signal Processing (ICASSP ’97), vol. 3, pp. 2037–2040, Munich, Germany, April 1997.
[42] J. Nieuwenhuijse, R. Heusdens, and E. F. Deprettere, “Ro-bust exponential modeling of audio signals,” inProc. IEEE Int. Conf. Acoustics, Speech, Signal Processing (ICASSP ’98), vol. 6, pp. 3581–3584, Seattle, Wash, USA, May 1998.
[43] T. S. Verma and T. H. Y. Meng, “Sinusoidal modeling us-ing frame-based perceptually weighted matchus-ing pursuits,” inProc. IEEE Int. Conf. Acoustics, Speech, Signal Processing (ICASSP ’99), vol. 2, pp. 981–984, Phoenix, Ariz, USA, May 1999.
[44] R. J. McAulay and T. F. Quatieri, “Speech analysis/synthesis based on a sinusoidal representation,” IEEE Trans. Acoust., Speech, Signal Processing, vol. 34, no. 4, pp. 744–754, 1986. [45] S. G. Mallat and Z. Zhang, “Matching pursuits with
time-frequency dictionaries,”IEEE Trans. Signal Processing, vol. 41, no. 12, pp. 3397–3415, 1993.
[46] K. Vos and R. Heusdens, “Rate-distortion optimal exponen-tial modeling of audio and speech signals,” inProc. 21st Sym-posium on Information Theory in the Benelux, pp. 77–84, Wassenaar, The Netherlands, May 2000.
[47] R. Heusdens, R. Vafin, and W. B. Kleijn, “Sinusoidal model-ing usmodel-ing psychoacoustic-adaptive matchmodel-ing pursuits,”IEEE Signal Processing Lett., vol. 9, no. 8, pp. 262–265, 2000. [48] R. Heusdens and S. van de Par, “Rate-distortion optimal
si-nusoidal modeling of audio and speech using psychoacous-tical matching pursuits,” inProc. IEEE Int. Conf. Acoustics, Speech, Signal Processing (ICASSP ’02), vol. 2, pp. 1809–1812, Orlando, Fla, USA, May 2002.
[49] R. C. Hendriks, R. Heusdens, and J. Jensen, “Perceptual lin-ear predictive noise modelling for sinusoid-plus-noise audio coding,” inProc. IEEE Int. Conf. Acoustics, Speech, Signal Pro-cessing (ICASSP ’04), vol. 4, pp. 189–192, Montreal, Quebec, Canada, May 2004.
[50] J. Jensen, R. Heusdens, and S. H. Jensen, “A perceptual sub-space approach for modeling of speech and audio,” IEEE Trans. Speech Audio Processing, vol. 12, no. 2, pp. 121–132, 2004.
[51] ITU,ITU-R BS 1534. Method for subjective assessment of inter-mediate quality level of coding systems, 2001.
Steven van de Par studied physics at the Eindhoven University of Technology (TU/e), and received his Ph.D. degree in 1998 from the Institute for Perception Re-search on a topic related to binaural hear-ing. As a Postdoctoral Researcher at the same institute, he studied auditory-visual interaction and he was a Guest Researcher at the University of Connecticut Health Cen-tre. In the beginning of 2000 he joined
Philips Research, Eindhoven. Main fields of expertise are audi-tory and multisensory perception and low-bit-rate audio coding. He published various papers on binaural detection, auditory-visual synchrony perception, and audio-coding-related topics. He partic-ipated in several projects on low-bit-rate audio coding based on si-nusoidal techniques and is presently participating in the EU Adap-tive Rate-Distortion Optimized Audio codeR (ARDOR) project.
Armin Kohlrausch studied physics at the
University of G¨ottingen, Germany, and spe-cialized in acoustics. He received his M.S. degree in 1980 and his Ph.D. degree in 1984, both in perceptual aspects of sound. From 1985 until 1990 he worked at the Third Physical Institute, University of G¨ottingen, and was responsible for research and teach-ing in the fields psychoacoustics and room acoustics. In 1991 he joined the Philips
Re-search Laboratories, Eindhoven, and worked in the Speech and Hearing Group, Institute for Perception Research (IPO). Since 1998, he has combined his work at Philips Research Laboratories with a Professor position for multisensory perception at the TU/e. In 2004 he was appointed a Research Fellow of Philips Research. He is a member of a great number of scientific societies, both in Europe and the USA. Since 1998 he has been a Fellow of the Acous-tical Society of America and serves currently as an Associate Editor for the Journal of the Acoustical Society of America, covering the areas of binaural and spatial hearing. His main scientific interests are in the experimental study and modelling of auditory and mul-tisensory perception in humans and the transfer of this knowledge to industrial media applications.
Richard Heusdensis an Associate Professor
in the Department of Mediamatics, Delft University of Technology. He received his M.S. and Ph.D. degrees from the Delft Uni-versity of Technology, the Netherlands, in 1992 and 1997, respectively. In the spring of 1992 he joined the Digital Signal Processing Group, Philips Research Laboratories, Eind-hoven, the Netherlands. He has worked on various topics in the field of signal
process-ing, such as image/video compression and VLSI architectures for image-processing algorithms. In 1997, he joined the Circuits and Systems Group, Delft University of Technology, where he was a Postdoctoral Researcher. In 2000, he moved to the Information and Communication Theory (ICT) Group where he became an Assis-tant Professor, responsible for the audio and speech processing ac-tivities within the ICT Group. Since 2002, he has been an Associate Professor. Research projects he is involved in cover subjects such as audio and speech coding, speech enhancement, and digital water-marking of audio.
Jesper Jensenreceived the M.S. and Ph.D.
degrees from Aalborg University, Aalborg, Denmark, in 1996 and 2000, respectively, both in electrical engineering. From 1996 to 2001, he was with the Center for Per-sonKommunikation (CPK), Aalborg Uni-versity, as a Researcher, Ph.D. student, and Assistant Research Professor. In 1999, he was a Visiting Researcher at the Center for Spoken Language Research, University of
Colorado at Boulder. Currently, he is a Postdoctoral Researcher at Delft University of Technology, Delft, the Netherlands. His main research interests are in digital speech and audio signal processing, including coding, synthesis, and enhancement.
Søren Holdt Jensenreceived the M.S.
de-gree in electrical engineering from Aal-borg University, Denmark, in 1988, and the Ph.D. degree from the Technical Uni-versity of Denmark, in 1995. He has been with the Telecommunications Laboratory of Telecom Denmark, the Electronics Institute of the Technical University of Denmark, the Scientific Computing Group of the Danish Computing Center for Research and
![Figure 3: Masked thresholds predicted by the model (solid line)and psychoacoustical data (circles) [25]](https://thumb-us.123doks.com/thumbv2/123dok_us/1138007.1142764/7.600.311.544.79.176/figure-masked-thresholds-predicted-model-solid-psychoacoustical-circles.webp)