An Empirical Examination of Public Attitudes toward Advertising
By
Petrovici, D. and Paliwoda, S.J.
Abstract
This paper examines public attitudes toward advertising in a transitional context in Central and Eastern Europe. Drawing on a consumer survey conducted in three main cities of Romania, the study conceptualises an extended version of Pollay and Mittal’s model of beliefs and attitudes toward advertising. Relationships between personal uses of and attitudes to advertising in Romania are explored. Demographic differences in attitudes are highlighted and discussed with reference to other studies. Finally some implications of this study for marketers are emphasised.
Key words: attitudes to advertising, personal uses of advertising, emerging markets, Central and Eastern Europe
Background of the study
The transition from a centrally planned system to a free market economy in Central and Eastern European countries (CEEC) entailed a revolution of social systems that challenged values, mentalities, and behavioural patterns. Significant changes occurred in cultural ideologies and intermediaries (advertisers, retailers), which underpin, not only product involvement and brand experimentation (Coulter, Price and Feick 2003), but also consumer attitudes to advertising. According to Meth-Cohn (1999) only 25-30% of the population in CEE has enjoyed a real increase in incomes since 1989 and 20% has seen a significant fall. Hence, there are large segments of price conscious consumers, but emerging high-income earners. Almost a third of consumers in CEEC were identified as “winners” and “new-comers” (rather young, dynamic and open to risk and change) in terms of their lifestyles (FESSEL-GfK 1997), many of them being high-income earners. Differentiated market opportunities emerged in the CEEC. Given the significance of the shadow economy (50% of GDP in 2000-2001 in Romania, Schneider 2002), it is argued that income is not necessarily a valid segmentation variable. Consumer lifestyles and attitudes to advertising emerge as relevant concepts in analysing consumer markets in CEEC.
Purpose of the study
Advertising is likewise a teenager in emerging East European economies. Since the fall of the Iron Curtain in 1989, consumers have been exposed to advertisements and we have now had fifteen years of experience in this area.
East European consumers have been bombarded in the last decade with advertising campaigns facilitated by the weak market regulations and laws regarding consumer protection, which are frequently encountered in less developed economies (Kaynak 1986).
This study sheds some light on public assessment of advertising in Romania. During the centralised period, there were few consumer products, no Western products and no advertising on Romanian television (Manrai, Manrai and Lascu 1998). Following many years of a lack of consumer advertising, during socialism, the advertising scene has undergone a substantial institutional change.
(European Advertising and Media Forecast 2004). Arguably, the impact of increased advertising budgets through market liberalisation on less emancipated consumers (less educated and informed in the field of choice, and quality expectations by Western standards) has been profound and insufficiently investigated. There is a tremendous research interest in understanding consumer perception of advertising in the Eastern bloc and little data are available to support advertising and marketing strategies in this region (West and Paliwoda 1996).
In particular, little is known about how consumers’ evaluation of and reaction to advertising in the markets that are expected to integrate into the Single Market. Do they build up confidence in the institution of advertising, as we perceive it in the Western world? Have they embraced the free market and been convinced about the necessity of advertising or are they overwhelmed by the intrusiveness of the experience of endless campaigns? Are they sceptical of the instruments used by marketers to promote their products or do they perceive them as fair and sincere?
Some facets of these questions are addressed in this study. The main goal is to understand attitudes toward advertising in Eastern Europe, using Romania as a case study. The paper is concerned with the following specific objectives:
i) to identify primary determinants or “personal uses” according to Pollay and Mittal (1993) of advertising in Romania and evaluate their impact;
ii) to identify significant differences in attitudes to advertising using key demographics; iii) to compare these differences with findings reported in other developed economies
and Russia.
The next section places the study in the context of marketing literature. This is followed by an outline of the theoretical framework, which underpinned data collection and the sampling frame. Key findings of the study are then discussed, followed by managerial implications.
Public attitudes to advertising
For over seven decades, public attitudes to advertising have been surveyed in the developed world. The stream of literature concerned with public attitudes to advertising that underpins this study originates in 1970s with the distinction between economic and social effects of advertising (Bauer and Greyser 1968; Lutz 1975). Subsequent studies confirmed the economic and social dimensions and elaborated them (Pollay and Mittal 1993). They highlighted that attitudes to advertising are dynamic and uneven across population subgroups, which is not surprising, given the diversity of lifestyles, expectations, and skills used in processing and elaborating symbols, and cues in advertisements. Less favourable attitudes to advertising tend to be found among people with higher education levels (Anderson et al 1978), students compared to businessmen (Haller 1974) and women (Shavitt and Lowrey 1998).
The refinements of the variables have also occurred in the area of the predictors of attitudes. This latter endogenous variable has also been elaborated by Sandage and Leckenby (1980) in the form of distinction that people make between advertising as an institution and the instruments of advertising (methods and techniques used by marketers).
In a large number of studies, attitudes to advertising were informed by samples of college students (Muehling 1987; Andrews, Durvasula and Netemeyer 1994) and even those including the adult population were mostly focused on the United States (US) consumers (Mittal 1994; Shavitt, Lowery and Haefner 1998; Mehta 2000). There is an increased interest in understanding public attitudes to advertising in the emerging markets in Eastern Europe, which are expected to join the EU in the second wave, in 2007.
Beliefs and attitudes towards advertising were mostly investigated in the developed world (Schutz and Casey 1981; Ford, Smith and Swasy 1990; Mittal 1994). The merit of Andrews, Durvasula and Netemeyer’s (1994) study was to explore attitudes to advertising in an Eastern European country and compare them with those in a Westernised country. Their reported differences in underlying beliefs in Russia and the US highlighted the relevance of investigating attitudes to advertising in CEEC, as many findings/hypotheses contradicted their expectations based on previous academic knowledge.
With the exception of Russia, little is known about public attitudes to advertising in this economic area. The understanding of public attitudes to advertising is crucial, given that these may influence the receptivity to advertising (Mackenzie, Lutz and Belch 1986).
Theoretical model
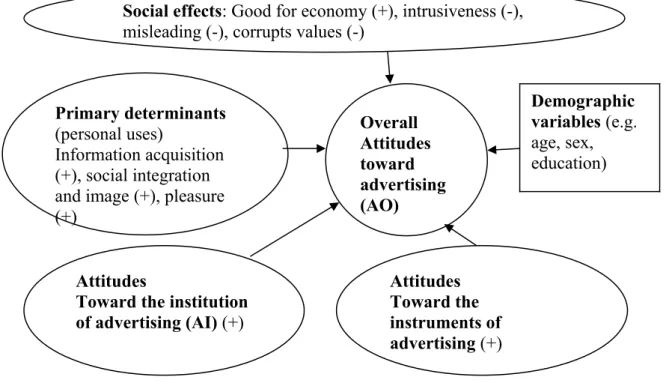
This study examined economic, social and psychological determinants behind consumer attitudes to advertising and is informed by Pollay and Mittal’s (1993) model of the beliefs and attitudes toward advertising (Figure 1, Appendix 1). This paper reports on the relationships between primary determinants (personal uses) and attitudes to advertising. Attitudes to advertising are analysed here in a broader context, incorporating the two dimensions proposed by Sandage and Leckenby (1980), namely attitudes to the institution of advertising and attitudes toward instruments of advertising (methods and techniques used by marketers).
All variables in the model are measured on multi-item scales, as a typical application of the reflective indicator model (Jarvis, Mackenzie and Podsakoff 2003). The signs in the brackets indicate the directionality of the relationships between latent variables, as hypothesised by Pollay and Mittal. Demographics (consumers’ age, education, sex) and income are integrated in the model.
Research Methods Procedure
In keeping with the conventions recommended by Churchill (1979); Anderson and Gerbing (1988) and Hulland, Chow and Lam (1996) in developing more reliable measures of marketing constructs, the pool of items which tap each dimension of the latent constructs has been generated using a pilot sample of 40 college students enrolled in economics in the Academy of Bucharest; discussions with creative directors, research directors and account managers of subsidiaries of multinational advertising agencies in Romania, and an overview of the marketing literature on public attitudes to advertising.
Students were given five minutes to write down any thoughts that came to mind when they heard the word “advertising”. They were then asked to classify each thought as being either positive, neutral or negative.
Preliminary data was collected using a pilot sample of 40 questionnaires administrated amongst the adult population in Bucharest. Measures were purified and adjusted for cultural differences. Double-barrelled statements have been eliminated or redefined.
A sample of 440 face-to-face interviews with adult respondents from three cities was achieved in partnership with the Romanian Institute of Social and Economic Research and Polls (IRECSON).
were not only one of the largest in demographic terms, but also important economic and cultural centres.
In a second stage, each city has been stratified according to residential areas. A threshold of ten interviews in each residential area was imposed in order to ensure a wide representation of households. Within each street, dwellings were selected using the random route sampling method (see Table 1 for demographics). Within each household, the respondent has been selected using a random scheme.
Table 1. Sample breakdown by key demographics (% of respondents)
Age Gender Education
Under 34 years 45.7 Male 41.6 Up to ten years 18.4
35-54 years 36.6 Female 58.4 High school 51.1
55+ years 17.7 College 30.5
Source: authors’ survey data
The sample breakdown by gender and education represents a good approximation of national statistics (INS 2004), albeit it overstates the youth. This pattern can be linked to the greater expertise and willingness of young people to discuss the topic of advertising. Having introduced the source of primary data, the next section describes the conceptual framework of the study.
Psychometric properties of the constructs
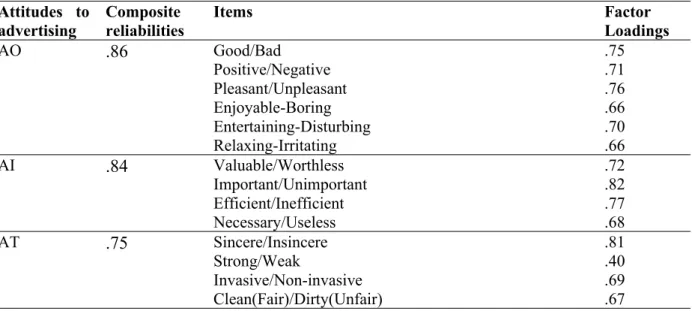
In line with previous studies (Sandage and Leckenby 1980; Pollay and Mittal 1993) and marketing research practice (Eagly and Chaiken 1993), attitudes were evaluated using five-point semantic differential scales (Table 2, Appendix 2); personal uses of advertising have been measured on seven-point Likert scales (strongly disagree/strongly agree).
Exploratory factor analysis (EFA) with VARIMAX rotation in SPSS was conducted to identify underlying dimensions of consumer attitudes to advertising. With regards to attitudes to advertising, the factor solution emphasised the three-dimensional structure, namely AO, AI and AT. Several items that were poorly accounted for by the factor solution (communalities <0.5) or were associated with double loadings (Hair et al. 1998) have been eliminated.
In a second stage, a confirmatory factor analysis (CFA) was conducted in Lisrel 8.4 (Jöreskog et al. 2001) to test the unidimensionality of concepts (Table 2).
The most common indicators used to describe the goodness-of-fit of the structural models (Loehlin 1998) are: the Goodness-of-Fit Index (GFI), Bentler’s Comparative Fit Index (CFI), Bentler-Bonett’s Normed Fit Index (NFI), Standardised Root Mean square residual (SRMR) and Steiger’s Root Mean Square of Approximation (RMSEA).
Lower values of the normed chi-square (ratio of chi square to the degrees of freedom) are recommended (Maruyama 1998). Values less than 10 regarded as acceptable fit (Bacon 2000) and values less than 3 regarded indicative of good fit (Kaplan 2000).
Values of GFI, CFI, NFI greater than 0.9 suggest adequate fits, while greater than 0.95 indicate good fits of the model to the data (Hulland, Chow and Lam 1996; Diamantopoulos and Siguaw 1999). Values of RMSEA and Standardised RMR less than 0.5 are desirable, between 0.05 and 0.08 are satisfactory, between 0.08 and 0.10 indicate mediocre fit and greater than 0.10 suggests poor fit (Browne and Cudeck 1993). Nevertheless Steiger (1989, p.81) regards values below 0.10 as good.
recommended in the literature. A poor reliability is noticeable for social integration and marginally for the hedonic utility of advertising.
The meaning of the factors underlined by the EFA were validated by the CFA and consistent with the constructs of interest, as highlighted by previous studies, suggesting evidence of construct validity (Gerbing and Anderson 1988). Convergent validity of constructs was shown by the high correlation between AO measured as a summative index of semantic scales and items evaluated on a Likert scale. All concepts showed evidence of discriminant validity. Differences between chi-square of baseline and nested models, which specified the correlation between variables, were significant.
Research: Key findings
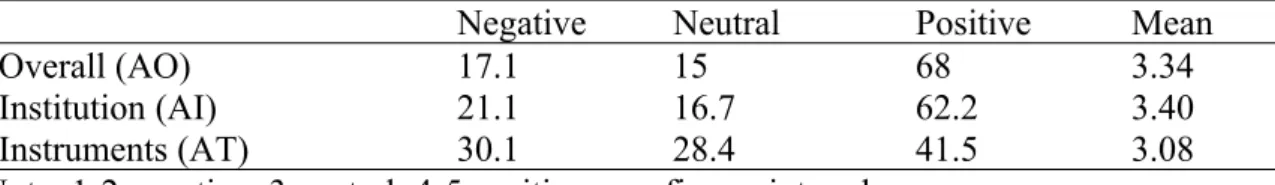
Likewise US consumers, Sandage and Leckenby (1980), people are more positive about advertising as an institution than the instruments of advertising (Table 3). This pattern is nevertheless is the reverse of Russia (Durvasula et al. 1994), despite similarities in communist heritage and economic hardships. They seem to accept the role of advertising in a free market economy, but have less confidence in advertising claims and techniques. The majority of consumers perceive advertising as informative and entertaining (Table 4). A slightly less favourable attitude to the role of social integration is noticeable.
Table 3. Sample breakdown by attitudes toward advertising and personal uses Percentage of respondents
Negative Neutral Positive Mean
Overall (AO) 17.1 15 68 3.34
Institution (AI) 21.1 16.7 62.2 3.40
Instruments (AT) 30.1 28.4 41.5 3.08
Note: 1-2 negative; 3 neutral; 4-5 positive on a five-point scale.
Table 4. Sample breakdown by personal uses of advertising Percentage of respondents
Disagree Neutral Agree Mean
Information acquisition (IA) 4.1 38.6 57.3 4.69
Social integration/image (SI) 7.3 54.2 38.5 4.25
Hedonic utility (HU) 5.9 42.1 51.9 4.64
Note: Disagree = 1-3; 4 = Neutral; 5-7 = positive on a seven-point scale. Source: derived from authors’ survey
In order to evaluate the influence of primary determinants on attitudes to advertising, bivariate tests (chi-square) and a multiple regression model are employed.
The chi-square tests point out consumer’s age as the most significant predictor associated with attitudes to advertising (Table 5). This was expected given that receptivity to advertising is associated with philosophies of life, which are arguably shaped by age.
Table 5. Differences between attitudes to advertising
AO Chi-square AI Chi-square AT Chi-square
Gender 1.9 Gender 4.5+ Gender 0.4
Age group 10.3* Age group 5.7 Age group 17.6**
Education 8.9+ Education 5.9 Education 8.7+
Income 1.7 Income 7.9 Income 25.7**
Age and education are significantly associated with AO. Namely, elderly and people with higher education attainment hold less favourable attitudes to advertising. Yet, it is the young and very low-income consumers who are more critical of the instruments of advertising.
Less favourable attitudes to instruments of advertising tend to be found among youth and highly educated people but also the lower income earners. If the first groups are known to be more critical of ad claims (Anderson et al 1978), the scepticism among the latter group might be linked to the financial burden that they have suffered from misleading advertisements. An illustrative example consists of numerous financial schemes and mutual funds, which promised spectacular rates of returns to the majority of customers, all of which became bankrupt such as Caritas, SAFI and FNI. By dismantling overnight savings accumulated during many years, consumers’ confidence in the instruments of advertising may have been undermined. In contrast to Shavitt and Lowrey’s (1998) study, women are in general slightly more positive to advertising.
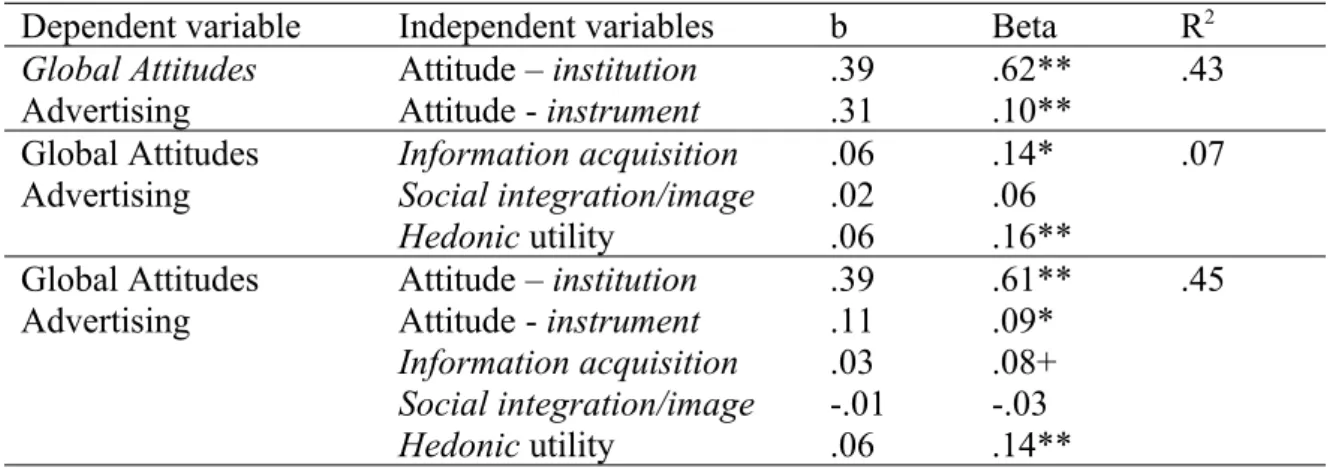
The predictive role of determinants of attitudes to advertising is now examined (Table 6) using a multiple regression model conducted in SPSS 10.1.
Table 6. Regression analysis: determinants of general attitudes to advertising
Dependent variable Independent variables b Beta R2
Global Attitudes Attitude – institution .39 .62** .43
Advertising Attitude - instrument .31 .10**
Global Attitudes Information acquisition .06 .14* .07 Advertising Social integration/image .02 .06
Hedonic utility .06 .16**
Global Attitudes Attitude – institution .39 .61** .45
Advertising Attitude - instrument .11 .09*
Information acquisition .03 .08+ Social integration/image -.01 -.03
Hedonic utility .06 .14**
** p < .01; * p < .05; + p< .10 Source: derived from authors’ survey
The regression estimates point out that the two dimensions of attitudes to advertising (AT and AI) and two personal uses of advertising (IA and HU) are significant predictors of general attitudes to advertising. A reasonable amount of variation in overall attitudes can be attributed to the first two dimensions. Thus, it is apparent that economic as well as social dimensions are contributing factors to the formation of attitudes to advertising in Romania. The hedonic utility plays a modest role in the attitudes to instruments of advertising.
Conclusion
advertisements and counterfeited products, manufacturers, retailers and advertising agencies need to consolidate consumers‘ confidence in advertising. They can capitalise on a positive public assessment of advertising, but comply with fair advertising standards. During the last couple of years, Romania embarked upon serious reforms in market structure and institutions, which are thought to have shaped market conduct and performance. As far as the institution of advertising is concerned, public receptivity seems encouraging. With regard to elderly, there is scope for cultivating the educational role of advertising. Although many advertising overlook this segment, the integration of elderly in the market exchanges is essential in developing a democratic free market, which will join the Single Market.
References
Anderson, J. and D. Gerbing (1988), “Structural Equation Modelling in Practice: A Review and Recommended Two-Step Approach,” Psychological Bulletin, 103 (3), pp. 411-23.
Bauer, R.A. and Greyser, S.A. (1968), Advertising in America: The consumer view, Boston: Harvard University, Graduate School of Business Administration Division of Research.
Browne, Michael W. and Cudeck, Robert (1993), “Alternative Ways of Assessing Model Fit”, In: Testing Structural Equation Models, (Eds.) Bollen, Kenneth A. and Long, Scott J. (Newbery Park), Sage.
Churchill, G. (1979), “A Paradigm for Developing Better Measures of Marketing Constructs”, Journal of Marketing Research, 16 (February), pp. 64-73.
Coulter, R.A., Price, L.L. and Feick, L. (2003), “Rethinking the origins of involvement and brand commitment: Insights from post-socialist Central Europe”, Journal of Consumer Research, 30, pp. 151-169.
Diamantopoulos, Adamantios and Siguaw, Judy A. (2000), Introducing LISREL. A Guide for the Uninitiated, London, Sage Publications.
Eagly, A.H. and Chaiken, S. (1993), The Psychology of Attitudes, Harcourt, Brace & Jovanovich, San Diego.
European Advertising and Media Forecast (2004), Eastern Europe, European Advertising and Media Forecast, February, 18(3), pp. 26-28.
FESSEL-GfK (1997) Socio-Styles. Vienna, FESSEL-GfK Ltd.
Hair, Joseph F., Anderson, Ralph E., Tatham, Ronald L. and Black, William C. (1998), Multivariate Analysis with Readings, 5th Ed., New Jersey, Prentice Hall International.
Haller, T.F. (1974), “What students think of advertising”, Journal of Advertising Research, 14(1), pp. 33-43.
Hulland, John, Chow, Yiu Ho and Lam, Shunyin (1996), “Use of Causal Models in Marketing Research: A review”, International Journal of Research in Marketing, 13, pp.181-197.
INS (Institute of National Statistics) (2002), Coordonate ale nivelului de trai in Romania. Veniturile si consumul populatiei, Bucharest, INS.
INS (Institutu National de Statistica) (2004), Anuarul Statistic al Romaniei, Bucharest, INS.
Jarvis, C.B., Mackenzie, S.B. and Podsakoff, P.M. (2003), “A critical review of construct indicators and measurement model misspecification in marketing and consumer research”, Journal of Consumer Research, 30, pp.199-218.
Kaplan, David (2000), Structural Equation Modelling: Foundations and Extensions, London, Sage.
Koudelova, R. and Whitelock, J. (2001), “A cross-cultural analysis of television advertising in the UK and Czech Republic”, International Marketing Review, 18, 3, pp.286-300.
Loehlin, John C. (1998), Latent Variable Models: An introduction to Factor, Path, and Structural Analysis, 3rd Edition, London, Lawrence Erlbaum.
Lutz, R.J. (1975), “Measurement and diagnosis of student attitudes toward a career in advertising”, Journal of Advertising, 4(3), pp. 36-40.
Lutz, R.J. (1985), “Affective and Cognitive Antecedents of Attitudes toward Advertising: A Conceptual Framework”, In: Psychological Processes and Advertising Effects: Theory, Research and Applications, Alwitt, S. and Mitchell, A. (eds), Hillsdale, NJ: Erlbaum.
Mackenzie, S.B. and Lutz, R.J. (1986), “An empirical examination of attitudes toward advertising in an Advertising Pretest Context”, Journal of Marketing, 57(2), pp. 48-65.
Mackenzie, S.B., Lutz, R.J. and Belch, G.E. (1986), The role of attitude toward the ad as a mediator of advertising effectiveness: A test of competing explanations”, Journal of Marketing Research, 23(2), pp. 130-43.
Manrai, L.M., Lascu, D.N., Manrai, A.K. and Babb, H.W. (2001), “A cross-cultural comparison of style in Eastern European emerging markets”, International Marketing Review, 18, 3, pp. 270-285.
Maruyama, G.M. (1998), Basics of Structural Equation Modelling, Thousand Oaks, Sage.
Mehta, A. (2000), “Advertising Attitudes and Advertising Effectiveness”, Journal of Advertising Research, 40(3), pp. 67-72.
Meth-Cohn, D. (1999), “Was it worth it?”, Business Central Europe, November, pp. 14-19.
Mittal, B. (1994), “Public Assessment of TV Advertising: Faint Praise or Harsh Criticism”, Journal of Advertising Research, 40(3), pp. 35-53.
Multichannel News International (2002), “European databank”, Multichannel News International, January, 8(1).
Orth, U. R. and Holancova, D. (forthcoming), “Men’s and women’s responses to sex role portrayals in advertisements”, International Journal of Research in Marketing.
Pollay, R.B. and Mittal, B. (1993), “Here’s the beef: Factors, determinants, and segments in consumer criticism of advertising”, Journal of Marketing, 57, 3, pp. 99-114.
Sandu, D. (1999), Spatiul social al tranzitiei, Bucharest, Polirom.
Schneider, F. (2002), The size and development of the shadow economies of 22 transition and 21 OECD countries, Discussion paper No. 514, University of Linz and IZA Bonn, June.
Shavitt, S., Lowery, P. and Haefner, J. (1998), “Public Attitudes toward Advertising: More Favourable than You Might Think, Journal of Advertising Research, 38(4), pp. 7-22.
Steiger, James H. (1989), EzPath Causal Modelling: A Supplementary Module for SYSTAT and SYGRAPH, Evanston, IL: SYSTAT Inc.
West, D.C. and Paliwoda, S.J. (1996), “Advertising adoption in a developing market economy: the case of Poland”, International Marketing Review, 13, 4, pp. 82-101.
Appendix 1
Figure 1. Theoretical model of the beliefs and attitudes toward advertising
Source: Adapted from Pollay and Mittal (1993)
Overall Attitudes toward advertising (AO)
Demographic variables (e.g. age, sex, education) Social effects: Good for economy (+), intrusiveness (-),
misleading (-), corrupts values (-)
Primary determinants (personal uses)
Information acquisition (+), social integration and image (+), pleasure (+)
Attitudes
Toward the institution of advertising (AI) (+)
Appendix 2
Table 2. Psychographic properties of the model constructs
Attitudes to advertising
Composite reliabilities
Items Factor
Loadings
AO .86 Good/Bad
Positive/Negative Pleasant/Unpleasant Enjoyable-Boring Entertaining-Disturbing Relaxing-Irritating .75 .71 .76 .66 .70 .66
AI .84 Valuable/Worthless
Important/Unimportant Efficient/Inefficient Necessary/Useless .72 .82 .77 .68
AT .75 Sincere/Insincere
Strong/Weak Invasive/Non-invasive Clean(Fair)/Dirty(Unfair) .81 .40 .69 .67
Normed χ2=8.1; RMSEA=0.12; NFI=0.93; CFI=0.94; Standardised RMR=0.07; GFI=0.85
Personal uses Composite reliabilities Items Factor Loadings Information acquisition .62
Without ads it would be difficult to decide what to buy Advertisements are a useful source of information Advertising contributes to the knowledge of quality products .55 .66 .56 Social integration/ Image
.45 Advertising has an important role in education children
From advertising I can learn what is fashionable
.44 .63
Hedonic
utility .57
Advertising is often amusing and entertaining
Advertisements are sometimes as enjoyable as other media programs
.87 .36
Normed χ2=3.4; RMSEA=0.07; NFI=0.95; CFI=0.96; Standardised RMR=0.04; GFI=0.98