Blood Cell Count On-a-Chip
Thesis by Wendian Shi
In Partial Fulfillment of the Requirements for the Degree of
Doctor of Philosophy
California Institute of Technology Pasadena, California
2013
Acknowledgements
This thesis is a product summarizing five years’ work in searching and researching. The process of delivering this product, however, was beyond the data and the plots. At beginning, I was excited about the idea, to develop a blood test that people can use at home. During the process, however, I enjoyed a good bit of confusions and doubts because the complexity of this idea.
It was all the supports I received that guided me through this journey. For those priceless helps, I owe gratitude to many people.
First of all, I would like to thank my advisor, Professor Yu-Chong Tai. It was Dr. Tai who entrusted me with the blood test project. Later on, he encouraged me to explore freely ahead of the project, from academic findings to social impacts. What I received from him is beyond guidance and support. The lessons I learned from him, such as how to keep calm in difficult times, how to express myself, and how to think, will continue to inspire me in my future journey.
I would also like to thank my collaborator, Dr. Harvey Kasdan. Harvey worked with me on the blood test project for four years. His experiences and insights helped me to focus on new possibilities. He was also very supportive, when I participated in competition prizes and looked for start-up opportunities.
Trevor Roper. Siyang trained me extensively in my first year here. Luke Guo worked with me for a busy summer. Mike guided me on the algae project. Charles exchanged with me lots of helpful discussions. Christine and Trevor kept the lab running smoothly.
I would also like to thank Prof. Haixia Zhang and Prof. Zhihong Li for introducing me into the micro-fabrication field, and their continuously supporting me.
Thanks to my friends at Caltech, Wendy Chen, Xi Zhang, Tong Chen, Chengshan Zhou, Yu Zhao and many others. They have been so supportive of my work, and I never hesitated to ask for help from them. Thanks to Chenghao Chien and Hongchao Zhou. It was fun working with them on the Dr. Algae project. Thanks to my friends Jun Ying, Xiaofeng Wang, Xia Lou, Dake Wu, Le Liu, Peng Dai, Hao Fang, Jian Wang, Ang Chen, Yun Wang, Jia Xia, Suguo Wang, Huihui Chen, and so many others that I couldn’t list them all. Thanks them for supporting me even when I was thousands of miles away, and welcoming me whenever I visited. Thanks to the wonderful life all of them have shared with me, so that I could focus on my research and on my path.
Thanks Wendy, Charles, Dongyang and Yu Zhao for proof reading this thesis. Thanks to my thesis committee Prof. Yu-Chong Tai, Prof. Changhuei Yang, Prof. Hyuck Choo, Prof. Joel Burdick and Prof. John Dabiri for reviewing this thesis.
Finally, I would like to thank my parents. I learned from them before I attended any school. They have always been there for me, allowing me to fly freely. This thesis is for you
Abstract
White blood cell (WBC) count is one of the most frequently ordered clinical tests in hospitals. There are five types of WBCs in the circulating blood, including lymphocyte, monocyte, neutrophil, eosinophil and basophil. The WBC count test enumerates not only the total number of WBCs in per volume blood, but also the percentage of each WBC type. A portable instrument for the WBC count test is currently in demand by the NASA human spaceflight, and also by the on-earth telemedicine application. However, the commercially available tests do not meet the requirement of the portable applications, because of their large instrument size and the large reagent volume consumed per test.
This study describes the development of a WBC count technology optimized for portable applications. First, a sheathless microfluidic cytometer is developed for WBC count. This technology consumes only a small amount of blood (5 L) and a minimal volume of reagents (50L). Second, fluorescent dye assays are developed for the WBC differential count by measuring fluorescent emissions on the microfluidic cytometer. Based on this technology, a portable instrument is built with high test accuracy (maximum error less than 10%).
T
ABLE
OF
C
ONTENTS
LIST OF FIGURES ... X
LIST OF TABLES ... XVII
Chapter 1 : Introduction to Blood Cell Count ... 1
1.1 Blood Cell Count and Its Clinical Significance ... 1
1.2 Development of Blood Cell Count Technology ... 4
1.3 Needs of Portable Blood Cell Count Technology ... 7
1.4 Microfluidics for Blood Cell Counting ... 9
1.5 Needs of Future Development ... 12
Chapter 2 : Microfluidic Cytometer for White Blood Cell Count ... 13
2.1 Introduction ... 13
2.1.1 Flow Cytometry Principle ... 13
2.1.2 Problem of Implementing Flow Cytometry in Portable Analysis ... 16
2.1.3 Microfluidic Cytometer Technology ... 17
2.1.4 Previous Art of Microfluidic Cytometer for Blood Analysis ... 18
2.2 Sheathless, Fluorescent Microfluidic Cytometer for WBC Count ... 20
2.2.3 Dye-Based Assay and Fluorescent Detection of WBCs ... 27
2.3 Experiment and Material ... 29
2.3.1 Device Layout ... 29
2.3.2 Device Fabrication ... 29
2.3.3 Blood Sample ... 31
2.3.4 Fluorescent Dye Assay ... 32
2.3.5 Optical Configuration for Fluorescent Detection ... 32
2.3.6 Portable Detection System ... 34
2.4 Result and Discussion ... 36
2.4.1 System Evaluation with Fluorescent Beads ... 36
2.4.2 Blood Sample Pretreatment with Fluorescent Dye Assay ... 37
2.4.3 Blood Sample Measurement on Microfluidic Cytometer ... 39
2.4.4 WBC Count and WBC 2-Part Differential Count... 40
2.4.5 Correlation Study with Commercial Blood Cell Counter ... 42
2.5 Conclusion ... 45
Chapter 3 : Dye Assay for WBC Differential Count ... 47
3.1 Introduction ... 47
3.1.1 Fluorescent Assays for WBC Differential in Flow Cytometer ... 47
3.2 Experiment and Materials ... 51
3.2.1 Microfluidic Device and Fluorescent Detection System ... 51
3.2.2 Blood Sample and Fluorescent Beads Sample ... 54
3.3 Result and Discussion ... 56
3.3.1 System Calibration with Fluorescent Beads ... 56
3.3.2 Blood Sample Staining with Fluorescent Assays ... 58
3.3.3 WBC 4-Part Differential ... 61
3.3.4 Correlation Study of 4-Part WBC Differential ... 65
3.3.5 Cluster Overlap of Monocyte and Lymphocyte ... 66
3.3.6 Improved WBC 4-Part Differential ... 68
3.3.7 Validation of 4-Part Differential with Purified WBC population ... 70
3.3.8 Correlation Study of Improved 4-Part Differential ... 73
3.3.9 WBC 5-Part Differential Feasibility ... 76
3.3.10 Correlation Study of Total WBC Count ... 77
3.4 Conclusion ... 79
Chapter 4 : On-Chip Blood Cell Count ... 81
4.1 Introduction ... 81
4.1.1 Design Principle of Cartridge Chip ... 81
4.2.1 Principle ... 85
4.2.2 Material and Experiment ... 88
4.2.3 Results and Discussions ... 92
4.2.4 Conclusion ... 103
4.3 On-Chip Blood Staining with Fluorescent Dye Assay ... 104
4.3.1 Mixing in Microfluidics ... 104
4.3.2 Theory of Passive Hydrodynamic Focusing Mixer ... 105
4.3.2 Velocity Distribution in Hydrodynamic Focusing Mixer ... 106
4.3.3 Diffusion Analysis in Hydrodynamic Focusing Channel ... 108
4.3.4 Design of Hydrodynamic Focusing Channel ... 110
4.3.5 Material and Experiment ... 112
4.3.6 Result and Discussion ... 114
4.3.4 Conclusion ... 122
Chapter 5 : Microfluidic Cytometer for Biosensing of Microalgae ... 124
5.1 Introduction ... 124
5.1.1 Microalgae and Harmful Algal Bloom ... 124
5.1.2 Microalgae Sensing by Microfluidic Cytometer ... 126
5.1.3 Microalgae Population Monitoring and Algal Bioassay ... 128
5.4 Conclusion ... 140
Chapter 6 : Conclusion ...142
L
IST
OF
F
IGURES
Figure 2.1. Illustration of the basic principle of flow cytometry. ... 14
Figure 2.2. Illustration of the principle of the sheathless microfluidic cytometer for fluorescent detection of white blood cells in blood. ... 21
Figure 2.3. Comparison of the fluidic designs of conventional flow cytometer with the sheathless microfluidic cytometer. ... 22
Figure 2.4. Comparison of two sheathless channel designs. ... 23
Figure 2.5. The estimated coincidence error versus the interrogation channel dimension. ... 24
Figure 2.6. The fluorescent microscope images of white blood cells (WBCs) with Acridine Orange staining. ... 28
Figure 2.7. Layout design of the microfluidic channels for the sheathless cytometer... 29
Figure 2.8. Illustration of the fabrication process flow of the PDMS devices. ... 30
Figure 2.9. Photos of (a) the fabricated microfluidic device and (b) a zoomed-in photo of the fluidic channel. ... 31
Figure 2.10. The optical configuration of the two color fluorescence detection scheme... 33
Figure 2.11. The configuration of the prototype system for two-color fluorescence measurement. ... 34
Figure 2.14. Fluorescent image of two WBCs, a lymphocyte cell and a granulocyte cell, after the AO pretreatment. ... 38
Figure 2.15. Measured fluorescence signals from the whole blood sample pretreated with the AO dye assay, (a) green fluorescence and (b) red fluorescence. ... 39
Figure 2.16. Processed fluorescence signals from the whole blood sample pretreated with the AO dye assay (after a 4-point moving average digital signal processing filter): (a) Green fluorescence and (b) Red fluorescence. ... 40
Figure 2.17. Scatter plot of the measured green fluorescent intensities versus red fluorescent intensities. ... 41
Figure 2.18. Comparison of total WBC count results from the microfluidic cytometer and results from the commercial blood counter (Coulter LH750). ... 43
Figure 2.19. Comparison of the measured lymphocyte percentages from the microfluidic cytometer and results from the commercial blood counter (Coulter LH750). ... 45
Figure 3.1. The molecule structures of the (a) Propidium Iodide (PI), (b) Fluorescein Isothiocyanate (FITC) and (c) Basic Orange 21 (BO21). ... 50
Figure 3.2. The optical configuration of the system for measuring the laser-induced, two-color fluorescence. ... 52
Figure 3.3. Picture of the prototype system. ... 53
The histogram analysis of the measured beads intensities. ... 58
Figure 3.6. Fluorescent images of the WBCs after staining with the dye assay (Recipe I: PI and FITC). ... 59
Figure 3.7. Fluorescent images of the WBCs after staining with the dye assay (Recipe II: PI, FITC and BO21). ... 60
Figure 3.8. Fluorescence intensities of the WBC measured from the fluorescent microscope images. ... 61
Figure 3.9. Time trace of fluorescence signal (intensity versus time) of blood sample stained with Recipe I (PI and FITC). ... 62
Figure 3.10. The scatter plot of the fluorescence measurement data (green fluorescence intensity versus red fluorescence intensity). ... 63
Figure 3.11. Correlation between the results from the microfluidic cytometer and commercial hematology analyzer (Beckman Coulter LH750). ... 66
Figure 3.12. Identification of monocytes cluster. ... 67
Figure 3.13. Comparison of the WBC differential pattern of blood sample staining with (a) PI versus (b) PI and BO21. ... 69
Figure 3.14. Comparison of the WBC differential pattern of blood sample staining with Recipe I (PI and FITC) versus Recipe II (PI, FITC and BO21). ... 70
sample for the correlation study. ... 74
Figure 3.17. Correlation study of the WBC differential count results. ... 75
Figure 3.18. Correlation study of the absolute leukocyte count. ... 78
Figure 4.1. The design concept of the self-contained cartridge chip for minimizing manual operations. ... 82
Figure 4.2. The design principle of the cartridge chip. ... 83
Figure 4.3. The operation principle of the micro valve using blood thermal coagulation. ... 86
Figure 4.4. The operation principle of the laser induced blood clogging. ... 87
Figure 4.5. The test configuration of the back pressure measurement (left) and (right) a picture of a capillary tube with blood clog formed inside. ... 89
Figure 4.6. (a) Design and test principle of the microfluidic device for introducing thermal coagulum. (b) The port connection used for blood loading and pressure testing. 90
Figure 4.7. (a) The laser test platform modified from a Zeiss Axioskop 50 microscope, and (b) the basic optical configuration. ... 92
Figure 4.8. Blood coagulum formed at different heating temperatures (heating time 3min) in capillary tubes (1.4mm in diameter). ... 93
Figure 4.9. Measured maximum back pressure of the blood coagulum formed in capillary tubes vs. heating time with respect to different heating temperatures. ... 94
capillary tubes vs. heating temperature. ... 96
Figure 4.12. Comparison of coagulum formed with fresh blood (S1) versus stored blood (S2)... 97
Figure 4.13. Microscope pictures of the blood in a PDMS channel (100m channel height) (a) before and (b) after thermal coagulation. ... 98
Figure 4.14. Microscope pictures of the blood in a PDMS channel (a) before and (b) after laser-induced clogging. ... 100
Figure 4.15. Geometry designs of the laser-induced clogging valve. ... 101
Figure 4.16. Illustration of the design principle of a fixed volume, sample delivery scheme, where the laser-induced clogging valves are used for fluidic control. ... 102
Figure 4.17. Microscope pictures of the PDMS device which uses the laser-induced clogging valve in the delivery of a fixed volume of blood sample. ... 103
Figure 4.18. The illustration of the hydrodynamic focusing mixer design. ... 105
Figure 4.19. Analytical model of the hydrodynamic focusing mixer: (a) actual geometry, and (b) the dimensionless model. ... 106
Figure 4.20. Analytical model for convective-diffusive mixing in the mixing channel: (a) the physical geometry, and (b) the dimensionless model. ... 109
Figure 4.21. The simulation result of the dye concentration profile in the mixing channel. ... 112
Figure 4.22. The fabricated PDMS device of the hydrodynamic focusing mixer. ... 113
intensity across the mixing channel, at (a) length x=100m, (b) x=500m, (c) x=5m, (b) x=5mm. ... 117
Figure 4.25. Measured fluorescence intensities from the cytometer channel at the downstream of the mixer channel: (a) green fluorescence, and (b) red fluorescence. .... 120
Figure 4.26. Scatter plot of the WBC detection results measured from the cytometer channel with the on-chip mixer. ... 122
Figure 5.1. Optical configuration of the system for microalgae detection. ... 127
Figure 5.2. The test platform configuration of the microfluidic cytometer. ... 128
Figure 5.3. The molecule structures of (a) Fluorescein Diacetate (FDA) and (b) Fluorescein, and the basic principle of the hydrolysis process. ... 130
Figure 5.4. (a) The picture of the culture setup for microalgae samples, and (b) the microscope picture of the microalgae, Dunaliella, cells. ... 131
Figure 5.5. The measured time trace of the (a) red fluorescence signal and the (b) light extinction signal (intensity versus time) from the microalgae, Phaeocystis. ... 133
Figure 5.6. The scatter plots of the recorded data from (a) the sample with one type of microalgae, Phaeocystis, (b) the sample with two types of microalgae, Ostreococcus. ... 134
Figure 5.7. The measured time trace of the two-color fluorescence signals from the bioassay experiments. ... 135
Figure 5.8. The fluorescence microscope pictures of the microalgae sample. ... 136
L
IST
OF
T
ABLES
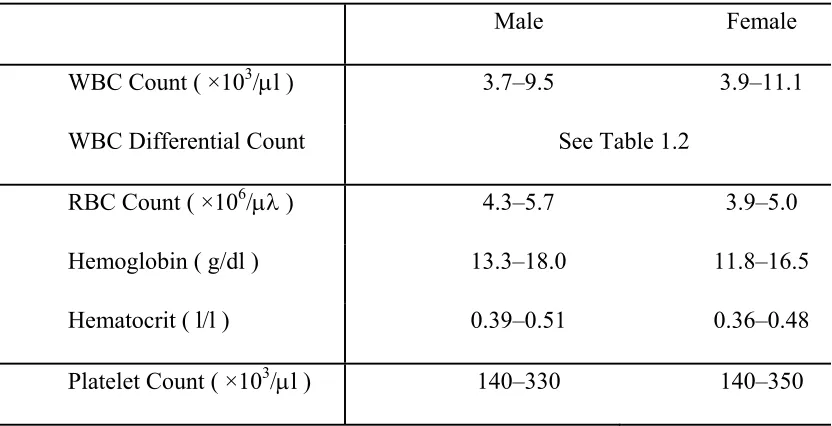
Table 1.1. Complete blood count and the normal ranges of the test parameter ... 2
Table 1.2. White blood cell differential count and the normal ranges ... 3
Table 1.3. Summary of the blood cell counting principles, image analysis, Coulter principle, and flow cytometry ... 5
Table 1.4. Comparison of the compact-sized blood cell counters with a state-of-the-art blood cell counter (Coulter LH750) ... 9
Table 2.1. Summary of cellular characteristics measurable by the flow cytometry principle ... 15
Table 2.2. Comparison of coincidence error vs. WBC concentration ranges in two designs of interrogation channel ... 25
Table 2.3. Comparison of coincidence error of the proposed microfluidic cytometer design with specification of a state-of-the-art counter (Coulter LH750). ... 26
Table 3.1. Comparison of the fluorescent dye assay and fluorescent-conjugated immuno-staining assay for WBC differential count. ... 48
Table 3.2. Comparison of the WBC count and WBC differential results between the microfluidic cytometer system and the commercial blood counter (Beckman Coulter LH750). ... 64
Table 3.3. The count results of the spiking experiments. ... 73
Table 3.4. Summary of the differential count results. ... 77
Table 4.1. Measured maximum back pressure of the blood clogs. ... 98
Chapter 1 : Introduction to Blood Cell
Count
1.1 Blood Cell Count and Its Clinical Significance
Blood is a body fluid that is vital to maintain life [1]. On average, a normal adult has 6 to 7 liters of blood in total. Approximately 45% of the blood is composed of cell elements, and the remaining 55% is the fluid portion, termed plasma. Remarkably, blood constantly circulates throughout the body and carries out a wide variety of important functions [2]. For example, it transports oxygen and nutrients to various organs and transfers substances such as messaging hormones to other tissues for use. At the same time, metabolic waste products from tissues are picked up and carried away by blood circulation. It is appreciated in modern hematology that many diseases cause changes in the composition of blood, and therefore, the analysis of blood is important in clinical diagnosis [3-5].
Numerous tests have been developed for the blood cell analysis, and one of the most widely used tests in clinical medicine is the complete blood count (CBC) [3, 5, 6]. The CBC test determines the quantities of the blood cells that present in blood, including WBCs, RBCs, and platelets. Particularly, the measurement of WBCs consists of the WBC count (the total number of WBC in per volume of blood) and the WBC differential count (the absolute numbers or percentages of different types of WBCs). The measurement of RBCs consists of the RBC count (the total number of RBCs in per volume of blood), hemoglobin (total amount of hemoglobin protein in per volume of blood), hematocrit (the volume ratio of RBCs in blood) and other RBC indices. Modern instruments for CBC tests can measure over 20 parameters. Table 1.1 and Table 1.2 summarize the most common parameters for the CBC test and the recommended normal ranges [3, 7, 8]. The commercial instruments dedicated for automatic CBC tests are normally referred as the Hematology Analyzer.
Table 1.1. Complete blood count and the normal ranges of the test parameter
Male Female
WBC Count ( ×103/l ) 3.7–9.5 3.9–11.1
WBC Differential Count See Table 1.2
RBC Count ( ×106/ ) 4.3–5.7 3.9–5.0
Hemoglobin ( g/dl ) 13.3–18.0 11.8–16.5
Hematocrit ( l/l ) 0.39–0.51 0.36–0.48
Table 1.2. White blood cell differential count and the normal ranges
WBC Type Absolute (×103/l ) Percentage (%)
Total WBC 3.7 – 11.1 100
Granulocyte
Neutrophil 1.7 – 7.5 40 – 80
Eosinophil 0.03 – 0.46 0 – 7
Basophil 0.02 – 0.09 0 – 1
Nongranulocyte
Lymphocyte 1.0 –3.2 15- 40
Monocyte 0.2 – 0.6 3 – 12
1.2 Development of Blood Cell Count Technology
Until 1950s, the clinical tests of the blood cell count relied mainly on the observation of blood film smear under an optical microscope[16]. The manual preparation of the blood smear and the following efforts to visually identify and enumerate the blood cells were laborious and time consuming. The test required a trained hematologist, and the results were subject to numerous sources of imprecision [5]. Therefore, there was strong push to develop automated blood cell count technologies [16]. Since the 1980s, the use of automated blood cell count instrument had become common in large clinical laboratories, which could carry out large quantities of tests every day thanks to the high throughput of the automated test procedure[17].
Table 1.3. Summary of the blood cell counting principles, image analysis, Coulter principle, and flow cytometry
Image Analysis Coulter Principle Flow Cytometer Detection Principle Detection Target
Optical Image Electrical Impedance Optical Intensity • scattering • absorption • fluorescence Sample Labeling
Needed Label free Label free: • scattering
Label needed: • absorption
• fluorescence
Capability CBC Yes Yes Yes
WBC Differential
5-part 3-part 5-part + WBC subtypes
Accuracy Low High High
Throughput Low High High
cell electrical opacity (Alternating Current impedance). It is able to deliver a 3-part WBC differential (lymphocyte, monocyte, and granulocyte), and still widely used in the automatic blood counters because of the merits of low reagent cost and label-free detection. However, the Coulter principle alone is not sufficient to distinguish all five major types of WBCs (lymphocyte, monocyte, neutrophil, eosinophil and basophil) [16]. Therefore, it is often used in parallel with other detection methods, such as light-scattering detection, to extend the capability of distinguishing WBC types [20-25].
The flow cytometry principle is a general platform technology where single cells could be accurately quantified in suspension with high throughput, and the quantitative methods mainly involve optical detections such as light scattering, light absorption and fluorescence detection [16]. It is widely appreciated as a powerful technique which has a significant impact on various fields of biology and medicine [26-30]. However, most flow cytometers are quite complex to operate and need careful calibration. Some relatively simplified versions have been developed for the specific purpose of blood analysis [20, 31-38]. For measurement by the flow cytometer, blood samples usually need to be treated with labeling reagents (fluorescent dyes, fluorescent conjugated antibody assay, etc.) beforehand to introduce the cell labels for the optical detections.
hour achievable on state-of-the-art instruments, and the increase of test parameters provided. For some parameters, such as WBC and RBC count, hemoglobin concentration, or RBC indices (e.g., mean corpuscular volume), the analytical performance of the automated counter is generally excellent. For others, in particular, the WBC differential count, the test performance is still less than satisfactory[15].
1.3 Needs of Portable Blood Cell Count Technology
In recent years, there are many newly emerging applications which require portable, easy-to-use blood cell count technologies [6, 39-41]. For example, the NASA human spaceflight program is actively searching for a portable and space-usable blood cell count technology, particularly for the tests of the WBC count and the WBC differential. It has been well-known since early Gemini and Apollo mission that various medical events happened repeatedly to astronauts in space, and the Space Shuttle Program alone reported 1867 medical events from 1981 to 1998 including the viral and bacterial infections [42]. However, there is currently a gap of medical feasibilities to provide the in-flight diagnostic information for these medical events. A portable blood cell count technology could provide an important first step to bridge this gap [43]. In addition, a portable blood cell count, particularly the test of WBC count can be a powerful technique to monitor the radiation effects on human body, one of the most important biomedical issues for long-term human space flight. Furthermore, such a portable blood analysis technology is also very useful for on-earth, point-of-care applications such as telemedicine, bedside healthcare, and medical care in remote rural areas [44-46].
portable instrument size (e.g., handheld), easy-to-use test procedure (with minimal training), minimized sample volume (both blood sample and consumable reagents), and favorably a long shelf life. The requirement of long shelf life is particularly critical for NASA space applications, as a long-term flight mission could last from 6 months to 2 years.
However, the state-of-the-art blood cell counters are not optimal to meet the emerging needs of portable instruments. First of all, the modern blood cell counters have been evolving into cumbersome machines with large volume and heavy weight [40]. As the consequence, the CBC test is mostly carried out in central clinical laboratories, but not available for point-of-care sites such as physician offices, emergency room and other near-patient settings. Secondly, a large volume of reagent (dilution buffer, sheath buffer, etc.) is normally consumed to perform the test, and the necessary storage volume impedes the miniaturization of instruments. In addition, the blood sample needed for testing on the automated blood cell counters usually requires the collection by vein blood drawing, which is not favorable in portable applications [25].
competent compared to the 5-part WBC differential count (lymphocyte, monocyte, neutrophil, eosinophil and basophil) provided in the central laboratories.
Table 1.4. Comparison of the compact-sized blood cell counters with a state-of-the-art blood cell counter (Coulter LH750)
Model Coulter LH750 Sysmex pocH-100i Chempaq XDM70 HemoCue WBC Instrument Size
(cm × cm × cm)
89 × 102 × 61 19 × 35 × 46 25 × 36 × 27 14 × 12 × 19
Weight (kg) 93 14 4 1
Power Consumption (W) 2080 150 100 Battery
Blood Collection Venipuncture Venipuncture Finger-prick
Finger-prick
Performance
CBC Count Full Full Full Part
WBC Differential
5-Part 3-Part 3-Part N/A
Throughput (minute/ test) 0.5 3 3 3
1.4 Microfluidics for Blood Cell Counting
interchangeably with lab-on-a-chip (LOC) and micro-total-analysis-system (TAS). The development of the microfluidic system started around 1980s, and progressed rapidly in the last two decades as a promising alternative in improving modern biology and chemistry laboratory processes. In 1979, Terry et. al. developed a gas chromatography device on silicon, marking the invention of the first microfluidic devices [55]. In the mid-1990s, the field of microfluidic stepped into a booming stage, which was shown by the dramatic increase in the number of patents related to microfluidics from 1994 to 2004 [56]. The history of microfluidics development and the challenges for wide acceptance of microfluidic devices in practical applications have been discussed extensively elsewhere [53, 57-61].
Because of these merits, microfluidic devices are considered great tools for miniaturizing medical diagnostics, and a great amount of microfluidic-based biomedical sensing technologies has been developed in the last decade [39-41, 70]. To name a few examples, i-State successfully commercialized the technology of using microfluidic integrated sensor for blood gas analysis [71]; recently Pipper et al. developed a complete microfluidic platform to detect the avian influenza virus H5N1 [72]; extensive efforts have been also devoted to developing microfluidic-based, point-of-care diagnosis and monitoring of infectious diseases such as HIV/AIDS, malaria and tuberculosis for developing countries [73]. The recent advances of microfluidics in the biomedical sensing field, including development of new fabrication materials, device architecture for fluidic manipulation on-chip, sensor integration with microfluidics, have been discussed in detail elsewhere [70].
devices, such as the evaluation of protein expression on WBCs [79], and the enumeration of two WBC subtypes (CD4+ lymphocyte cells and CD8+ lymphocyte cells) in HIV diagnosis [80, 81]. Reference [40] provides a good review of the recent progress of using microfluidic device for blood cell analysis.
1.5 Needs of Future Development
Nevertheless, there is still a lack of the microfluidic technologies that bridge the gap between the need of high-performance blood count and the strict requirement of portable applications. The feasibility of total WBC count and a 3-part WBC differential have been demonstrated in the Coulter approach [77] and the flow cytometry approach in microfluidics [82]. However, it is still limited compared with the 5-part WBC differential count provided by the modern laboratory blood counters. In addition, the immuno-assays used in the previous approaches [75, 80-82] suffer the limitations of low storage (e.g., 4°C) and short shelf life, while requirements of long shelf life and room temperature storage are important concerns for point-of-care applications.
Chapter 2 : Microfluidic Cytometer for
White Blood Cell Count
2.1 Introduction
2.1.1 Flow Cytometry Principle
Cytometry is a process for measuring the physical and chemical characteristics of biological cells. In flow cytometer, the measurements are made as cells flow through the instrument in a liquid stream. Figure 2.1 illustrates the basic configuration of a flow cytometer, where a narrow stream of fluidic sample containing the cells passes through the center region of a laminar sheath flow. This setting is referred as hydrodynamic focusing, and the result is the passage of physically separated individual cells through the interrogation area. Two major principles have been widely used for cell detection including optical measurement and electrical impedance measurement. The electrical impedance measurement is derived from the Coulter principle, and adopted in flow cytometers mainly for the purpose of blood cell analysis. The optical measurement is more commonly used, and the parameters measurable include light scattering, light extinction, light absorption, and fluorescence, etc.
Figure 2.1. Illustration of the basic principle of flow cytometry.
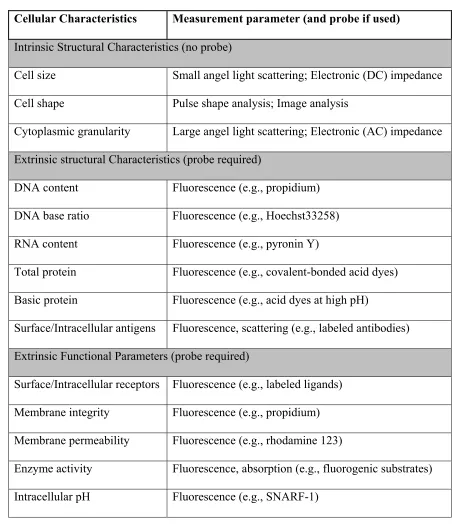
Table 2.1. Summary of cellular characteristics measurable by the flow cytometry principle
Cellular Characteristics Measurement parameter (and probe if used) Intrinsic Structural Characteristics (no probe)
Cell size Small angel light scattering; Electronic (DC) impedance Cell shape Pulse shape analysis; Image analysis
Cytoplasmic granularity Large angel light scattering; Electronic (AC) impedance Extrinsic structural Characteristics (probe required)
DNA content Fluorescence (e.g., propidium) DNA base ratio Fluorescence (e.g., Hoechst33258) RNA content Fluorescence (e.g., pyronin Y)
Total protein Fluorescence (e.g., covalent-bonded acid dyes) Basic protein Fluorescence (e.g., acid dyes at high pH)
Surface/Intracellular antigens Fluorescence, scattering (e.g., labeled antibodies) Extrinsic Functional Parameters (probe required)
Surface/Intracellular receptors Fluorescence (e.g., labeled ligands) Membrane integrity Fluorescence (e.g., propidium) Membrane permeability Fluorescence (e.g., rhodamine 123)
The extrinsic cellular characteristics, on the other hand, provide a wider spectrum of measurement for blood cell analysis. For example, the measurement of protein antigens, including the surface antigens and the intracellular antigens, can deliver not only the complete 5-part WBC differential, but also measurement of abnormal and immature WBCs, and hundreds of WBC subtypes (e.g., CD4+, CD8+, etc.). The detection of the extrinsic characteristics is normally carried out by fluorescence measurement, and the cells need to be prelabeled by fluorescent probes to introduce the signal. Two major types of fluorescent probes have been developed: fluorescent dyes and fluorescent-conjugated proteins. The fluorescent dyes are used to measure the cellular contents such as nucleic acid, esterase, etc. The fluorescence-conjugated proteins are used to measure the antigen proteins, thus most powerful for WBC differential. In modern flow cytometry, multiple channels of fluorescence signals (e.g., 16 channels) can be detected simultaneously to provide comprehensive cell analysis.
2.1.2 Problem of Implementing Flow Cytometry in Portable Analysis
Despite the virtues discussed above, there are several drawbacks impeding the implementation of flow cytometry in point-of-care blood analysis:
(1) Non-portable instrument size; (2) Large volume of blood sample;
(3) Large volume of consumable reagents.
preparation, optical calibration, etc. Trained technicians are needed to carry out these operations. For point-of-care applications, the instruments would be used in near patient settings, such as physician offices and emergency rooms, and the end users would be physicians, nurses or even patients themselves. A portable instrument size and easy-to-use test procedure are necessary.
Secondly, the volume of the blood sample needed for flow cytometer analysis is not optimal for point-of-care applications [39-41]. For example, a modern cytometry based blood counter (e.g., Coulter LH750) consumes a sample volume of 100 to 400 l. To provide this amount of blood, venipuncture procedure is necessary for the sample collection. An alternative procedure of fingerprick for sample collection (e.g., 1-5 drops of blood) is more favorable for point-of-care applications.
Thirdly, the need of large volume of consumable reagents further impedes the use of flow cytometry [39, 40]. Two major sources of the consumables include the dilution buffer for sample preparation and the sheath buffer in hydrodynamic focusing. For example, in the commercial cytometry-based blood counter (e.g., Coulter Act-5diff), a 100× dilution is used for the WBC count test. In addition, a sheath buffer of 250 to 1,000 ml is needed for hydrodynamic focusing of every 1 ml of sample in the flow cytometer [84]. The storage of these consumable reagents constrains the miniaturization of the flow cytometer.
Above all, the development of a portable, cost-effective and easy-to-use cytometry technology is still urgently needed for the application of portable blood analysis.
2.1.3 Microfluidic Cytometer Technology
alternative [39, 40, 62, 64, 70, 73]. In microfluidic cytometer, chip-based fluidic system is used to replace the conventional fluidic system. In addition, optical components such as lens, filter and waveguide for light detection could also be integrated into the same chip. By nature, microfluidic cytometer offers the potential of substantially reducing the instrument footprint and consuming much less amount of samples. In addition, microfluidic cytometer chips allow for parallel, cost-effective fabrication, suitable for disposable applications.
The recent development of microfluidic cytometer have been reviewed elsewhere [62, 63, 70]. The current efforts have been directed mainly towards two areas, the miniaturization of the fluid handling components (e.g., pump, valve, etc.) and the optimization of the hydrodynamic focusing in microfluidics. Particularly, various approaches for hydrodynamic focusing have been investigated, including active focusing (e.g., one dimensional flow focusing, two-dimensional flow focusing, dielectrophoretic particle focusing, etc.), and passive focusing (e.g., groove generated sheath flow, no sheath flow, etc.). However, much less efforts have been devoted to the development of assays, which are optimal for microfluidic applications.
2.1.4 Previous Art of Microfluidic Cytometer for Blood Analysis
Altendorf et al. first reported implementing a silicon-based microfluidic cytometer for blood cell counting [74]. They used wet etching to micro-fabricate a V-groove shaped fluidic channel on a silicon substrate, and then pumped the blood samples through the channel for optical detection. Light scattering measurement was carried out and detection of RBCs and WBCs was demonstrated in this approach.
count. The microfluidic device was built by hot embossing of thermoplastic material (polycarbonate), and the obtained structures were used to provide a two-dimensional hydrodynamic focusing. Blood samples were pretreated with fluorescent-conjugated immune-assays and the optical detections including light scattering and fluorescence measurement were carried out on a microscope-modified system. They were able to demonstrate the 3-part WBC differential (lymphocyte, monocyte and granulocyte) and the count of lymphocyte subtypes.
Meanwhile, Holmes et al. reported the counting of blood cells on a microchip by measuring electrical impedances [76, 77]. The microchip was fabricated by whole wafer bonding of two glass substrates with polyimide structures to define the microfluidic channels, and metal electrodes were prepatterned electrodes on the substrates. When pre-treated blood sample flow through the microfluidic device, electrical impedance changes caused by individual cells were measured at multiple AC frequencies. With this method, they were able to demonstrate the count the WBCs, RBCs and platelets, as well as the feasibility of the 3-part WBC differential count.
Besides, there were also reports of using microfluidic cytometry approaches to carry out other blood cell analysis, such as the evaluation of protein expressions on WBC surface [79], and the enumeration of two WBC subtypes (CD4+ lymphocyte cells and CD8+ lymphocyte cells) in HIV diagnosis [80, 81], etc.
diseases such as parasite infection and allergy [5], and could be very useful in point-of-care applications [85]. Second, most efforts have been devoted to the improving the microfluidic design, but few efforts have been taken to optimize the detection assays for the portable applications. For example, the immunological assays used in microfluidic cytometers discussed above, are developed for use in the conventional flow cytometer. There are several drawbacks to use these immunological assays for point-of-care applications, including limited shelf life, low-temperature storage and high assay cost. These drawbacks create extra barriers for implementation in resource-limited areas. Thirdly, the reagent volumes needed in these approaches are still high. For example, hydrodynamic focusing with sheath flow was used in the previous approaches, which significantly increased reagent volume needed. The two dimensional sheath focusing used by Kummrow et al. and Frankowski et al.[75, 82], consumed a sheath buffer of more than 1200l for testing each 10l blood sample. The consumption of the buffer reagents remained a significant size limitation.
2.2 Sheathless, Fluorescent Microfluidic Cytometer for WBC
Count
2.2.1 Basic Principle
through the interrogation area, until finishing the measurement of the whole sample. Dye-based assays are utilized in this approach to introduce the fluorescence signals of WBCs. Before measurement, blood sample is pretreated with a dye assay, which selectively stains WBCs in the blood. Therefore, as the sample flows through the sheathless channel, WBCs can be detected by their fluorescent emissions. Furthermore, the measured fluorescence intensities are used to identify different WBC types.
Figure 2.2. Illustration of the principle of the sheathless microfluidic cytometer for fluorescent detection of white blood cells in blood. The detection is carried out as the
sample continuously flows through the sheathless channel.
Figure 2.3. Comparison of the fluidic designs of conventional flow cytometer with the sheathless microfluidic cytometer. The sheathless microfluidic cytometer uses the fluidic
channel to confine the sample into a narrow stream for detection, whereas the conventional cytometer uses hydrodynamic focusing.
Three major considerations of this approach, including the design of the sheathless channel, the development of the dye-based assay, and the optical detection system, are discussed in the following sections.
2.2.2 Design of Sheathless Cytometer Channel
There are two major considerations in designing the sheathless detection channel. On one hand, the channel has to be large enough so that human blood cells could freely flow through the channel. Considering the normal range of the blood cells in circulating blood, e.g., WBC 10-20m, RBC 6-8m, platelet 1.5-3m in diameter [3], the cross section of the channel should be at least larger than 20m×20m. On the other hand, a larger detection channel would increase the possibility that multiple WBCs flowing through the interrogation area together and being measured as one cell, as illustrated in Figure 2.4. This possibility is referred as the coincidence error [16].
Figure 2.4. Comparison of two sheathless channel designs. (Left) Design with larger channel versus (Right) design with smaller channel (cross section area). In the larger channel design, the possibility is higher that multiple cells of interest would pass through
The relationship between the coincidence error and the channel dimension can be approximated by a Poisson Process [86]. Considering the volume of the interrogation zone (one portion of the sheathless channel, length of which is defined by the light illumination) is V, the average concentration of WBCs in blood is c, then the possibility of n WBCs flowing through the interrogation area together can be estimated as a Poisson Distribution [86]:
( ) n c V / !
P n c V e n (1)
The coincidence error P, which is the possibility of two or more WBCs flowing through the interrogation area together, can be expressed as [86]:
1 (1 ) c V
P c V e (2)
Figure 2.5. The estimated coincidence error versus the interrogation channel dimension.
According to Equation (2), the coincidence error can be calculated as a function of the volume of the interrogation channel, as illustrated in Figure 2.5. In this example, the WBC concentration in blood is assumed to be 10,000 WBCs/l, which is a normal value for a healthy adult [3]. The coincidence error decreases rapidly when the volume of the interrogation zone is reduced. For a given volume of the interrogation zone, the dilution of the sample (e.g., 10×dilution), which equivalent to a reduced WBC concentration, also reduces the coincidence error.
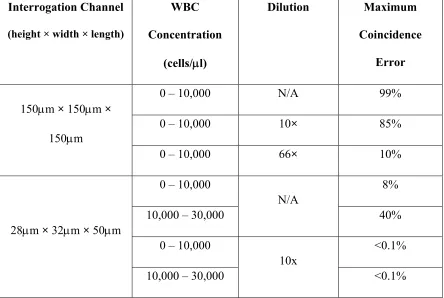
Table 2.2. Comparison of coincidence error vs. WBC concentration ranges in two designs of interrogation channel
Interrogation Channel (height × width × length)
WBC Concentration (cells/l) Dilution Maximum Coincidence Error
150m × 150m × 150m
0 – 10,000 N/A 99%
0 – 10,000 10× 85%
0 – 10,000 66× 10%
28m × 32m × 50m
0 – 10,000
N/A
8%
10,000 – 30,000 40%
0 – 10,000
10x
<0.1%
The coincidence errors of two interrogation channel designs are compared in Table 2.2. For a WBC concentration of 10,000 WBCs/l, the larger interrogation channel design (150m×150m×150m) requires a 66× dilution to reduce the coincidence error less than 10%. On the other hand, the smaller interrogation channel design (28m×32m×50m) needs no dilution to achieve a less than 10% coincidence error. The 10% error is chosen for comparison here as it is the maximum tolerance for the WBC count accuracy in the standard of point-of-care applications. The difference demonstrates the advantage of using a smaller channel as the interrogation area. With a 10× dilution, the coincidence error in the second design is less than 1% even for the abnormal high range of WBC concentration (10,000 to 30,000 WBCs/l).
Table 2.3. Comparison of coincidence error of the proposed microfluidic cytometer design with specification of a state-of-the-art counter (Coulter LH750). The cytometer
channel has a dimension of 28m × 32m × 50m.
WBC Concentration
(cells/l)
Microfluidic Cytometer Commercial Blood Counter Reagent Consumption Coincidence Error Reagent Consumption Mean Error Specification
0 – 10,000 No sheath buffer
10x dilution
<0.1% Sheath buffer
~100x dilution
3.5%
Table 2.3 compares the proposed sheathless microfluidic cytometer design with a state-of-the-art blood counter instrument (Coulter LH750) for their needs of consumable reagent in the WBC Count test [25]. The coincidence error of the microfluidic cytometer is tolerable comparing to the error tolerance range of the commercial instrument. In addition, the reagent consumption of the microfluidic cytometer is much less than the commercial instrument, and therefore, optimal for miniaturizing the WBC count.
2.2.3 Dye-Based Assay and Fluorescent Detection of WBCs
Dye-based assays are used in the proposed microfluidic cytometer for selective staining of the WBCs in blood sample. Human blood consists of a mixed population of three types of cells, WBCs, RBCs and platelets. In order to detect the WBCs, selective staining is used here to introduce fluorescence to WBCs for measurement. One feature that distinguishes WBCs from the RBCs and platelets is the cellular nucleus (mature RBCs and platelets have no nucleus). By using a dye with high binging affinity for the nucleus, such as nucleic acid dye, the WBCs can be selectively stained in the whole blood sample.
One major benefit of the fluorescent detection of WBCs is the minimal sample volume. In normal human blood, the concentrations of RBCs (4-6×10⁶ cell/l) and platelet (150-400×103 cell/l) are much higher than WBCs (4-10×103 cell/l). Therefore, when each WBC flows through the sheathless detection channel, it is actually companioned by many RBCs and platelets. In the detection methods such as impedance or light scattering measurement, large sample dilution (~100× dilution) is usually needed to minimize this interference, particularly the interference of RBCs. In the fluorescent detection, on the other hand, no or minimal dilution is needed, because RBCs and platelets have negligible fluorescence. Therefore, the sample volume needed is minimized.
Figure 2.6. The fluorescent microscope images of white blood cells (WBCs) with Acridine Orange staining. (a) Green emission (510-550nm) fluorescence image of a WBC, where the nucleus shows a high intensity of fluorescence; (b) red emission
(580-640nm) fluorescence image of the same WBC; (c) fluorescence image (510-550nm) of whole blood sample, where the WBCs are distinguished from other cells by their high
2.3 Experiment and Material
2.3.1 Device Layout
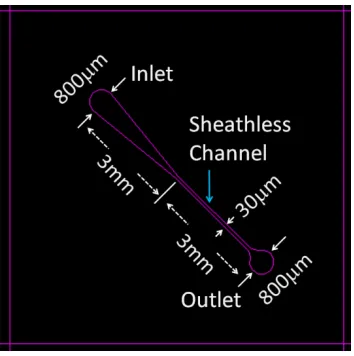
Fig. 2.7 shows the layout design and dimensions of the sheathless microfluidic channel. The fluidic channel consists of a sample inlet, a convergent channel, a straight channel to provide the sheathless interrogation zone, and a sample outlet. The inlet and the outlet are round holes with a diameter of 800m. The width of the sheathless channel was design to be 30m in the layout, and the total length was designed to be 3mm.
Figure 2.7. Layout design of the microfluidic channels for the sheathless cytometer.
2.3.2 Device Fabrication
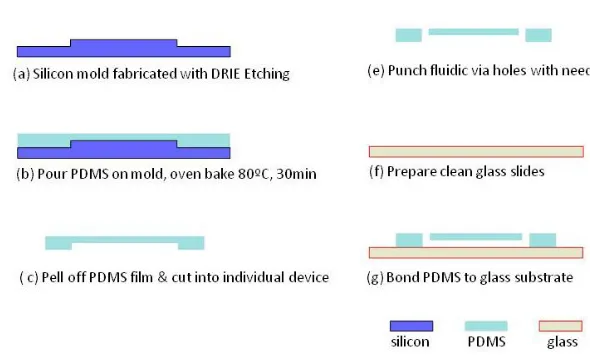
measured by a surface profiler (P15 Surface Profiler). Second, two parts of the PDMS prepolymers (Sylgard 184, Dow Corning, MI, USA) were mixed in a 10:1 ratio. After degassing in vacuum for 30 minute, the mixture was poured on top of the silicon mold, and cured in a preheated convection oven at 80˚C for 30 minutes to partially solidify the PDMS. After thermal curing, the PDMS was peeled off the mold and cut into individual devices. The fluidic via (i.e., inlet and outlet) were punched through the PDMS block with a stainless steel hypodermic needle (gauge 19, out diameter ~1.1mm). Afterwards, the PDMS block was left cleaning in an ultrasonic water bath for 5 minute, rinsed first with acetone and then isopropyl alcohol, and blow dried with compressed air. The devices were left to dry up in air for 20 minutes. Finally, the PDMS blocks were bonded to a clean glass slide (Plain Micro Slides, 25×75mm, VWR, USA) and cured in oven at 100˚C for 30 minutes to form the final device.
Figure 2.8. Illustration of the fabrication process flow of the PDMS devices.
by the dimension of the silicon mold, is approximately 32m in width and 28m in height. The PDMS soft lithography process is chosen here for two major reasons. First, PDMS soft lithography is a standard microfabrication technique, which has the merits of easy and robust fabrication process. Second, PDMS and the glass substrate have excellent optical transparency in the wavelength range of this study (460nm to 700nm), therefore are suitable for the optical measurement.
(a)
(b)
Figure 2.9. Photos of (a) the fabricated microfluidic device and (b) a zoomed-in photo of the fluidic channel.
2.3.3 Blood Sample
Blood samples were purchased from HemaCare Corp., CA, USA. Venous blood (4ml) was drawn from healthy donors and collected into VacutainerTM tubes (K
and all experiments were carried out within 24 hour after the blood drawing. For each sample, one extra vial of blood was collected and sent to a clinical laboratory (USC Clinical Reference Laboratory, USA) for independent blood count analysis on a hematology analyzer LH750 (Beckman Coulter, USA), and the CBC report with the WBC differential count was provided as reference data.
2.3.4 Fluorescent Dye Assay
The fluorescent dye, AO, was purchased from Sigma-Aldrich, USA (concentration 10mg/ml in water solution). The purchased dye solution was kept in room temperature for storage and shielded away from direct light illumination. The AO stock solutions used in the experiments were prepared by diluting the purchased AO solution (10mg/ml) with the phosphate buffer saline (PBS) solution (Invitrogen, USA) to the final concentrations needed.
2.3.5 Optical Configuration for Fluorescent Detection
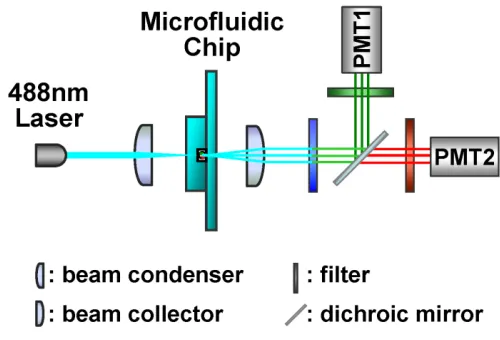
Figure 2.10. The optical configuration of the two color fluorescence detection scheme.
A prototype system was built with commercial, off-shelf components. A blue light-emitting diode (Royal blue Lumileds LED, Philips, 700mw, central wavelength 455nm) was used as the light excitation source. The emitted light was first passed through an optical slit (aperture width 50m), and then focused onto the microfluidic interrogation channel by an optical condenser. The orientation of the slit was perpendicular to the orientation of the fluidic channel. The length of the interrogation area, as defined by the light illumination spot on the microfluidic channel, was controlled by the width of the slit. An excitation filter (band-pass filter, 440-480nm) was used in front of the slit to purify the light illumination wavelength.
channel. A high-pass filter (cut-off wavelength 590nm) was placed in front of the red fluorescence channel to purify the measured red fluorescence wavelength range. A band-pass filter (510-560nm) was placed in the green fluorescence channel to remove the residual excitation light and to purify the measured green fluorescence wavelength range. The intensities of the green fluorescence and red fluorescence were finally measured by two photon-multiplier tubes (PMT, Hamamatsu H5784).
Figure 2.11. The configuration of the prototype system for two-color fluorescence measurement.
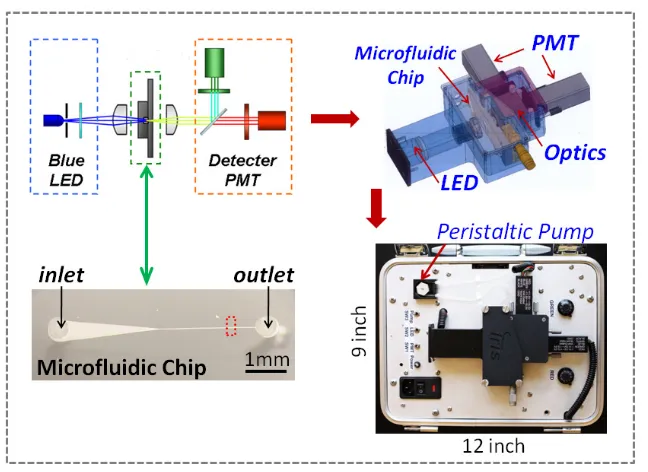
2.3.6 Portable Detection System
intensities into digitalized signals, and the power converting units for powering the LED and the PMT modules, were all enclosed inside an aluminum case beneath the optical components housing. The whole system was built into a self-contained package with a dimension of 12 inch in length, 9 inch in width, and 5 in height.
The test samples were loaded through a silicone tubing (P625/10k.015, Instech, USA) connecting to the microfluidic chip inlet. And a mini peristaltic pump (P625, Instech, USA) was connected to the outlet of the microfluidic chip using silicone tubing. The samples were drawn through the microfluidic chip by the suction force provide by the peristaltic pump, and the test waste was collected in a plastic tube downstream.
The system was powered by the standard AC power source (110V AC, 80Hz) and the measured data was read out through a standard Universal-Serial-Port (USB) port and recorded on a laptop computer for further data analysis. Figure 2.12 shows a picture of the whole system configuration including the prototype system and a laptop computer. The operation of the prototype system was controlled by a Labview (National Instrument, USA) program running on the laptop computer.
2.4 Result and Discussion
2.4.1 System Evaluation with Fluorescent Beads
The overall system was first evaluated with 5m diameter green fluorescent beads (Duke Scientific Corporations, USA) to study the optical detection performance. The beads were suspended in PBS solution to a final concentration of approximately 2×10³ beads/l as the test sample. A pumping rate of 6l/min was used to draw the sample through the sheathless microfluidic channel for measurement, and the average flow velocity of the sample inside the interrogation area, calculated by the pumping rate divided by the cross sectional area of the fluidic channel, was about 110m/msec. A sampling rate of 50kHz (one recorded measurement every 0.02msec) was used in the measurement, which was limited by the maximum sampling rate of the data acquisition unit used.
Figure 2.13. Recorded signals from the green fluorescent beads. The high peaks represent the fluorescent bead events measured.
voltages from the PMT sensor (green fluorescence channel). The background fluorescence had a DC level of about 0.450V and the average peak-to-DC noise amplitude was approximately 0.035V. The fluorescent peaks represented the events that fluorescent beads flowed through the interrogation area. Each peak represented one bead event counted, and the height of peak was recorded as the measured fluorescence intensity of the bead event. The average peak intensity of the recorded bead events was 0.340V. The signal-to-noise ratio (SNR) of the beads measurement is defined as:
10
20 log signal to DC noise to DC
V SNR
V
(3)
Given the signal intensity Vpeak-to-DC of 0.340V and the noise intensity Vnoise-to-DC of 0.035V, the SNR was calculated to be approximately 20dB.
2.4.2 Blood Sample Pretreatment with Fluorescent Dye Assay
Figure 2.14. Fluorescent image of two WBCs, a lymphocyte cell and a granulocyte cell, after the AO pretreatment. The photos were taken on a fluorescence microscope (Nikon Eclipse E800) with a mercury lamp excitation. The wavelength range of the measurement band, including excitation (Ex) and emission (Em), are shown as follows. Green band: Ex 460-490nm, Em 510-560nm; red band: Ex 520-550nm, Em 590-650nm; Double band: Ex
475nm-490nm and 545-570nm, Em 510-540nm and 580-630nm.
2.4.3 Blood Sample Measurement on Microfluidic Cytometer
The pretreated blood samples were then loaded to the prototype system for fluorescent measurement. While the blood sample continuously flowed through the interrogation channel, the measured fluorescence intensities were recorded. Figure 2.15 shows measured raw signal from the prototype system, without external signal processing. The measured signals showed high intensity peaks among the relatively noisy background. The green peaks were introduced by the AO binding to the nucleus of the WBCs, whereas the red peaks were introduced by the AO binding to the RNA contents in the WBC cytoplasm. The green fluorescence had relatively higher background noise than the red fluorescence. This difference was contributed to the residual AO molecules remaining in the sample, as the residual AO molecules had a green fluorescent emission (emission peak 520nm), overlapping with the green emission of AO binding to DNA.
[a] [b]
Figure 2.15. Measured fluorescence signals from the whole blood sample pretreated with the AO dye assay, (a) green fluorescence and (b) red fluorescence.
[88]. Figure 2.16 shows the processed results of the same data shown in Figure 2.15. The SNR of the green fluorescence, as calculated by Equation (3), increased from 5dB of the raw data to 14 dB of the processed data, whereas the SNR of the red fluorescence increased from 10 to 20dB.
[a] [b]
Figure 2.16. Processed fluorescence signals from the whole blood sample pretreated with the AO dye assay (after a 4-point moving average digital signal processing filter): (a)
Green fluorescence and (b) Red fluorescence.
2.4.4 WBC Count and WBC 2-Part Differential Count
The data of the measured fluorescent intensities was first analyzed to count the number of the WBC events detected. The WBC event was defined as one high peak from the measured data, which was contributed to the AO-stained WBC flowing through the interrogation channel. For each event, the height of the green fluorescence peak and the height of the red fluorescence peak were recorded. A custom Matlab code was used to repeat this analysis on the recorded data for the whole sample. The analysis results included the total number of the detected WBC events, NWBC, plus both the green and red
a scatter plot of red fluorescence intensity versus green fluorescence intensity, as shown in Figure 2.17.
Figure 2.17. Scatter plot of the measured green fluorescent intensities versus red fluorescent intensities. Each dot represents one white blood cell event recorded.
these two populations, where the boundary was assigned as a straight line between the two clusters, as shown in Fig. 2.17. The number of dots in each of the two clusters, Nlymphocyte
and Nnon-lymphocyte were then recorded.
The total WBC count and a WBC 2-part differential count (lymphocyte vs. nonlymphocyte) were then obtained by the following calculation:
/
WBC WBC sample
C N V , (4)
/ 100%
Lymphocyte lymphocyte WBC
P N N , (5)
/ 100%
Non Lymphocyte non lymphocyte WBC
P N N
, (6)
where CWBC is the WBC count and Vsample is the total volume of blood sample tested. And
we also have the following equations: 1
non Lymphocyte Lymphocyte
P P (7)
Because
non Lymphocyte WBC lymphocyte
N N N . (8)
For the given example shown in Figure 2.17, NWBC = 30470 cells, Nlymphocyte = 8227
cells, Nnon-lymphocyte= 22243 cells, and Vsample= 5l. Table 2.4 summarizes the results of the
WBC count and the WBC 2-part differential count according to Equation (4-6).
2.4.5 Correlation Study with Commercial Blood Cell Counter
carried out on the microfluidic cytometer, and the average value was used to be compared with results from the commercial counter.
Figure 2.18. Comparison of total WBC count results from the microfluidic cytometer and results from the commercial blood counter (Coulter LH750). Error bar shows the variation of three measurement of the same sample on the microfluidic cytometer. The linear relationship is obtained by linear aggression, as shown in the blue solid line (the green dash line represents a linear relationship of y=x). The correlation coefficient (R2)
and the inaccuracy as defined in Equation (10) are also shown.
Figure 2.18 shows the results of the total WBC count from the microfluidic cytometer, CWBC, MicrofluidicCytometer, comparing with the result from the commercial counter,
CWBC, CommercialCounter. The measured WBC count covered a range from 4000 to 9000
slightly but consistently lower than the reference results. This difference was contributed to the cell loss caused by part of the WBCs adhering to the sample loading silicone tubing. Nevertheless, the maximum inaccuracy was still less than 9%, acceptable comparing to the inaccuracy tolerable range for clinical significance (10%). The measurement inaccuracy is defined as:
, ,
,
100% WBC MicrofluidicCytometer WBC CommercialCounter
WBC CommercialCounter C C Inaccuracy C
. (9)
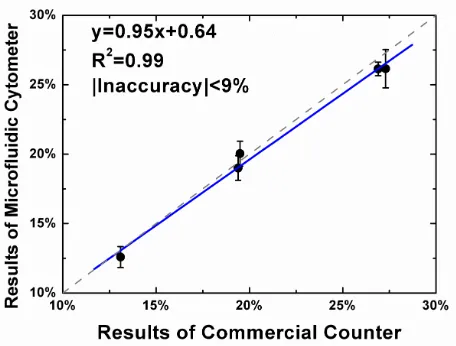
Figure 2.19 shows the results of the lymphocyte percentage measured from the microfluidic cytometer, Plymphocyte, MicrofluidicCyometer, comparing with the results from the
commercial counter, Plymphocyte, CommercialCounter. The nonlymphocyte percentage, as shown in
Equation (7), is determined once the lymphocyte percentage is known. The measured lymphocyte percentage covered a range from 12% to 25%. The measured results from the microfluidic cytometer showed good agreement with the reference results from the commercial counter (R2 correlation coefficient 0.99). In addition, a good linearity (y=0.95x+0.64) was also observed from the comparison. The maximum inaccuracy, as defined in Equation (10), was less than 9%, and acceptable comparing to the inaccuracy tolerable range for clinical significance (10%).
, ,
,
100% lymphocyte MicrofluidicCytometer lymphocyte CommercialCounter
lymphocyte CommercialCounter P P Inaccuracy P
Figure 2.19. Comparison of the measured lymphocyte percentages from the microfluidic cytometer and results from the commercial blood counter (Coulter LH750). Each data point represents blood sample from a different donor. Error bar shows the variation of
three measurement of the same sample on the microfluidic cytometer. The linear relationship is obtained by linear aggression, as shown in the blue solid line (the green dash line represents a linear relationship of y=x). The correlation coefficient (R2) and the
inaccuracy as defined in Equation (10) are also shown.
In summary, the WBC count and the WBC 2-part differential count (lymphocyte vs. nonlymphocyte) measured from the microfluidic cytometer showed close agreement with the results from the commercial blood counter.
2.5 Conclusion
used for the WBC detection. The microfluidic device was fabricated with the soft lithography process of PDMS and a glass substrate.
Pretreatment of blood sample with fluorescent dye assay, AO (10g/ml), was used to selectively stain WBCs in whole blood. After the pretreatment, WBCs were detectable by the high fluorescence intensity introduced by the AO binding, whereas the other blood cells, RBCs and platelets, showed minimal fluorescence.
A LED-induced (central wavelength 460nm, 700mW), two-color fluorescence detection scheme was developed for the optical measurement. The measurement wavelength ranges were chosen to cover the green fluorescence (510-560nm) introduced by the AO-DNA binding, and the red fluorescence (>590nm) introduced by the AO-RNA binding. The whole system including the optical components and the supporting electronics was built into a portable-sized package (12 inch in length, 9 inch in width and 5 inch in height).
Chapter 3 : Dye Assay for WBC
Differential Count
3.1 Introduction
In the Chapter 2, the feasibility of measuring WBCs in whole blood by the sheathless microfluidic cytometer and dye-based assay (Acridine Orange) was demonstrated. Based on this method, the WBC count and a 2-part WBC differential count (lymphocyte versus nonlymphocyte) were achieved. The results of the WBC count and the 2-part differential count are already useful in specific applications. For example, the lymphocyte count in the 2-part differential provides an important bioindicator for an astronaut’s exposure to space radiation, which is needed in long-term space flight. In addition, the WBC count and the 2-part WBC differential count can be used to provide a quick screening test for discriminating viral infections against bacterial infections in physician offices.
However, a 3-part WBC differential count (lymphocyte, monocyte and neutrophil) or a more advanced 5-part WBC differential count (lymphocyte, monocyte, neutrophil, eosinophil and basophil) are more often used in clinical laboratories. Therefore, it is important to further explore the capability of using fluorescent assays and the microfluidic cytometer to deliver the 5-part WBC differential count.
3.1.1 Fluorescent Assays for WBC Differential in Flow Cytometer
Table 3.1. Comparison of the fluorescent dye assay and fluorescent-conjugated immuno-staining assay for WBC differential count.
Choice of binding specificity
Shelf life Storage Cost
Immuno-staining assay More Short temperature Low (4˚C) High Fluorescent
dye assay Limited Long Room temperature Low
3.1.2 Dye Assay for WBC Differential
The use of dyes in the study of WBCs started since the early work of Ehrlich in 1879, and some of the dye staining methods such as the Wright’s stain and the Wright-Giemsa are still widely used in manual hematology analysis for WBC differential [90]. For automated WBC analysis, Hallermann et al. started using fluorescent dye assays in conventional flow cytometer in early 1960s [16]. In the early 1970s, researchers from Bio/Physics Systems demonstrated a 3-part WBC differential with fluorescent dye Acridine Orange [16]. Later other dyes were also suggested for WBC differential, such as Oxazine dyes[91], Basic Orange 21[92] and a Polymethine dye [93]. Shapiro et al. [94] developed an assay consisting of a three dye combination (Ethidium Bromide, Brilliant Sulfaflavine and a Stilbene Disulfonic Acid derivative), which could perform a WBC 5-part differential by using simultaneous measurements of fluorescence and light scattering. However, the detection setting (four excitation sources and six detection channels) was complicated and not optimal for portable implementations. Above all, the development of a fluorescent dye assay which not only delivers the WBC differential count but also is optimal for portable settings is still in need.
3.1.3 Fluorescent Dye Assays for Microfluidic Cytometer
[a] [b] [c]
Figure 3.1. The molecule structures of the (a) Propidium Iodide (PI), (b) Fluorescein Isothiocyanate (FITC) and (c) Basic Orange 21 (BO21).
These dye candidates were chosen for their selective binding affinity toward different types of WBCs. PI is a cationic dye, which binds with high affinity to nucleic acid contents (e.g., DNA) in the WBCs. The fluorescent staining of the nucleus, as discussed in Chapter 2, can be used to detect WBCs in the whole blood sample. In addition, PI has relatively higher binding affinity to monocyte than other WBCs [95]. The difference in binding affinity was contributed to specific chromatin structure in the monocytes versus other WBCs.
The third dye, BO21, is a cationic dye, which binds with high affinity to nucleic acids when used alone. However, as shown later in this chapter, BO21 helped to improve the differential between lymphocyte and monocyte cells when used together with PI. The fluorescence emission peak wavelength of BO21 is 525nm (orthochromatic emission), which is very close to and measured together with the emission peak of FITC (520nm).
After staining blood samples with the proposed assays, the fluorescence emissions of individual WBC were detected on the microfluidic cytometer. As the fluorescence emissions were introduced by the binding of dyes to cellular contents (e.g., nucleic acid, proteins, etc.), the measured fluorescence intensities provided a quantitative evaluation of the amount of the cellular contents being stained in different cells. This information was then used to identify the WBC types.
3.2 Experiment and Materials
3.2.1 Microfluidic Device and Fluorescent Detection System
The microfluidic device used in this chapter utilized the same design and fabrication process as the one used in the Chapter 2. The fluorescence detection system, meanwhile, was upgraded from the previous prototype. The major upgrade was the replacement of the LED excitation source with a laser excitation source, which increa