Micro porous layer (MPL)-based anode for microbial
fuel cells
Jiseon Youa, Carlo Santorob,c, John Greenmana,d, Chris Melhuisha, Pierangela Cristianie, Baikun Lib,c, Ioannis Ieropoulosa ,b
aBristol Robotics Laboratory, University of the West of England, Bristol, BS16 1QY (UK) bDepartment of Civil and Environmental Engineering, University of Connecticut, Storrs, CT 06269
(USA)
cCenter for Clean Energy Engineering, University of Connecticut, Storrs, CT 06269 (USA) dSchool of Life Sciences, University of the West of England, Bristol, BS16 1QY (UK)
eRSE-Ricerca sul Sistema Energetico S.p.A., Environment and Sustainable Development Department, Via Rubattino 54, 20134 Milan (Italy)
*Corresponding author: Tel.: +44 117 32 86318, 86322; Fax: +44 117 32 83960 E-mail address: [email protected] (I. Ieropoulos)
Bristol Robotics Laboratory, T-Building, Frenchay Campus, Bristol, BS16 1QY, UK
HIGHLIGHTS
• MPL modified anodes outperformed unmodified anodes in terms of power and stability. • Urine was successfully used as the fuel for electricity generation.
• Microbial growth rates were higher when MPL was used as the anode material. • PTFE loadings need to be optimized for better anode performance.
Abstract – Two different anode materials, carbon veil (CV) and carbon cloth (CC), were modified with a micro-porous layer (MPL) in microbial fuel cells (MFCs). When the biofilm on the anodes was mature, the maximum power output of MPL modified carbon veil (CV20-MPL) and carbon cloth (CC-MPL) was 304.3 µW (60.7 mW/m2) and 253.9 µW (50.6 mW/m2). This was 2.2 and 1.8 times higher than unmodified
CV and CC, respectively. The 7-month operational tests indicated that the long term stability of the MFCs was enhanced with the modified MPL anodes, which increased the anode surface roughness and provided higher surface area. Higher bacterial population was observed in the MFCs with the MPL anodes, which confirms the power generation results. This is the first time that the MPL has been used as efficient anode material in MFCs.
1
2
3 4 5
7 8
9 10
11 12 13
14 15
16
17 18
19 20 21
22 23
24
25
26
27 28 29
30 31
32 33
Keywords: microbial fuel cells (MFCs), anode modification, micro-porous layer (MPL), energy from waste, urine
I.
I
NTRODUCTIONDespite the universal efforts for improvements in the global energy issue, all of the currently available renewable energy sources (wind, hydro-, photovoltaic and biomass) have their limitations; it thus becomes clear that more technological innovations through research need to be achieved. In this respect, energy from organic waste can be a very attractive option. The useable form of energy from waste can include electricity, gas as well as heat and the most common method of implementation, is incineration of waste. For the last few decades, the system efficiency and unwanted gas emissions have been considerably improved, however this only has value when the waste is sufficiently dry; energy cannot be gained without additional energy input if the water content of waste is above 30 % [1]. Thus different approaches are required for recovering energy from ‘wet waste’ such as wastewater.
With this respect, microbial fuel cells (MFCs) that generate electricity by the break-down of organic matter (e.g. wastewater) have a great potential for future energy and environmental challenges. MFCs have numerous merits; firstly electricity is generated directly from organic matter, which results in a high efficiency of energy conversion. Secondly, MFCs can operate at ambient temperature conditions or even below 20 °C, and at low substrate concentration levels [2]–[4]. In terms of substrate variety, more recently, urine has been shown to be directly utilised for electricity generation, with promising results [5], [6]. Although the organic carbon is low in urine compared to other organic substrates [6], it seems to be performing better in terms of power output [7]. This requires further investigation. Although the MFC technology has achieved remarkable improvements in terms of power output over the last two decades, practical applications of the MFC technology, at larger scales, have yet to be implemented due to the low levels of power generation and relatively high costs.
Anode materials play an important role in the performance of MFCs by affecting the performance and cost of MFCs significantly. Carbon based materials such as carbon cloth [8], carbon fibre [9], [10], graphite felt [11], [12] and carbon paper [13] are the most common materials in MFCs due to their inertness toward bacteria and relatively low cost. Besides using these, diverse modifications have been made in order to enhance the anode performance. This includes ammonia treatment of anode surface [14], [15], acid treatment [16], [17] and adding nano-structured materials [18]–[20]. In general, a suitable MFC anode material requires large surface area for bacterial attachment and high electrical conductivity for the charge transfer, as well as good current collection capability. Since the anodes become biotic, they should be non-toxic to microorganisms, as well as inert to biochemical reactions, in order to prevent or minimise fouling; thus the structure of anodes needs to be carefully chosen. Also they should be robust for long-35
36 37 38
39
40
41 42
43 44 45
46 47
48 49
50 51 52
53 54
55 56
57 58 59
60 61
62 63
64 65 66
67 68
term operation and economical, in terms of cost of production.
Micro-porous layer (MPL) have been widely used as cathodes of hydrogen fuel cells [21]–[23] and more recently, microbial fuel cells [8], [24]. In a cathode, MPL is usually placed between the gas diffusion layer (GDL) and the catalyst layer (CL). The function of MPL in this structure is to provide sufficient porosity and hydrophobicity to allow a better transport of oxygen and water, as well as reduce the electrical contact resistance between the GDL and the adjacent CL. Hydrophobicity is not normally considered appropriate for anodes of MFCs but high porosity with good electrical conductivity are in fact desired properties in anodic materials. Therefore a hypothesis was formulated that the MPL could also work for MFC anodes.
In this study, carbon fibre veil (CV) and carbon cloth (CC) electrodes were modified with carbon powder, in order to introduce a micro-porous layer (MPL) of improved surface area and conductivity. The main objectives of the study were to test electrode modification with MPL, in order to evaluate its performance as an anode and investigate the feasibility of using MPL modified anodes in terms of power production, surface morphology, biocompatibility, electrical conductivity, long term stability and produc-tion cost.
II.
M
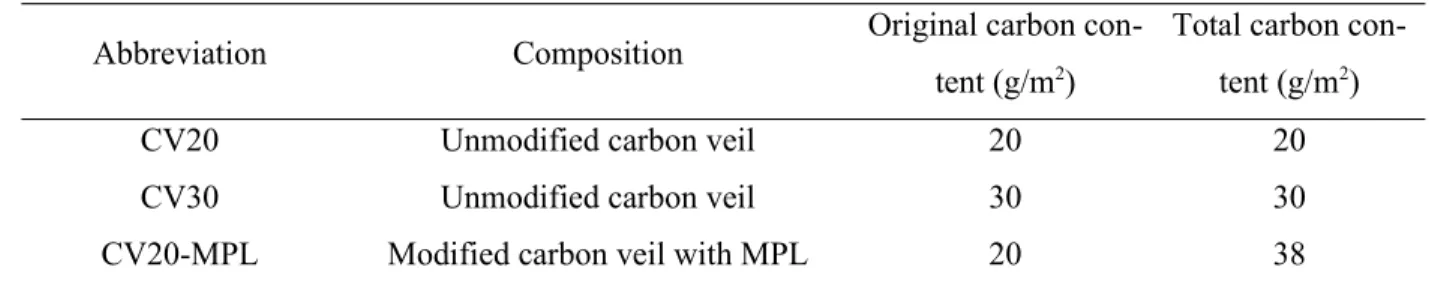
ATERIALSANDMETHODS A. Anode PreparationThree different carbon fibre veil (CV) electrodes and two carbon cloth (CC) electrodes were tested in triplicates in this study. Plain carbon fibre veil electrodes (PRF Composite Materials Poole, Dorset, UK) with different amounts of carbon loading (20 g/m2 and 30 g/m2) and untreated (non-wet proofed) carbon cloth (FuelCellEarth, Massachusetts, USA) were compared, under identical conditions. The MPL was a mixture of carbon black (Vulcan XC-72, main component) and PTFE (60 % emulsion, Sigma-Aldrich, binder) and the preparation of this MPL material has been previously described [25]. The additional carbon loading from the MPL modification was approximately 18 g/m2. The five types of anode electrodes (three unmodified and two modified) were made of 12 layers of 4.18 cm2 (width: 2.2 cm, length: 1.9 cm) of electrode material, resulting in a total macro-surface area of 50.16 cm2. Details of each electrode are presented in Table 1.
Table 1 Details of experimental conditions employed in the study
Abbreviation Composition Original carbon
con-tent (g/m2)
Total carbon con-tent (g/m2)
CV20 Unmodified carbon veil 20 20
CV30 Unmodified carbon veil 30 30
CV20-MPL Modified carbon veil with MPL 20 38
70 71
72 73
74 75
76 77 78
79 80
81 82
83 84 85
86 87 88 89
90 91
92 93
94 95 96
97 98
CC Unmodified carbon cloth 115 115
CC-MPL Modified carbon cloth with MPL 115 133
B. MFC Design and Operation
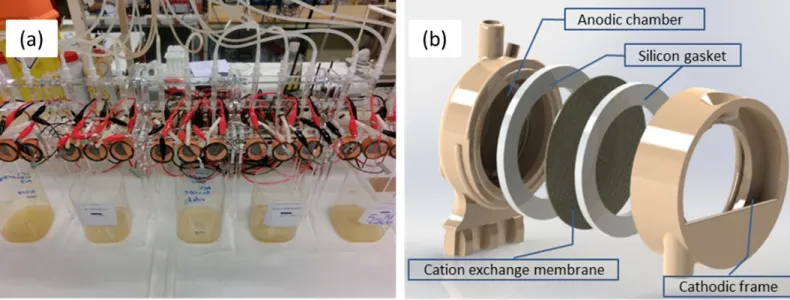
The MFCs consisted of 6.25 mL anode chambers and open-to-air cathodes. The anode compartments had inlets and outlets (d=4 mm) on the bottom and the top, respectively for continuous feeding (Figure 1a). A cation exchange membrane (CMI-7000, Membrane International), 25 mm diameter, was sandwiched between the anode and cathode frames. The cathode electrodes, which were identical for all 15 MFCs, were made of hot-pressed activated carbon onto untreated carbon cloth and had a total macro surface area of 4.9 cm2. Titanium (0.45 mm thickness) wire was used for connection and current collection (Figure 1b).
Activated sewage sludge supplied from the Wessex Water Scientific Laboratory (Saltford, UK) was used as the inoculum. Sludge was mixed with 0.1 M acetate prior to use, resulting in an initial pH level of 7.2; the same mixture was used as the initial feedstock. Following the inoculation of the MFCs and the maturing of the biofilm communities on the anodes for a week, untreated human urine was used as the sole energy source. Urine was donated from male and female healthy individuals, on a normal diet and without any medical conditions, and was pooled together prior to use. Continuous flow of the anolyte was maintained using a 16-channel peristaltic pump (205U, Watson Marlow, Falmouth, UK) with a flow rate of 11.5 mL/h. For maximising power output in the temporal long term, different external resistance values, which matched the internal resistance values of MFCs for the different anode materials, were applied throughout the work. Power output of the MFCs was monitored in real time in volts (V) against time using an ADC-24 Channel Data Logger (Pico Technology ltd., Cambridgeshire, UK). Each experimental condition was tested in triplicate and all experiments were carried out in a temperature controlled laboratory, with 22 ± 2 °C.
100
101
102
103
104 105
106 107
108 109 110
111 112
113 114 115
116 117
118 119
120 121
Figure 1. (a) MFC experimental set-up; (b) 3D CAD assembly of the single chamber MFC
C. Analysis
Scanning electron microscopy (SEM)
Scanning electron microscopy (model name-XL30, Philips) was used to examine the shapes and structures of the unmodified/modified anode material surfaces. Samples of 0.5 cm2 area of each material were cut and fixed on aluminium mounts using contact adhesive. Samples were prepared for microscopy by sputter coating in gold using an Emscope SC500 sputter coating unit, prior to microscopy and observation.
Direct cell counting
For the hemocytometric cell number measurements, 0.1 mm deep Neubauer-improved hemocytometers were used (Marienfeld-superior, Germany). The two independent consecutive measurements were performed using the two different sides of each hemocytometer. The raw effluent was diluted 10-20 times with phosphate buffered saline. The bacterial cell population was determined by counting individual cells using a grid-field.
Four-wire resistance measurement
In order to measure electrical conductivity of the tested anode materials, 4-wire resistance measurement was carried out with a digital multimeter (M-3850D, METEX, Korea) and bench power supply (PSM-3004, GW INSTEK, Taiwan). A small piece of each material (15 mm x 15 mm) was placed between two clamps. Voltage drop between the two points was measured when constant current was supplied to the material from the power supply. This method is considered more accurate than the 2-wire method for low resistance measurements since it reduces the effect of test lead resistance.
Principal component analysis (PCA) 124
125
126 127
128
129 130
131 132 133
134 135
136 137
138 139 140
141 142
143 144
PCA was used in order to process large sets of data and find distinctive patterns. PCA is a statistical tool that simplifies the visualisation of the variables accountable for relations among the different samples by generating uncorrelated components named as principal components. The two principal components, orthogonal one to the other, represent the largest possible variance (PC-1) and the largest possible inertia (PC-2) respectively [26]. In the current study, power (density, absolute, specific, initial, middle and final), resistivity and material cost were used as variables in the PCA matrix. Auto-scaling PCA (PLS_Toolbox 3.54 in Matlab, Eigenvector Research Inc., USA) was applied to this dataset.
D. Polarisation Measurement and Power Output Calculations
Polarisation experiments were performed periodically by connecting a DR07 decade variable resistor box (ELC, France), between the anode and cathode electrodes. Polarisation data were generated by varying the external resistance from 30 kΩ to 10 Ω at time intervals of 5 minutes after the MFCs had established a steady-state open circuit voltage.
The current (I) in amperes (A) was determined using Ohm’s law, I = V/R, where V is the measured voltage in volts (V) and R is the known value of the external resistor expressed in ohms (Ω). Power (P) in watts (W) was calculated by multiplying voltage with current; P = I x V. Power density (PD) was calculated according to the electrode total macro surface area; PD = P/α, where α is the total electrode macro surface area in square metres (m2). Internal resistance was calculated from Kirchoff’s voltage law: RINT = (VO/C/IL) – RL, where VO/C is the open-circuit of the MFC, IL is the current under a load and RL is the value of the load resistor. The value of RINT was also validated from the V/I curves of the polarisation experiments.
III.
R
ESULTSANDDISCUSSIONA. Performance of the MPL modified anodes
148 149
150 151
152 153
154 155
156
157
158 159
160 161
162 163 164
165 166
167 168 169
170
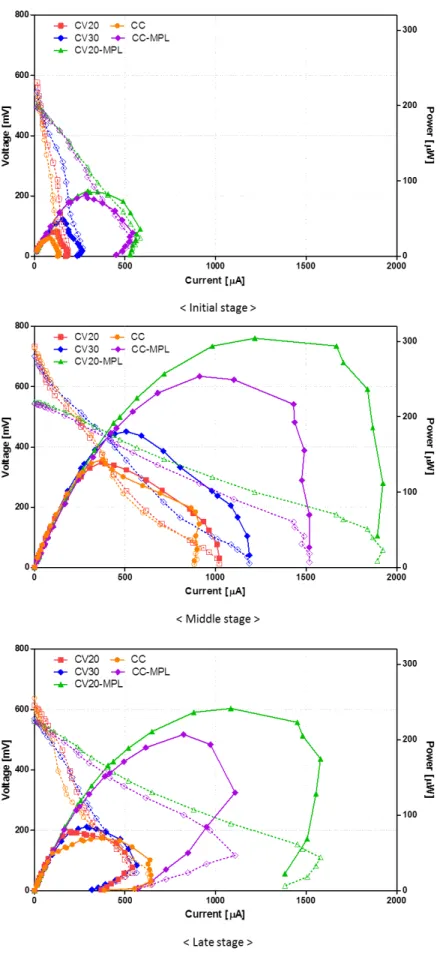
Figure 2. Power curves of different anode materials 173
The MPL modification improved the MFC performance significantly when compared with the unmodified anode materials as shown in Fig 2. From the beginning, the MPL modified anodes showed higher power performance than the plain ones, which was consistent throughout the entire work. During the middle stage, when the biofilm on the anodes was considered to be mature, the MFCs performed their best. The best performing anode material, CV20-MPL, produced a maximum power of 304.3 µW (60.7 mW/m2 normalised to the anode total macro surface area, mean value 290 µW ± 13), which was 1.2 fold higher than the second best performing anode material, CC-MPL with a maximum power of 253.9 µW (50.6 mW/m2, mean value 249 µW ± 8). The maximum power produced by unmodified electrodes, CV20, CV30 and CC, was 140.0 µW (27.9 mW/m2, mean value 130 µW ± 10), 180.7 µW (36.0 mW/m2, mean value 171 µW ± 10) and 143.4 µW (28.6 mW/m2, mean value 137 µW ± 6) respectively. This demonstrates that the MPL modification can result in significant anode improvements.
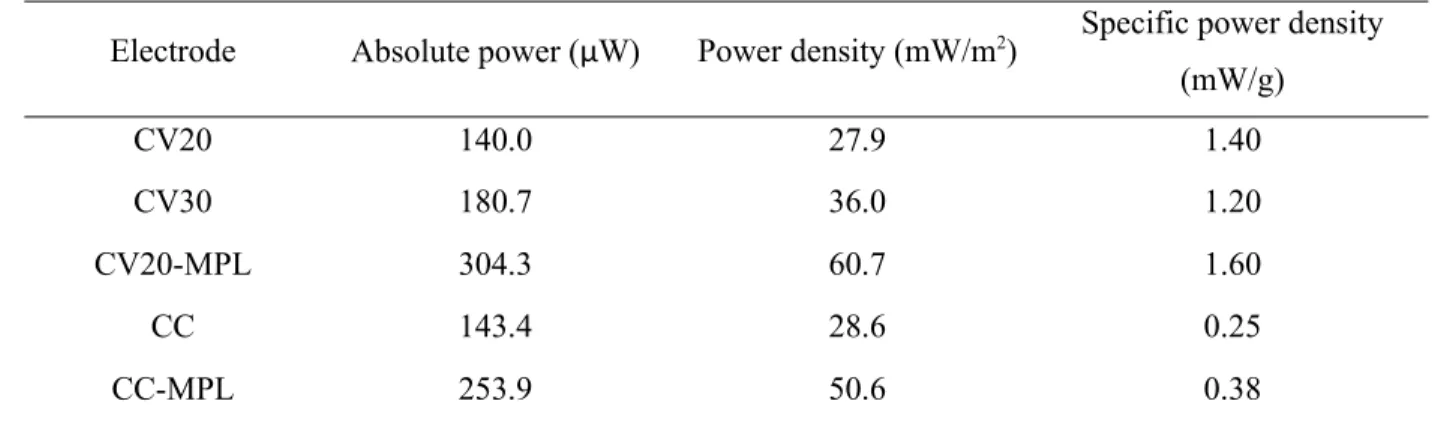
The resulting 2.2 and 1.8 fold higher power was achieved by modifying the plain CV with 20 g/m2 of carbon loading and CC carbon materials, which is also supported by the improved performance from the manufacturer higher-loading carbon (30 g/m2), compared to the unmodified electrodes. It is therefore valid to assume that the higher carbon content from the MPL modification contributed – to a degree – to the higher power generation of MFCs. Although this was expected, it could not have been the only reason for the improved anode performance. The maximum power output of each anode material during the middle stage was compared (Table 2). For the specific power density, presented as the power output per 1 g of anode carbon, the same amount of carbon did not result in the same level of increase in the output, especially for the CC based materials, where specific power density was far lower than the CV based materials.
Table 2 Maximum power output of MFCs during the middle stage with different anode materials
Electrode Absolute power (µW) Power density (mW/m2) Specific power density (mW/g)
CV20 140.0 27.9 1.40
CV30 180.7 36.0 1.20
CV20-MPL 304.3 60.7 1.60
CC 143.4 28.6 0.25
CC-MPL 253.9 50.6 0.38
B. Surface morphology
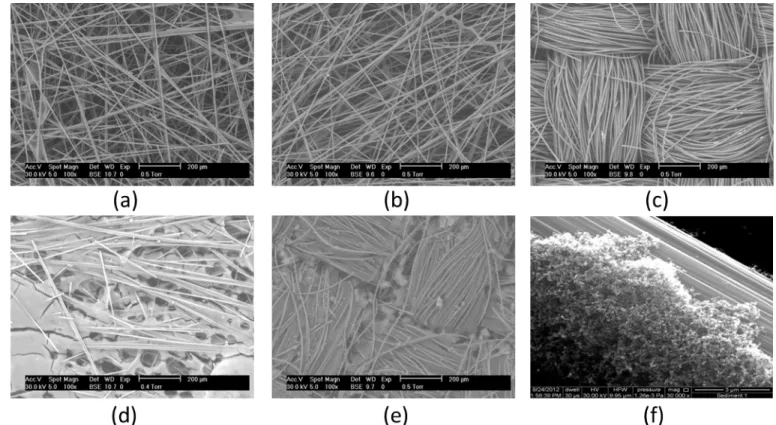
Another possible explanation for the performance enhancement with MPL modification may be its surface characteristics. The SEM images of the clean CV and CC anodes (Figures 3a-3c) showed that the 175
176
177 178
179 180
181 182 183
184 185
186 187
188 189 190
191 192
193 194
195 196 197
198
199
200
MPL covered the anode surface as well as the gaps between carbon fibres (Fig. 3d and 3e). With higher magnification, the MPL surface seems uneven and more porous, which could result in better and higher surface area for bacterial attachment (Fig. 3f).
Figure 3. SEM images of anode electrodes; (a) CV20; (b) CV30; (c) CC; (d) CV20-MPL; (e) CC-MPL; (f) MPL structure on CC-MPL
The SEM images could explain why CC based materials did not perform as well as CV based materials even though they had higher carbon content. Carbon fibres of the CC were densely woven (Fig. 3c), so that even though bacteria could penetrate deep into the strata, fuel supply from percolation, would have been uneven at those inner layers, which is not the case for the less dense CV. Uneven and decreasing concentrations of fuel, would have inevitably resulted in an eroding inner CC biofilm core.
C. Biocompatibility
203 204
205 206
207 208 209
210 211
212 213
214 215 216
217
Figure 4. Bacterial production rate from the effluent of MFCs with different anode materials. Inset shows the regression analysis of the data with 95 % CI.
In order to address whether the increased anode surface through MPL modification was beneficial for the growth of anodophilic bacteria, the bacterial production rate from the effluent of all MFCs was measured over a 2-month operational period, which allowed MFCs to run in various conditions.
With the direct cell counting method, all the suspended cells in the anolyte, both living and dead, were non-selectively counted (including non electro-active species). Nevertheless, a relationship between bacterial cell production and power output could be drawn from the results shown in Fig. 4. Although the relation between the two was not directly proportional, higher bacterial populations tended to contribute to higher power output. Therefore a conclusion could be drawn that higher surface area of the anodes, through MPL modification, had positive influence on bacterial growth on the anodes, increasing the anodic load of attached cells from which daughter cells are derived or by the attached layers growing at a higher growth rate, and thereby producing higher numbers of shed daughter cells in the perfusate.
The relationship between bacterial cell production rate and power output might indicate that the portion of non-anodophiles constituting the whole microcosm population was larger in the MFCs with modified anodes due to the change brought about by the anode modification. In this case, it may be assumed that 219
220 221
222 223
224 225 226
227 228
229 230
231 232 233
234 235
MPL modification is selective to anodophiles. In-depth bacterial analysis would need to be carried out to investigate this.
Cathodic MPL modification is traditionally performed with PTFE (polytetrafluoroethylene), which is used for making the layer hydrophobic as well as binding carbon powder and current collection (e.g. CV or CC). This hydrophobic characteristic appeared in the modified anodes. When MPL modification was completed, the water-uptake element of the MPL modified anodes was low. However this did not seem to have a significant negative effect on bacterial growth, at least over the long term. The mixed number of attachment points with different surface hydrophilic/hydrophobic properties (carbon or PTFE) may result in greater diversity of surfaces and therefore greater diversity of types of bacteria that can attach. Actually, bacteria can colonise pure PTFE surfaces, which is problematic in protecting medical equipment from bacterial contamination [27], [28], and the results derived from bacterial population counting is consistent with this. It showed that the MPL modified anodes (with PTFE) were biocompatible.
D. Electrical conductivity
Another possible downside predicted for using PFTE in anodic materials, was the decrease in the anodic electrical conductivity. According to the manufacturer of PFTE, volume resistivity of PTFE at 20
°C is more than 1018 Ω·m [29]. Thus PTFE could work as an insulator in the modified materials due to its high resistivity.
Electrical conductivity of anodes is an essential feature since it greatly affects ohmic losses in MFC systems. Electrical conductivity is the reciprocal of electrical resistivity, and thus measuring the anode resistivity also represents its conductivity. Electrical resistivity (volume resistivity) of each anode material was measured at room temperature (22 ± 2 °C) (Fig. 5).
237 238
239 240
241 242
243 244 245
246 247
248 249 250 251
252 253
254
255 256
257 258
Figure 5. Electrical resistivity of each anode material
Although all the tested anode materials consisted of the same carbon base, the resistivity varied due to the particle size, aggregate structure and porosity [30]. As a result, electrical resistivity slightly increased both in CV and CC through the MPL modification, which might be the result of the PTFE addition. In this particular case, and even though the differences in resistivity were small, it is clear that the PTFE loading was counteracting the increase in surface area, achieved from the MPL modification. Since micro-structure and characteristics of MPL changes with different PTFE loadings [31], [32], the amount of PTFE needs to be carefully selected for an optimum modification.
It should be noted that resistivity is an intrinsic property, unlike resistance. Resistance of the anodes used in the test could vary based on their shape and size. In this study, the same macro surface size was used for all materials but the volume of anodes was different, due to different thickness of anode material.
E. Long term operation
Durability is critical for long-term MFC operation. The MPL modified anodes were operated for 7 months to investigate the long-term stability. Good MFC anodes are expected to have a low level of fouling, however meeting this requirement is not trivial since a high void volume consisting of fine spaces 261
262
263 264
265 266 267
268 269
270 271
272 273
274
275
276 277
for sustaining the microbial growth and multiplication, is essential. In an ideal continuous-fed system with the optimum flow rate, this could be avoided or minimised since clogging is a result of slow flow and poor hydrodynamic control. Even though the MFC systems were under continuous flow conditions, anode chamber clogging – due to urine precipitation – was observed, which would have been accompanied by membrane ageing. During the 7-month operational period, MFCs were opened 3 times, in order to clear the precipitation that was accumulating on the membranes and anode chambers. There might have also been an element of an accumulating biofilm on the anode electrodes, but this is a parameter that will be more closely monitored in the next stages of this study. After cleaning the MFCs, performance of all units dropped but then quickly recovered to their previous performance levels.
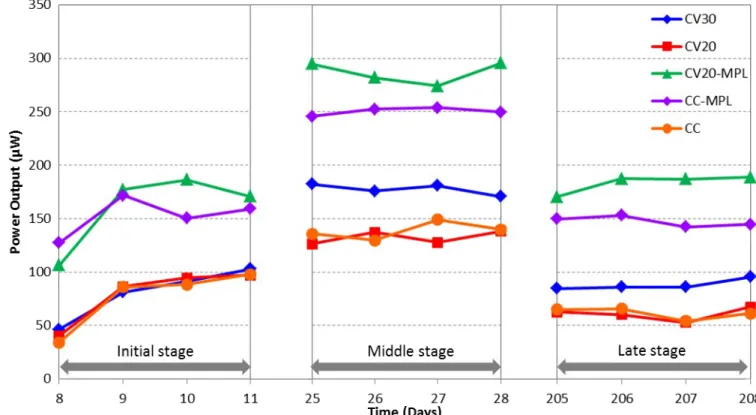
Figure 6 shows the power generating performance profile of tested anode materials in different stages of the experiment operation period. All MFCs showed a similar pattern: performance increased in the early stages and then decreased in the later stages. In the 2nd week, power output increased gradually as MFC anodes were matured. After 1 month (referred to as middle stage), the power output of all MFCs improved significantly, which implied that biofilms on the anodes were fully established. After nearly 7 months, power output declined. However, the extent of performance decline differed for each anode material. Over 50 % of the decline in performance occurred in unmodified CV30, CV20 and CC (50.4 ± 6 %, 54.1 ± 3 %, and 55.6 ± 1 %, respectively), whereas only 36.0 ± 5 % (CV20-MPL) and 41.2 ± 4 % (CC-MPL) of performance reduced in the MPL modified anodes. Their power performance change can also be found in the polarisation curves (Fig. 2). In the case of maximum power output, only 20.7 % and 18.5 % decreased in CV20-MPL and CC-MPL respectively, whilst 53.2 %, 43.9 % and 51.5 % reduction was recorded for CV30, CV20 and CC between the middle stage and late stage. Therefore, this result indicated that MPL modification improves anode durability for long term operation.
279 280
281 282
283 284
285 286 287
288 289
290 291
292 293 294
295 296
297 298
Figure 6. Power production from MFCs with different anode materials in different stages of the work; temporal profile
Another factor to consider when to select anode materials for a MFC system is substrate. Urine which was used as a substrate in this work tends to form precipitation naturally. If a defined substrate with less insoluble matters is used, a different size of anode cavities or surface morphology may be more desirable.
F. Economic evaluation
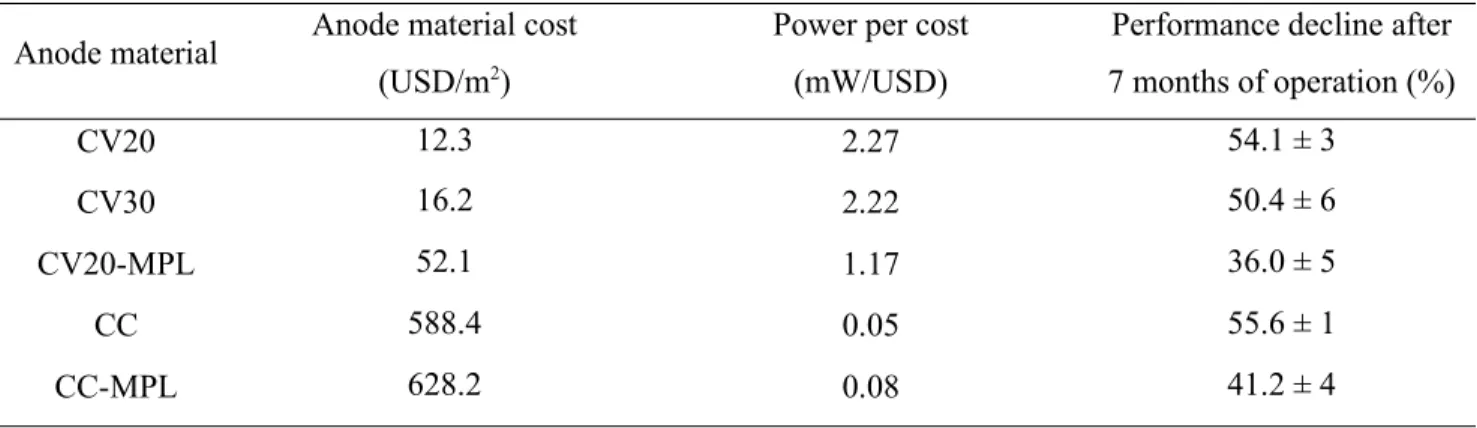
So far the MPL modified anodes were compared with the unmodified anodes in terms of power production, surface morphology, biocompatibility, electrical conductivity and long-term durability. The economical aspect should not be overlooked even though the majority of MFC research is still at laboratory level. When economical aspect is considered for a MFC system, various elements need to be taken into account. The costs of the anode materials tested were compared (Table 3), with respect to the material cost only, and cost for fabrication of the MPL modification was not included. The modification of 1 m2 of anode materials, required approximately 40USD. This additional cost gave 220 % and 180 % of performance improvement than unmodified CV and CC anodes, respectively and also enhanced the stability of the MFC systems. This cost could be reduced significantly for mass production. Although it is too early to justify that MPL modification is affordable or competitive in terms of cost, this consideration is important.
302 303
304 305 306 307
308 309 310
311
312 313
314 315
316 317 318
319 320
Table 3 Anode material cost spent in this study and other factors to consider
Anode material Anode material cost (USD/m2)
Power per cost (mW/USD)
Performance decline after 7 months of operation (%)
CV20 12.3 2.27 54.1 ± 3
CV30 16.2 2.22 50.4 ± 6
CV20-MPL 52.1 1.17 36.0 ± 5
CC 588.4 0.05 55.6 ± 1
CC-MPL 628.2 0.08 41.2 ± 4
Although many researchers studying fuel cells including hydrogen based fuel cells claim environmental friendly aspect of the technology, sustainability in manufacturing, operating, and discarding of fuel cell systems is often forgotten. Especially for the MFC technology, which is believed to have green energy merits for the future, this aspect is very important. Although a direct comparison of MPL modified anodes to other anode materials is difficult in terms of environmental impact, it is reasonable to guess that the extent of pollution did not increase much by the modification since no toxic chemical or heavy metal was used.
G. Principle component analysis (PCA) and general analysis
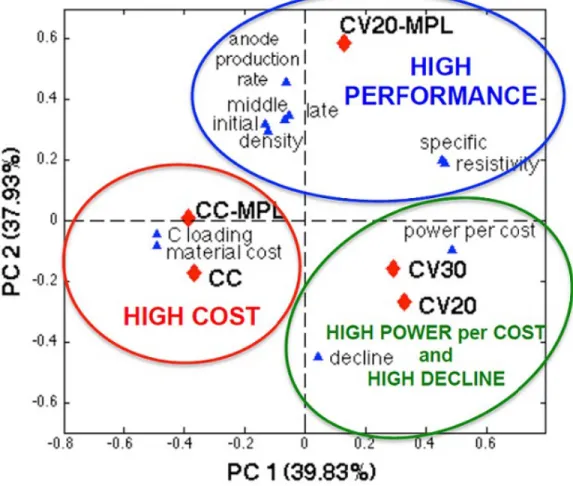
All the data obtained were used as input in PCA analysis. Power (density, absolute, specific, initial, middle, final and per unit cost), resistivity, carbon loading, anode production rate and material cost for all the samples (CV20, CV30, CV20-MPL, CC and CC-MPL) were used as variables in the PCA matrix (Figure 7). Three different zones in the PCA can be identified: i) CV20-MPL showed the best performances (initial, middle, final, specific and density) and highest anode production rate; ii) CC and CC MPL showed the highest material cost, highest conductivity (inversely proportional to the resistivity) and carbon loading; iii) CV20 and CV30 showed the best power per unit cost but also higher decline in long term operation. CV generally had a lower cost so it seems to be an appropriate candidate as anode material. CC (with and without MPL) were not suitable for anode in MFC mainly due to their high cost and also poor durability despite their best conductivity properties. The MPL addition on the CV increases the cost of production slightly, however showed the highest power output and material durability. Therefore it was concluded that CV20-MPL was the best anode material among the five different materials tested in this study.
323
324
325 326 327
328 329
330 331
332
333
334 335
336 337
338 339
340 341 342
343 344
Figure 7. Principal components analysis biplot for the different anodes investigated
IV.
C
ONCLUSIONSCarbon based anode materials (CV and CC) were modified with MPL and their performance was evaluated as MFC anodes. The results showed that MPL modification of anodes increased power performance, bacterial production rate of anode and MFC stability. Since PTFE caused higher resistivity and hydrophobicity, optimisation of its use in terms of concentration or heating temperature during the MPL making process, or finding an alternative binder that could replace PTFE, need to be further investigated. The evaluation of feasibility indicated that MPL modification for anode is desirable. This was the first study that the MPL was used as a good anode electrode in MFCs.
A
CKNOWLEDGMENTThe authors would like to thank the Engineering and Physical Sciences Research Council (EPSRC) UK, for the financial support of this work through the project with grant numbers EP/I004653/1 and EP/ L002132/1. Parts of the urine study are funded by the Bill & Melinda Gates Foundation grant no. OPP1094890.
348 349 350
351
352 353
354 355
356 357 358
359
360
361
R
EFERENCES[1] P. L. McCarty, J. Bae, and J. Kim, “Domestic wastewater treatment as a net energy producer--can this be achieved?,” Environ. Sci. Technol., vol. 45, no. 17, pp. 7100–6, Sep. 2011.
[2] A. Larrosa-Guerrero, K. Scott, I. M. Head, F. Mateo, A. Ginesta, and C. Godinez, “Effect of temperature on the performance of microbial fuel cells,” Fuel, vol. 89, no. 12, pp. 3985–94, Dec. 2010.
[3] L. Zhang, J. Shen, L. Wang, L. Ding, K. Xu, and H. Ren, “Stable operation of microbial fuel cells at low temperatures (5-10 °C) with light exposure and its anodic microbial analysis,” Bioprocess Biosyst. Eng., Sep. 2013.
[4] D. Pant, G. Van Bogaert, L. Diels, and K. Vanbroekhoven, “A review of the substrates used in microbial fuel cells (MFCs) for sustainable energy production,” Bioresour. Technol., vol. 101, no. 6, pp. 1533–43, Mar. 2010.
[5] P. Kuntke, K. M. Smiech, H. Bruning, G. Zeeman, M. Saakes, T. H. J. A. Sleutels, et al., “Ammonium recovery and energy production from urine by a microbial fuel cell,” Water Res., vol. 46, no. 8, pp. 2627–36, May 2012.
[6] I. Ieropoulos, J. Greenman, and C. Melhuish, “Urine utilisation by microbial fuel cells; energy fuel for the future,” Phys. Chem. Chem. Phys., vol. 14, no. 1, pp. 94–8, Jan. 2012.
[7] I. Ieropoulos, I. Gajda, J. You, and J. Greenman, “Urine—Waste or Resource? The Economic and Social Aspects,” Rev. Adv. Sci. Eng., vol. 2, no. 3, pp. 192–9, Sep. 2013.
[8] C. Santoro, A. Agrios, U. Pasaogullari, and B. Li, “Effects of gas diffusion layer (GDL) and micro porous layer (MPL) on cathode performance in microbial fuel cells (MFCs),” Int. J. Hydrogen Energy, vol. 36, no. 20, pp. 13096–104, Oct. 2011.
[9] I. Ieropoulos, J. Greenman, and C. Melhuish, “Improved energy output levels from small-scale Microbial Fuel Cells,” Bioelectrochemistry, vol. 78, no. 1, pp. 44–50, May 2010.
[10] J. Winfield, I. Ieropoulos, J. Greenman, and J. Dennis, “The overshoot phenomenon as a function of internal resistance in microbial fuel cells,” Bioelectrochemistry, vol. 81, no. 1, pp. 22–7, May 2011.
[11] J. C. Biffinger, R. Ray, B. Little, and B. R. Ringeisen, “Diversifying Biological Fuel Cell Designs by Use of Nanoporous Filters,” Environ. Sci. Technol., vol. 41, no. 4, pp. 1444–9, Feb. 2007.
[12] P. Aelterman, M. Versichele, M. Marzorati, N. Boon, and W. Verstraete, “Loading rate and external resistance control the electricity generation of microbial fuel cells with different three-dimensional anodes,” Bioresour. Technol., vol. 99, no. 18, pp. 8895–902, Dec. 2008.
[13] C. Santoro, M. Guilizzoni, J. P. Correa Baena, U. Pasaogullari, A. Casalegno, B. Li, et al., “The effects of carbon electrode surface properties on bacteria attachment and start up time of microbial fuel cells,” Carbon N. Y., vol. 67, pp. 128–39, Feb. 2014.
[14] S. Cheng and B. E. Logan, “Ammonia treatment of carbon cloth anodes to enhance power generation of microbial fuel cells,” Electrochem. commun., vol. 9, no. 3, pp. 492–6, Mar. 2007.
[15] S. B. Velasquez-Orta, T. P. Curtis, and B. E. Logan, “Energy from algae using microbial fuel cells,” Biotechnol. Bioeng., vol. 103, no. 6, pp. 1068–76, Aug. 2009.
[16] K. Scott, G. A. Rimbu, K. P. Katuri, K. K. Prasad, and I. M. Head, “Application of Modified Carbon Anodes in Microbial Fuel Cells,” Process Saf. Environ. Prot., vol. 85, no. 5, pp. 481–8, Jan. 2007.
[17] Y. Feng, Q. Yang, X. Wang, and B. E. Logan, “Treatment of carbon fiber brush anodes for improving power generation in air–cathode microbial fuel cells,” J. Power Sources, vol. 195, no. 7, pp. 1841–4, Apr. 2010.
[18] J.-J. Sun, H.-Z. Zhao, Q.-Z. Yang, J. Song, and A. Xue, “A novel layer-by-layer self-assembled carbon nanotube-based anode: Preparation, characterization, and application in microbial fuel cell,” Electrochim. Acta, vol. 55, no. 9, pp. 3041–7, Mar. 2010.
[19] Y. Fan, S. Xu, R. Schaller, J. Jiao, F. Chaplen, and H. Liu, “Nanoparticle decorated anodes for enhanced current generation in microbial electrochemical cells,” Biosens. Bioelectron., vol. 26, no. 5, pp. 1908–12, Jan. 2011.
[20] L. Xiao, J. Damien, J. Luo, H. D. Jang, J. Huang, and Z. He, “Crumpled graphene particles for microbial fuel cell electrodes,” J. Power Sources, vol. 208, pp. 187–92, Jun. 2012.
[21] A. Z. Weber and J. Newman, “Effects of Microporous Layers in Polymer Electrolyte Fuel Cells,”
J. Electrochem. Soc., vol. 152, no. 4, p. A677, Apr. 2005.
[22] X. L. Wang, H. M. Zhang, J. L. Zhang, H. F. Xu, Z. Q. Tian, J. Chen, et al,, “Micro-porous layer with composite carbon black for PEM fuel cells,” Electrochim. Acta, vol. 51, no. 23, pp. 4909–15, Jun. 2006.
[23] K. T. Cho and M. M. Mench, “Investigation of the role of the micro-porous layer in polymer electrolyte fuel cells with hydrogen deuterium contrast neutron radiography,” Phys. Chem. Chem. Phys., vol. 14, no. 12, pp. 4296–302, Mar. 2012.
[24] G. Papaharalabos, J. Greenman, C. Melhuish, C. Santoro, P. Cristiani, B. Li, et al., “Increased power output from micro porous layer (MPL) cathode microbial fuel cells (MFC),” Int. J. Hydrogen Energy, vol. 38, no. 26, pp. 11552–8, Aug. 2013.
[25] C. Santoro, Y. Lei, B. Li, and P. Cristiani, “Power generation from wastewater using single chamber microbial fuel cells (MFCs) with platinum-free cathodes and pre-colonized anodes,”
Biochem. Eng. J., vol. 62, pp. 8–16, Mar. 2012.
[26] H. Abdi and L. J. Williams, “Principal component analysis,” Wiley Interdiscip. Rev. Comput. Stat., vol. 2, no. 4, pp. 433–59, Jul. 2010.
[28] J. Treter and A. J. Macedo, “Catheters : a suitable surface for biofilm formation,” Sci. against Microb. Pathog. Commun. Curr. Res. Technol. Adv., pp. 835–42, 2011.
[29] “Fluoroplastic Comparison - Typical Properties.” [Online]. Available:
http://www2.dupont.com/Teflon_Industrial/en_US/tech_info/techinfo_compare.html . [Accessed: 01-Mar-2014].
[30] M. H. Polley and B. B. S. T. Boonstra, “Carbon Blacks for Highly Conductive Rubber,” Rubber Chem. Technol., vol. 30, no. 1, pp. 170–9, Mar. 1957.
[31] V. A. Paganin, E. A. Ticianelli, and E. R. Gonzalez, “Development and electrochemical studies of gas diffusion electrodes for polymer electrolyte fuel cells,” J. Appl. Electrochem., vol. 26, no. 3, Mar. 1996.
[32] L. Giorgi, E. Antolini, A. Pozio, and E. Passalacqua, “Influence of the PTFE content in the diffusion layer of low-Pt loading electrodes for polymer electrolyte fuel cells,” Electrochim. Acta, vol. 43, no. 24, pp. 3675–80, Aug. 1998.
438 439
440 441 442
443 444
445 446 447