1
Ascaris
phylogeny based on multiple whole mtDNA
1
genomes
23 4 5
Peter Nejsuma,b,*,1, Mohamed B. F. Hawashc,1, Martha Betsond, J. Russell Stotharde, Robin B. 6
Gasserf, Lee O. Anderseng 7
8
aDepartment of Clinical Medicine, Health, Aarhus University, Denmark 9
bDepartment of Veterinary Disease Biology, Faculty of Health Sciences, University of Copenhagen, 10
Denmark 11
c Department of Genetics, Centre Hospitalier Universitaire Sainte-Justine Research Center, 12
Montréal, Canada 13
c School of Veterinary Medicine, Faculty of Health and Medical Sciences, University of Surrey, 14
Guildford, United Kingdom 15
e Department of Parasitology, Liverpool School of Tropical Medicine, Liverpool, United Kingdom
16
fDepartment of Veterinary and Agricultural Sciences, University of Melbourne, Parkville, Victoria, 17
Australia 18
gDepartment of Microbiology and Infection Control, Statens Serum Institut, Copenhagen, Denmark 19
20 21 22 23 24
____________ 25
*Corresponding author. Peter Nejsum, Department of Clinical Medicine, Health, , Aarhus 26
University, Palle Juul-Jensens Boulevard 99, 8200 Aarhus N, Denmark. Phone: +45 5054 1392. E-27
mail: [email protected] 28
29
1 Joint first authors 30
2 ABSTRACT
32 33
Ascaris lumbricoides and A. suum are two parasitic nematodes infecting humans and pigs, 34
respectively. There has been considerable debate as to whether Ascaris in the two hosts should be 35
considered a single or two separate species. Previous studies identified at least three major clusters 36
(A, B and C) of human and pig Ascaris based on partial cox1 sequences. In the present study, we 37
selected major haplotypes from these different clusters to characterize their whole mitochondrial 38
genomes for phylogenetic analysis. We also undertook coalescent simulations to investigate the 39
evolutionary history of the different Ascaris haplotypes. The topology of the phylogenetic tree based 40
on complete mitochondrial genomic sequences was found to be similar to partial cox1 sequencing, 41
but the support at internal nodes was higher in the former. Coalescent simulations suggested the 42
presence of at least two divergence events: the first one occurring early in the Neolithic period which 43
resulted in a differentiated population of Ascaris in pigs (cluster C), the second occurring more 44
recently (~900 generations ago), resulting in clusters A and B which might have been spread 45
worldwide by human activities. 46
47
3 1. Introduction
49
Ascaris lumbricoides (Linnaeus, 1758) in humans and A. suum (Goeze, 1782) in pigs are prevalent 50
parasitic nematodes. About a billion people are infected, and A. suum is found among pigs globally 51
in both intensive and extensive production systems (Bethony et al., 2006; Hotez and Kamath, 2009; 52
Roepstorff et al., 2011, Nissen et al., 2011, Pullan et al., 2014). There has been ongoing debate as to 53
whether Ascaris from humans and pigs represents a single or separate species (e.g., Anderson 2001, 54
Leles et al., 2012, Søe et al., 2016). However, there is no doubt that Ascaris from the two host species 55
are genetically very closely related and that both host species can be cross infected (reviewed by 56
Nejsum et al., 2012). This may relate to a short evolutionary history of Ascaris in humans and pigs 57
as a host switch is expected to have taken place during domestication of pigs ~10,000 years ago (Cox 58
2004; Leles et al., 2010; Araujo et al., 2008; Brinkkemper and Haaster, 2012; Mitchell, 2013). 59
In order to assess the genetic relationship of Ascaris individuals from the two host species, 60
sequencing of part of the mitochondrial (mt) cox1 gene (383 bp) has been used in multiple studies 61
(e.g. Peng et al, 2005; Cavallero et al., 2013; Betson et al., 2014). In these studies, three main 62
haplotype clusters have been identified (A, B and C). Interestingly, worms from the two host species 63
are found in both cluster A and B, whereas worms from pigs (or humans known to be cross-infected 64
with pig worms) are represented in cluster C. Despite the fact that shared haplotypes between worms 65
from the two host species have been observed, most worms from either humans or pigs are found 66
together in either cluster A or B (Cavallero et al., 2013; Betson et al., 2014). It has also been noted 67
that haplotypes belonging to clusters A and B are found worldwide in both host species, but in 68
different proportions. Hence, most worms from humans and pigs in China have been found to 69
represent cluster B (Peng et al., 2005), whereas most worms in these hosts from Uganda were found 70
in cluster A (Betson et al., 2014), but with no clear geographical association. However, it is not known 71
whether the relationships inferred based on cox1 reflect that of other genes in the mt genome. In the 72
present study, we conducted whole mitochondrial genomic haplotyping of six Ascaris representing 73
five distinct cox1 haplotypes recorded in Betson et al. (2014) for a comparative evolutionary analysis. 74
In addition, coalescent simulation were performed on human and pig Ascaris population to gain 75
insights into the deep evolutionary history of the parasite. 76
77
2. Methods 78
79
2.1. Genomic DNA isolation and cox1 haplotypes 80
81
Ascaris DNA samples included in this study have previously been described (Betson et al., 2014). 82
Part of the cox1 gene (383 bp) was sequenced and three main haplotype clusters (A, B and C) were 83
defined by phylogenetic analysis (Betson et al., 2014). For the present study, we selected DNA 84
samples from Ascaris individuals representing the most common haplotypes H01, H03, H07, H28 85
and H64 for full mtDNA genome sequencing. Haplotypes H01 and H03 originated from two persons 86
from Tanzania and were identified as A. lumbricoides by microsatellite analysis (Betson et al. 2014); 87
the other samples were from pigs from Uganda (H01 and H07), Tanzania (H28) and the UK (H64) 88
and were identified as A. suum. The Uganda pig worm H01 was later identified as a cross-infection 89
(Betson et al., 2014) and therefore most likely represents A. lumbricoides. 90
91
2.2. Long-range PCR amplification of the mtDNA genomes and sequencing 92
93
The primers given in Table 1 were designed using Primer 3 (Koressaar and Remm, 2007;Untergasser 94
et al., 2012) and used to amplify the mt genomes in five overlapping fragments by long range PCR. 95
4
min, followed by 35 cycles of denaturation at 92 °C (20 sec), annealing at 55 °C for 30 sec, extension 97
at 62 °C for 5 min and a final extension at 62 °C for 10 min. The long-range PCR was conducted in 98
a 20 μl-volume using a standard buffer, 0.2 mM of each dNTP, 0.4 mM of each primer pair, 2.0 mM 99
MgCl2, and 2.5 U of the Long PCR Enzyme Mix (Thermo Scientific). PCR products were detected 100
by gel electrophoresis (0.8% agarose) using GelRed™ (Biotium) as the stain over ultraviolet light. 101
Aliquots of amplicons (5 µl) were each treated with 1 μl Exonuclease I (Fermentas) and 2 μL FastAP 102
thermosensitive alkaline phosphatase (1 U/μl) (Fermentas) at 37 °C for 15 min, and the enzymes 103
inactivated at 85 °C for 15 min. DNA concentrations were measured spectro-photometrically 104
(NanoDrop 1000, Thermo Fischer Scientific). Individual DNA libraries were constructed and 105
sequenced using Illumina HiSeq 2000 by Macrogen Inc., South Korea. 106
107
2.3. Assembly and annotation 108
109
Sequence reads (~100 bp) of each genome were assembled using the CLC Genomics Workbench 110
v6.5.1 (CLC Inc, Aarhus, Denmark). Raw data can be provided upon request. Open reading frames 111
were identified using the CLC Genomics Workbench and the BLASTx search tool embedded in the 112
program used to identify the genes. tRNAScan-SE (Schattner et al., 2005) was used to identify tRNAs 113
whereas rRNAs were identified using the BLAST search tools available through NCBI 114
(http://blast.ncbi.nlm.nih.gov/Blast.cgi). 115
The following reference sequences were obtained from the GenBank database for comparative 116
analyses: A. suum from USA (NC_001327); A. suum from China (HQ704901); A. lumbricoides from 117
China (HQ704900); A. lumbricoides from unknown location (JN801161); Ascaris from Gibbon 118
(KC839987) and a chimpanzee (KC839986) from China. 119
120
2.4. Phylogenetic analysis and genetic variation 121
122
The 12 protein coding genes and the two ribosomal RNA (rDNA) genes were extracted and aligned 123
using MUSCLE (Edgar, 2004). Baylisascaris procyonis from China (NC_016200) was used as 124
outgroup in phylogenetic analyses. A second dataset containing only the 383 bp of the cox1 gene used 125
in previous studies was also employed for comparative phylogenetic analysis. Maximum Likelihood 126
(ML) and Maximum parsimony (MP) trees were built using MEGA v6.1 (Tamura et al., 2007) 127
employing 1000 bootstraps to test the stability of the topology. For ML the best-to-fit substitution 128
models were identified using jModelTest2 (Darriba et al., 2012) under Akaike information criterion 129
(AIC) (Akaike, 1974) for each dataset. The Tamura 3-parameter model with gamma distribution and 130
invariant sites was applied to all mt protein-encoding gene sequences, and the Hasegawa-Kishino-131
Yano model with invariant sites to the partial mt cox1 sequences. For MP, a heuristic search using 132
tree bisection-reconnection (TBR) branch swapping was used, with an addition of 10 initial random 133
trees. Bayesian inference (BI) was conducted using BEAST v. 1.6.1. (Drummond and Rambaut, 134
2007). Log-normal was used as a prior and General Time Reversible (GTR) model with gamma 135
distribution was used as the substitution model. A random starting tree with Yule prior was assumed. 136
Three independent runs with 10 million steps each, with a burn-in of 10,000 steps, were carried out. 137
Tracer v.1.6 (Drummond and Rambaut, 2007) was used to analyze log files of the MCMC chains, 138
and the reliability of parameters was verified by recording effective sample sizes values of > 200. 139
Tree Annotater v.1.6.1 (Drummond and Rambaut, 2007) was used to summarize the tree data, with a 140
posterior probability (pp) limit of 0.5. MEGA was used to estimate the p-distances between the 141
difference clades identified in the phylogenetic analyses. 142
The genetic variation between the different genomes was characterized in terms of the number of 143
5
to identify the different mutations in each genome using human Ascaris from China (HQ704900) as 145
the reference mt genome. The number of mutations per mt genome and per mt gene, and the number 146
of unique mutations (only found in one mt genome) was identified by multiple-wise alignment by 147
MUSCLE (Edgar, 2004). The program DnaSP (Librado and Rozas, 2009) was used to identify 148
synonymous and non-synonymous mutations and the ratio between them, in order to predict the 149
pattern of selection on mt genes. 150
151
2.5 Demography and history of Ascaris spp. 152
To identify the most recent common ancestor (TMRCA) of the three major clusters we estimated 153
the effective population size (Ne) as this number is equal to TMRCA for uniparentally inherited DNA. 154
The formula Θ=2Ne
µ
, where Θ (theta) is the genetic diversity of a population, µ is the mutation rate 155per gene/genome and Ne is the effective population size and therefore in this case, TMRCA. Genetree 156
(Bahlo and Griffiths, 2000) was used to estimate Theta (Θ) using the 12 mt protein-encoding genes 157
as described (Hawash et al., 2016). 158
The mutation rate in the mt genome of free-living nematode Caenorhabditis elegans (1.6 X 10⁻⁷ 159
per site per generation) (Denver et al., 2000) was used as an estimate for Ascaris, as no information 160
is available for parasitic worms. The mutation rate in each mt genome was obtained by multiplying 161
the mutation rate with the length of the 12 mt protein-encoding genes (10,288 bp), giving 0.00165 162
mutations per generation. 163
Using an “isolation and migration” model implemented in IMa2 (Hey and Nielsen, 2004), 164
TMRCA and time since divergence were estimated using the 12 protein coding genes. The priors 165
used for the protein coding genes were t = 70 (upper bound of splitting time) and q = 180 (upper 166
bound of population size); no migration after isolation was allowed in the out model (m=0). The 167
Hasegawa-Kishino-Yano substitution model was used for the protein coding genes, while the 168
stepwise mutation model was used for microsatellite markers. 20 Markov chains with geometric 169
heating scheme (first and second heating parameters being 0.96 and 0.90, respectively) and 106 burn-170
in steps with 105 sampling genealogies were used. Three independent runs were conducted with 171
different seed numbers to assess the convergence. 172
173
3. Results 174
175
The mt genomes were sequenced at 80-150-times coverage. The mt genomes of the two human 176
Ascaris haplotypes H01 and H03 from Tanzania were 14,280 and 14,274 bp in length, respectively. 177
The mt genomes of the four pig derived Ascaris representing H01 (Uganda), H07 (Uganda), H28 178
(Tanzania) and H64 (United Kingdom) were 14,151, 14,320, 14,210 and 14,187 bp in length, 179
respectively. The genomes contain 12 mt protein-encoding genes, 22 genes for transfer RNAs and 180
two ribosomal RNA genes. Details on individual genomes, including gene annotations, can found in 181
GenBank under the following accession numbers:KY045800-KY045805. 182
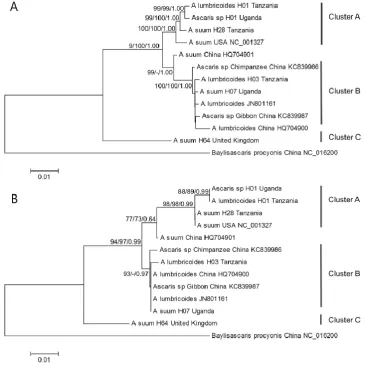
The phylogeny based on the mt genomic sequence data sets (i.e. 12 protein-encoding genes and 183
the two rRNA genes) are depicted in Fig. 1a. All three tree clustering methods gave the same 184
topology. Three main clusters (A, B and C) could be identified, with cluster C being basal to the two 185
other clusters. The p-distances between cluster C and cluster A+B ranged from 0.048-0.051, whereas 186
the p-distance between clusters A and B was in the range of 0.013-0.021. The topology of the 187
phylogenetic tree based on the mt genomic data sets was similar to that obtained using partial cox1 188
6
The p-distances based on partial cox1 sequences were higher between clusters A and C than between 190
clusters B and C (range: 0.047-0.052 and 0.037-0.039, respectively). 191
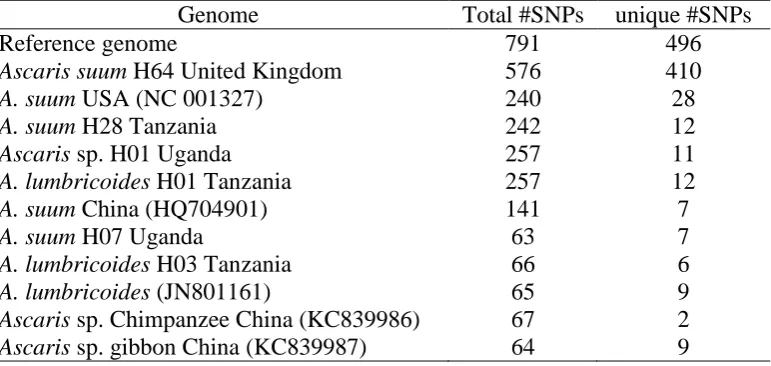
Among the 12 Ascaris genomes, a total of 791 mutations were identified in the 12 protein-encoding 192
genes (Table 2); 496 of these mutations were found to be unique to a single mt genome with highest 193
numbers in pig Ascaris from UK representing cluster C (Table 2). No mutations were found to be 194
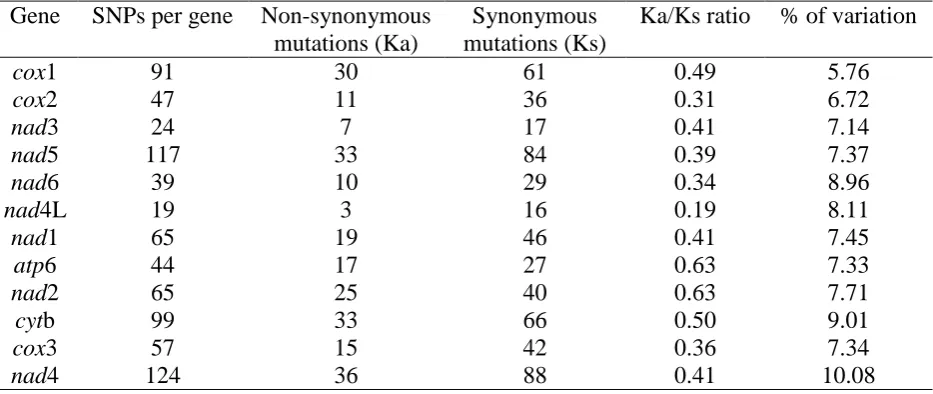
specific to Ascaris from either human or pig. The number of mutations per gene length was found to 195
be highest in the nad4 gene and lowest in the cox1 gene (Table 3). The non-synonymous/synonymous 196
(Ka/Ks) mutation ratio indicates that purifying selection is acting on all of the protein coding genes. 197
All SNPs detected are listed in Supplementary file S1. 198
Based on the 12 protein-encoding genes, theta was estimated at 223 (standard deviation: 82.35) 199
using Genetree (Bahlo and Griffiths. 2000). The effective population size and thereby the TMRCA 200
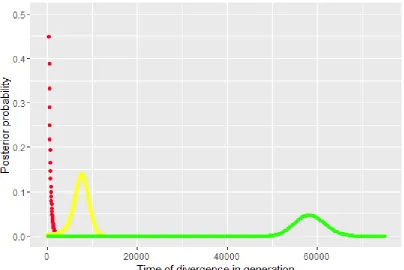
is thus 63,512 (±23,000) generations. A similar result was obtained when using IMa2 (Hey and 201
Nielsen, 2004), where the most recent common ancestor was estimated to occur 58,238 generations 202
ago, supported by pp estimates (Fig. 2). 203
The time of divergence between the three main clusters was estimated using IMa2. The first 204
divergence event between cluster A+B and C was ~7500 generations (Fig. 2), whereas the divergence 205
between clusters A and B was 913 generations (Fig. 2). However, the recent divergence was not 206
supported by pp-values, likely due to low genetic structure. 207
208
4. Discussion 209
210
In this study, we used a long range PCR-coupled approach to directly sequence 6 human and pig 211
Ascaris mt genomes representing five major haplotypes identified previously among worms from 212
worldwide locations (cf. Betson et al., 2014). The genes and gene order, including the 22 tRNAs, 213
were as described previously for Ascaris (cf. Okimoto et al., 1994; Liu et al., 2012). We found that 214
the phylogeny based on mt genomic data also identified three major clusters, in accordance with that 215
based on partial cox1 sequence data (Cavallero et al., 2013; Betson et al., 2014). The topology of the 216
phylogenetic trees are similar with cluster C, basal to the two other clusters, but where A. suum from 217
China (HQ704901) are found in cluster A when based on all mtDNA genes, it is found between 218
cluster A and B in the cox1 tree (Fig. 1). The genetic distance between cluster A+B and cluster C was 219
similar using data for all mt genes, whereas partial cox1 sequencing suggest that cluster B is more 220
basal than cluster A and more closely related to cluster C (Fig. 1). 221
Although mt cox1 is used in many population genetic and phylogenetic studies of Ascaris (e.g., 222
Peng et al, 2005; Cavallero et al, 2013; Betson et al, 2014), it was less variable in sequence compared 223
to nad4, suggesting that the latter gene may therefore be useful for future studies. We observed a 224
negative selection on the protein-encoding genes (Table 3), which has also been reported for other 225
parasitic nematodes (Ramesh et al., 2012; Hawash et al., 2015). In accordance with previous studies 226
(e.g. Betson et al., 2014), no mutations were found to be characteristic to Ascaris from humans or 227
Ascaris from pigs; thus there were no mutations of value to distinguish Ascaris from the two host 228
species. However, mt genomic data might be informative in delineating the genetic structure based 229
on the 3 clusters (A, B and C) which could reflect a complex demography and evolutionary history 230
as discussed below. 231
Ascaris representing clusters A and B have been identified in both humans and pigs from 232
worldwide locations, including both sympatric areas as well as regions where transmission among 233
individuals of only one of the host species is expected. In this way, worms belonging to both cluster 234
A and B have been found in pigs in Denmark and United Kingdom, where humans not are expected 235
to contribute to transmission, and in humans living in areas with few or no pigs, including Zanzibar 236
7
In this way, 82.9% and 57.8% of the human (n=392) and pig (n=331) worms from China belonged to 238
cluster B whereas the majority of the Uganda worms from humans and pig belonged to cluster A 239
(82.5% and 64.5%, respectively). Cluster C is interesting, as this haplotype only has been identified 240
in pigs from Europe and Africa using cox1 sequencing. In this way, it was not identified among 723 241
human and pig worms in China (Peng et al., 2005), 51 human and pig samples in Ecuador (Iñiguez 242
et al., 2012) or 255 humans in Uganda, Kenya, Zambia or on Zanzibar (Betson et al., 2014). Using a 243
combination of restriction mapping and sequencing of the mtDNA, Anderson and Jaenike (1997) also 244
only identified pig Ascaris from Europe in cluster C, except for a single human worm from 245
Guatemala. 246
In contrast to the mtDNA, where no clear geographic or host separation is observed, host or 247
geographic differentiation between Ascaris populations is observed when microsatellite markers are 248
used, but with contrasting results. In the study by Betson et al. (2014), Ascaris were first segregated 249
by host and then by geographical origin, suggesting a single host shift, followed by geographical 250
separation. This finding implies that the different haplotypes belonging to clusters A and B were 251
present before the host shift and were subsequently distributed worldwide. In contrast, Criscione et 252
al. (2007) found evidence for a geographical separation of Ascaris populations, followed by multiple 253
host shifts. As there is genetic evidence that domestication may have taken place multiple times 254
(Larson et al., 2005), this information supports the multiple host shift model. In this situation, the 255
haplotypes were first distributed worldwide and then transmitted to the new host species. This 256
proposal may explain why Ascaris representing cluster A predominates in Uganda, whereas Ascaris 257
representing cluster B predominates in China. 258
The difference in the population genetic structures given by mtDNA or microsatellite analysis may 259
be attributed to the difference in their mutation rates. As estimated in free-living nematodes (Molnar 260
et al., 2011; Molnar et al., 2012), the mutation rate of microsatellites is faster than mtDNA. Hence, 261
mtDNA could be useful for capturing ancient historical events while microsatellite markers are 262
informative for relatively recent evolutionary events. This may be the reason why worms from all 263
three mtDNA clusters can be found among Danish pigs but still belong to same population based on 264
microsatellite analysis (Betson et al., 2014). Moreover, the finding of shared haplotypes and worms 265
from both host belonging to cluster A and B may also be explained by recent or current introgression 266
supported the observation of cross-infection and hybrids in sympatric areas (Criscione et al., 2007; 267
Zhou et al., 2012; Betson et al., 2014). Incomplete lineage sorting may therefore explain the observed 268
mtDNA pattern most likely due to very short evolutionary history of Ascaris in the two host species 269
as discussed below. 270
It is expected that Ascaris host shift occurred during domestication about 10,000 years ago but it 271
is unknown whether the direction was from humans to pigs or the other way around. However, as 272
Ascaris eggs have been found in human archeological samples from France which dates back before 273
domestication (30,160-24,660) (Loreille and Bouchet, 2003) and as eggs have been identified in 274
human samples in America before introduction of pigs to the continent (reviewed by Goncalves et 275
al., 2003) this suggests a transmission from humans to pigs. The coalescent simulations on the 276
mtDNA suggested that the time to the most recent common ancestor is ~60,000 generations and that 277
at least two divergence events have happened (Fig. 2). The first one happened at the beginning of the 278
Neolithic period (15,000 – 2,500 years ago, given a generation time of ½-3 generations/year) and 279
resulted in cluster C. This may have followed by an isolation event of one pig population that explains 280
why Ascaris cluster C is exclusive in European pigs (except for zoonotic infection in humans). 281
Alternatively, cluster C have circulated in specific isolated human and pig populations but later was 282
lost from the human Ascaris population due to severe bottleneck. The second divergence has 283
happened more recently (1,800-300 years ago) and resulted in cluster A and B and may have been 284
8
transportation and colonization. However, these data cannot rule out the alternative hypothesis with 286
a single host shift about ~10,000 years ago followed by a more recent admixture of Ascaris 287
populations due to human activities including transport of pigs. This may also explain the complex 288
phylogenetic picture we see based on mtDNA. The mtDNA and microsatellite markers may however 289
also be complementary to each other with mtDNA providing information on more ancient 290
evolutionary events and microsatellite markers on more recent history. 291
Despite intensive research the taxonomic status of Ascaris in humans and pigs still needs to be 292
elucidated. Several studies have shown that Ascaris in the two hosts species can cross-infect (Nejsum 293
et al., 2005; Criscione et al., 2007; Peng et al., 2012; Betson et al., 2014) and hybrids have been 294
identified in sympatric areas (Criscione et al., 2007; Zhou et al., 2012). In addition, the phylogeny 295
based on mtDNA as described in this and other studies (e.g. Betson et al. 2014) may suggest that 296
Ascaris in humans and pigs represents a single species. However, sympatric populations seem to be 297
genetic differentiated (Anderson and Jaenike, 1997; Criscione et al., 2007; Betson et al., 2014) 298
suggesting that there is no, or very restricted contemporary gene-flow between populations, 299
supporting the idea of two separate species according to the biological species concept. Future studies 300
should apply next-generation sequencing to Ascaris populations from both host species from 301
locations worldwide, in order to illuminate the evolution, dispersal and the taxonomic status of this 302
enigmatic parasite. 303
304
Competing interests 305
The authors have declared that no financial and non-financial competing interests exist. 306
307
Acknowledgements 308
This work was supported by a Danish Agency for Science, Technology and Innovation grant awarded to PN.
309
RBG’s research is funded mainly through grants from the Australian Research Council (ARC) and the National
310
Health and Medical Research Council (NHMRC) of Australia. MB is supported by University of Surrey. The
311
original analysis of the samples reported in Betson et al. (2014) was supported by the Wellcome Trust
312
(grant 085440) and the Natural History Museum, London. Thanks to Helena Ngowi (Sokoine University
313
of Agriculture, Tanzania), Ida-Hella Poulsen and Sofie Nissen (University of Copenhagen, Denmark) 314
for providing worms. 315
9 References
317 318
Akaike, H., 1974. A new look at the statistical model identification. IEEE Trans. Automat. Contr. 19, 319
716–723. 320
Anderson, T.J., 2001. The dangers of using single locus markers in parasite epidemiology: Ascaris as 321
a case study. Trends Parsitol. 17, 183-188. 322
Anderson, T.J., Jaenike, J., 1997. Host specificity, evolutionary relationships and macrogeographic 323
differentiation among Ascaris populations from humans and pigs. Parasitol. 115, 325-342. 324
Araujo, A., Reinhard, K.J., Ferreira, L.F., Gardner, S.L., 2008. Parasites as probes for prehistoric 325
human migrations? Trends Parasitol. 24, 112-115. 326
Bahlo M., Griffiths R.C., 2000. Inference from gene trees in a subdivided population. Theor. Popul. 327
Biol. 57, 79-95. 328
Bethony, J., Brooker, S., Albonico, M., Geiger, S.M., Loukas, A., Diemert, D., Hotez, P.J., 2006. 329
Soil-transmitted helminth infections: ascariasis, trichuriasis, and hookworm. Lancet 367, 1521-330
1532. 331
Betson, M., Nejsum, P., Bendall, R.P., Deb, R.M., Stothard, J.R., 2014. Molecular epidemiology of 332
ascariasis: a global perspective on the transmission dynamics of Ascaris in people and pigs. J. 333
Infect. Dis. 210, 932-941. 334
Brinkkemper O., van Haaster H., 2012. Eggs of intestinal parasites whipworm (Trichuris) and 335
mawworm (Ascaris): Non-pollen palynomorphs in archaeological samples. Rev. Palaeobot. 336
Palynol. 186, 16–21. 337
Cavallero, S., Snabel, V., Pacella, F., Perrone, V., D'Amelio, S., 2013. Phylogeographical studies of 338
Ascaris spp. based on ribosomal and mitochondrial DNA sequences. PLoS Negl. Trop. Dis. 7, 339
e2170. 340
Cox, F.E., 2004. History of human parasitic diseases. Infect. Dis. Clin. North. Am. 18, 171-188. 341
Criscione, C.D., Anderson, J.D., Sudimack, D., Peng, W., Jha, B., Williams-Blangero, S., Anderson, 342
T.J.C., 2007. Disentangling hybridization and host colonization in parasitic roundworms of 343
humans and pigs. Proc. Biol. Sci. 274, 2669-2677. 344
Darriba, D., Taboada, G.L., Doallo, R., Posada, D., 2012. jModelTest 2: more models, new heuristics 345
and parallel computing. Nat. Methods 9, 772. 346
Denver, D.R., Morris, K., Lynch, M., Vassilieva, L.L., Thomas, W.K., 2000. High direct estimate of 347
the mutation rate in the mitochondrial genome of Caenorhabditis elegans. Science 289, 2342-348
2344. 349
Drummond, A.J., Rambaut, A., 2007. BEAST: Bayesian evolutionary analysis by sampling trees. 350
BMC Evol. Biol. 7, 214. 351
Edgar, R.C., 2004. MUSCLE: multiple sequence alignment with high accuracy and high throughput. 352
Nucleic Acids Res. 32, 1792-1797. 353
Goncalves, M.L., Araujo, A., Ferreira, L.F., 2003. Human intestinal parasites in the past: new findings 354
and a review. Mem. Inst. Oswaldo. Cruz. 98 Suppl 1, 103-118. 355
Hawash, M.B., Andersen, L.O., Gasser, R.B., Stensvold, C.R., Nejsum, P., 2015. Mitochondrial 356
genome analyses suggest multiple Trichuris species in humans, baboons, and pigs from 357
different geographical regions. PLoS Negl. Trop. Dis. 9, e0004059. 358
Hawash, M.B., Betson, M., Al-Jubury, A., Ketzis, J., LeeWillingham, A., Bertelsen, M.F., Cooper, 359
P.J., Littlewood, D.T., Zhu, X.Q., Nejsum, P., 2016. Whipworms in humans and pigs: origins 360
and demography. Parasit. Vectors 9, 37. 361
Hey, J., Nielsen, R., 2004. Multilocus methods for estimating population sizes, migration rates and 362
divergence time, with applications to the divergence of Drosophila pseudoobscura and D. 363
10
Hotez, P.J., Kamath, A., 2009. Neglected tropical diseases in sub-saharan Africa: review of their 365
prevalence, distribution, and disease burden. PLoS Negl. Trop. Dis. 3, e412. 366
Iñiguez A.M., Leles D., Jaeger L.H., Carvalho-Costa F.A., Araújo A., Amazonas Research Group, 367
2012. Genetic characterisation and molecular epidemiology of Ascaris spp. from humans and 368
pigs in Brazil.Trans. R. Soc. Trop. Med. Hyg. 106, 604– 612. 369
Koressaar T., Remm M., 2007. Enhancements and modifications of primer design program Primer3. 370
Bioinformatics 23, 1289-1291 371
Larson, G., Dobney, K., Albarella, U., Fang, M., Matisoo-Smith, E., Robins, J., Lowden, S., 372
Finlayson, H., Brand, T., Willerslev, E., Rowley-Conwy, P., Andersson, L., Cooper, A., 2005. 373
Worldwide phylogeography of wild boar reveals multiple centers of pig domestication. Science 374
307, 1618-1621. 375
Leles, D., Gardner, S.L., Reinhard, K., Iniguez, A., Araujo, A., 2012. Are Ascaris lumbricoides and 376
Ascaris suum a single species? Parasit. Vectors 5, 42. 377
Leles D., Fugassa M, Ferreira LF, Iniguez AM, Araújo A., 2010. A parasitological paradox: why is 378
ascarid infection so rare in the prehistoric Americas? J. Archaeol. Sci. 37, 1510–1520. 379
Librado, P., Rozas, J., 2009. DnaSP v5: a software for comprehensive analysis of DNA polymorphism 380
data. Bioinformatics 25, 1451-1452. 381
Liu, G.H., Wu, C.Y., Song, H.Q., Wei, S.J., Xu, M.J., Lin, R.Q., Zhao, G.H., Huang, S.Y., Zhu, X.Q., 382
2012. Comparative analyses of the complete mitochondrial genomes of Ascaris lumbricoides 383
and Ascaris suum from humans and pigs. Gene 492, 110-116. 384
Loreille, O., Bouchet, F., 2003. Evolution of ascariasis in humans and pigs: a multi-disciplinary 385
approach. Mem. Inst. Oswaldo. Cruz. 98 Suppl 1, 39-46. 386
Mitchell D.P., 2013. The origins of human parasites: exploring the evidence of endoparasitism 387
throughout human evolution. Int. J. Paleopathol. 3, 191–198. 388
Molnar, R.I., Bartelmes, G., Dinkelacker, I., Witte, H., Sommer, R.J., 2011. Mutation rates and 389
intraspecific divergence of the mitochondrial genome of Pristionchus pacificus. Mol. Biol. 390
Evol. 28, 2317-2326. 391
Molnar, R.I., Witte, H., Dinkelacker, I., Villate, L., Sommer, R.J., 2012. Tandem-repeat patterns and 392
mutation rates in microsatellites of the nematode model organism Pristionchus pacificus. G3 2, 393
1027-1034. 394
Nejsum, P., Betson, M., Bendall, R.P., Thamsborg, S.M., Stothard, J.R., 2012. Assessing the zoonotic 395
potential of Ascaris suum and Trichuris suis: looking to the future from an analysis of the past. 396
J. Helminthol. 86, 148-155. 397
Nejsum, P., Parker, E.D., Frydenberg, J., Roepstorff, A., Boes, J., Haque, R., Astrup, I., Prag, J., 398
Sørensen, U.B.S., 2005. Ascariasis is a zoonosis in Denmark. J. Clin. Microbiol. 43, 1142– 399
1148. 400
Nissen, S., Poulsen, I.H., Nejsum, P., Olsen, A., Roepstorff, A., Rubaire-Akiiki, C., Thamsborg, S.M., 401
2011. Prevalence of gastrointestinal nematodes in growing pigs in Kabale District in Uganda. 402
Trop. Anim. Health Prod. 43, 567-572. 403
Okimoto, R., Macfarlane, J.L., Clary, D.O., Wolstenholme, D.R., 1992. The mitochondrial genomes 404
of two nematodes, Caenorhabditis elegans and Ascaris suum. Genetics 130, 471-498. 405
Page, A.J., Taylor, B., Delaney, A.J., Soares, J., Seemann, T., Keane, J.A., Harris, S.R., 2016. SNP-406
sites: rapid efficient extraction of SNPs from multi-FASTA alignments. bioRxiv, 407
http://dx.doi.org/10.1101/038190. 408
Peng, W., Yuan, K., Hu, M., Zhou, X., Gasser, R.B., 2005. Mutation scanning-coupled analysis of 409
haplotypic variability in mitochondrial DNA regions reveals low gene flow between human and 410
11
Pullan, R.L., Smith, J.L., Jasrasaria, R., Brooker, S.J., 2014. Global numbers of infection and disease 412
burden of soil transmitted helminth infections in 2010. Parasit. Vectors 7, 37. 413
Ramesh, A., Small, S.T., Kloos, Z.A., Kazura, J.W., Nutman, T.B., Serre, D., Zimmerman, P.A., 414
2012. The complete mitochondrial genome sequence of the filarial nematode Wuchereria 415
bancrofti from three geographic isolates provides evidence of complex demographic history. 416
Mol. Biochem. Parasitol. 183, 32-41. 417
Roepstorff, A., Mejer, H., Nejsum, P., Thamsborg, S.M., 2011. Helminth parasites in pigs: new 418
challenges in pig production and current research highlights. Vet. Par. 180, 72-81. 419
Schattner, P., Brooks, A.N., Lowe, T.M., 2005. The tRNAscan-SE, snoscan and snoGPS web servers 420
for the detection of tRNAs and snoRNAs. Nucleic Acids Res. 33, W686-689. 421
Søe, M.J., Kapel, C.M., Nejsum, P., 2016. Ascaris from humans and pigs appear to be reproductively 422
isolated species. PLoS Negl. Trop. Dis. 10, e0004855. 423
Tamura K., Stecher G., Peterson D., Filipski A., Kumar S., 2013. MEGA6: Molecular Evolutionary 424
Genetics Analysis version 6.0. Mol. Biol. Evol. 30, 2725-2729. 425
Untergasser A., Cutcutache I., Koressaar T., Ye J., Faircloth B.C., Remm M., Rozen S.G., 2012. 426
Primer3 - new capabilities and interfaces. Nucleic Acids Res. 40, e115. 427
Zhou, C., Li, M., Yuan, K., Deng, S., Peng, W., 2012. Pig Ascaris: an important source of human 428
ascariasis in China. Infect. Genet. Evol. 12, 1172-1177. 429
12 Legends to figures
431 432
Fig. 1. Inferred evolutionary relationship among the different Ascaris mtDNA genomes based on the 433
12 protein coding genes and the two ribosomal DNA genes (A) and based on 383 bp of the cox1 gene 434
(B) using Baylisascaris procyonis as outgroup. For comparison, six Ascaris genomes were included 435
from GenBank (accession numbers indicated). Maximum likelihood (ML), maximum parsimony 436
(MP) and Bayesian inference (BI) was used and the bootstrap values and posterior probabilities are 437
given at the nodes if >70 in the order: ML/MP/BI. The scale bar: number of base substitutions per 438
site. 439
440
13
Fig. 2. Splitting time based on the isolation and migration model between Ascaris populations of 445
clusters A/B and cluster C (yellow line) and Ascaris populations of cluster A and B (red points) and 446
the time to the most recent common ancestor (TMRCA) (green line). The horizontal axis represents 447
the number of generations since splitting while the vertical axis represents the posterior probability 448
density. 449
450 451
14 453
Table 1. Primers used for long range PCR of the mtDNA genome of Ascaris from humans and pigs
Region Fragment
length Forward primer Reverse Primer
CO1F-ND5R 3.4kbp CO1_F: TGGTTGTGTTGTTTGAGCTCA ND5_R: ACAAAACTCAAACCAATACCAAC
ND5F-rrnSR 2.8kbp ND5_F: AGGTGTAGAGGGGCTATGAA rrnS_R: GGTACTAATCTGATTCATTCACC
rrnSF-ND2R 4.3kbp rrnS_F: TGTTCCAGAATAATCGGCTAGAC ND2_R: AAACCAACAAGACTTCCCAA
ND2F-CO3R 3.0kbp ND2_F: TGTCTAAGGGGTCTGGTTCT CO3_R: CCAAACTACATCTACAAAATGCC
CO3F-CO1R 3.2kbp CO3_F: TGGTTTCTTTTGCTTGGGGT CO1_R: ACCACAAAGTCACACCCGTA
454 455 456
Table 2. Number of SNPs and unique SNPs in the 12 protein coding genes for each of the 12 genomes using Ascaris lumbricoides from China (HQ704900) as reference genome
Genome Total #SNPs unique #SNPs
Reference genome 791 496
Ascaris suum H64 United Kingdom 576 410
A. suum USA (NC 001327) 240 28
A. suum H28 Tanzania 242 12
Ascaris sp. H01 Uganda 257 11
A. lumbricoides H01 Tanzania 257 12
A. suum China (HQ704901) 141 7
A. suum H07 Uganda 63 7
A. lumbricoides H03 Tanzania 66 6
A. lumbricoides (JN801161) 65 9
Ascaris sp. Chimpanzee China (KC839986) 67 2
Ascaris sp. gibbon China (KC839987) 64 9
15 459
Table 3. Number of SNPs, synonymous, non-synonymous mutations and the percentage of variation given as number of SNPs per gene length for each of the 12 protein coding genes for the 12 Ascaris genomes
Gene SNPs per gene Non-synonymous mutations (Ka)
Synonymous mutations (Ks)
Ka/Ks ratio % of variation
cox1 91 30 61 0.49 5.76
cox2 47 11 36 0.31 6.72
nad3 24 7 17 0.41 7.14
nad5 117 33 84 0.39 7.37
nad6 39 10 29 0.34 8.96
nad4L 19 3 16 0.19 8.11
nad1 65 19 46 0.41 7.45
atp6 44 17 27 0.63 7.33
nad2 65 25 40 0.63 7.71
cytb 99 33 66 0.50 9.01
cox3 57 15 42 0.36 7.34
nad4 124 36 88 0.41 10.08