R E S E A R C H
Open Access
A novel image de-noising method based on
spherical coordinates system
Degan Zhang
1,2, Xuejing Kang
1,2*and Jinghui Wang
1,2Abstract
In this article, a novel image de-noising method is proposed. This method is based on spherical coordinates system. First, spherical transform is re-defined in wavelet domain, and the properties of the spherical transform in wavelet domain are listed. Then, a new adaptive threshold in spherical coordinate system is presented. It has been proved based on Besov space norm theory. After that, a novel curve shrinkage function is proposed to overcome the limitation of the traditional shrinkage functions. The new function can reach and exceed the true value and enhance the edge of the image. Finally, the multi-scale product in wavelet domain is introduced to spherical coordinates system. This article names the multi-scale product in spherical coordinates system as Multi-Scale Norm Product. The experimental results compared the improved algorithm with other methods from the peak signal-to-noise ratio, mean square error, and running time. The results indicate that improved algorithm is simple and effective.
Keywords:wavelet translation, image de-noising, multi-scale product, shrinkage function, spherical coordinates.
1. Introduction
Noise produced in image acquisition and transmission will cause image quality decline. Therefore, image de-noising is an important problem in the field of image processing [1-4]. The goal of image de-noising is to recover the original image from such a noisy copy. The traditional de-noising methods cause details blurring of the reconstructed image. Discrete wavelet transform (DWT) provides a fast, local, sparse, and decorrelates multi-resolution analysis of signals. It can reconstruct high-quality images [5]. In recent years, wavelet shrink-age algorithm for imshrink-age de-noising has widely been used in different fields [6-8].
The threshold and shrinkage function are the key fac-tors in image de-noising. They will determine the effec-tiveness of image de-noising. Donoho [9,10] presented a method named wavelet shrinkage and showed its obvious efficiency on signal de-noising. They proved that wavelet shrinkage was nearly optimal over a wide rage of function classes and error criterions. They also provided an estimated function with smoothness not
less than the original. With these advantages, the method began to be widely applied. However, the uni-versal threshold T=σ2 ln(N∗M) tended to set all the coefficients of image details to zero, especially when Napproaches infinite. At the mean while, the standard deviation of noise must be pre-estimated. Bias existed between estimated value and real value will reduce the effect of image de-noising. DeVore [11] and Feng et al. [12] believe the image space belongs to Besov space. In 1998, Chambolle et al. [13] proposed a threshold in Besov space.
The classic shrinkage functions are the hard and soft threshold functions [9,10]. Many researchers have pro-posed improved methods to optimize the classic algo-rithm. Khare et al. [14] proposed a multi-scale adaptive soft-threshold function and achieved a good de-noising effect. However, in this method, the wavelet coefficients were processed directly. It will cause distortion of the reconstructed image. Wang [15] introduced a hyperbolic shrinkage function. This function avoided processing the wavelet coefficients directly. However, the hyperbolic function could not achieve the true value of the coeffi-cients and cause edge blurring. Li et al. [16] presented an improved soft-threshold function. This function is more flexible than the classic soft and hard thresholds. * Correspondence: [email protected]
1
Key Laboratory of Computer Vision and System, Tianjin University of Technology, Ministry of Education, Tianjin 300384, China
Full list of author information is available at the end of the article
However, the starting point of this function is origin. There will be some noise information mistakenly pro-cessed as signal information.
Bao and Zhang [17] and Meng et al. [18] used multi-scale products to control the shrinkage of the wavelet coefficients. Multi-scale products can fully use the corre-lation of wavelet coefficients in different scales. Inspired by this idea, multi-scale norm product (MSNP) is defined in this article to control the shrinkage of the wavelet coefficients.
This article proposes a new threshold after analyzing the relationship between wavelet coefficients norm, Besov space norm, and radial component in the spheri-cal coordinates, and a new curve shrinkage function is proposed to achieve good de-noising effect. The coeffi-cients estimated by new function can reach and exceed the real value. It will avoid the edge blurring and enhance the coefficients of contours. Experimental results show that the improved method in this article retains the advantage of spherical coordinates. This new method cannot only be provided with effectively de-noising, but also have better preserve image details and enhance the image edge information.
2. Traditional wavelet shrinkage algorithm
Suppose that it is desired to recover an unknown signal f(x, y) from a noise imagef*(x, y),
f∗x,y=fx,y+σ εi (1)
whereεiis independent and identically distributed (i.i. d) asN(0,1), srefers to the noise level.
The idea of the wavelet shrinkage de-noising is large wavelet coefficients reserve the useful information of image, while smaller coefficients contain the noise infor-mation which should be abandoned. The steps of the wavelet de-noising algorithm are
•To decompose noising image in wavelet domain;
•Use threshold Tand shrinkage function to process the high-frequency coefficients.
Hard-threshold function:
w∗x,y=
wx,ywx,y≥T
0 wx,y<T (2)
Soft-threshold function:
w∗x,y=
signwx,y∗wx,ywx,y≥T
0 wx,y<T (3)
wherew(x, y) denotes wavelet coefficients,w*(x, y) is wavelet coefficients after processing, Tis the threshold, sign(·)is sign function.
•To process the low-frequency and high-frequency coefficients by inverse wavelet transform and recon-struct the image.
3. Spherical transform re-defined in wavelet domain
Skowronski [19] firstly introduced spherical coordinates system into wavelet domain. Wang [15] extended this idea. However, he did not propose the properties of spherical transform in wavelet domain, neither define a proper threshold in spherical coordinates system.
This article re-defines the spherical transform in wave-let domain and lists its properties. Set fdenotes a two-dimensional image,C(j,ki),i= 1, 2, 3is the high-frequency parts of the imagefafter wavelet decomposing.
Define 1:The spherical transform in wavelet domain is defined as follows:
⎧ ⎪ ⎪ ⎪ ⎪ ⎪ ⎪ ⎪ ⎨ ⎪ ⎪ ⎪ ⎪ ⎪ ⎪ ⎪ ⎩
R=C(j,1k) 2
+
C(j,2k)
2 +
C(j,3k)
2
θ=tg−1Cj(,2k)C(j,1k)
ϕ= cos−1
Cj(,3k)Cj(,1k)2+C(j,2k)2+C(j,3k)2 (4)
where C(j,k1), Cj,k(2), C(j,k3), respectively, represent
hori-zontal, vertical, and diagonal components.Ris the radial component in spherical coordinate system,θ,are the phase angle components. Figure 1 shows the correspon-dence relationship of the components between spherical coordinate system and wavelet domain.
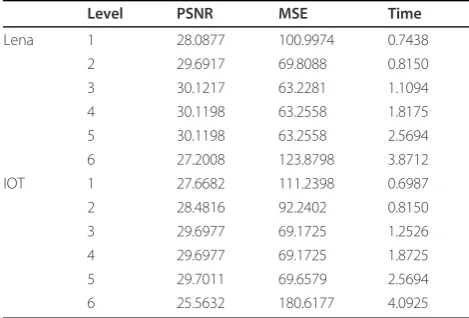
Skowronski [19] only expressed the Haar coefficients in spherical coordinates and the radial component came from the variance of a block. Compared with the define of Skowronski, in this article, the wavelet coefficients Table 1 De-noising effects evaluation of different
decomposing level
Level PSNR MSE Time
Lena 1 28.0877 100.9974 0.7438
2 29.6917 69.8088 0.8150
3 30.1217 63.2281 1.1094
4 30.1198 63.2558 1.8175
5 30.1198 63.2558 2.5694
6 27.2008 123.8798 3.8712
IOT 1 27.6682 111.2398 0.6987
2 28.4816 92.2402 0.8150
3 29.6977 69.1725 1.2526
4 29.6977 69.1725 1.8725
5 29.7011 69.6579 2.5694
are mapped to the components in spherical coordinate system. This define is reversible and exactly establishes one-to-one correspondence between wavelet coefficients and components in spherical coordinate system. The properties of spherical transform in wavelet domain lists as follows:
Property 1: The image energy in the three high-fre-quency parts is completely mapped to radial component Rof spherical coordinate system. The phase angle com-ponentsθ,only contain the location information.
From Property 1, the energy in high-frequency parts is completely mapped to radial component. Therefore, we just need to process the radial component in spherical coordinate system. This idea can avoid processing the wavelet coefficients directly. It reduces the image distor-tion in a certain extent.
Property 2: Radial componentRand the phase angle componentsθ,are mutually independent. The small angle does not always correspond to little energy.
Property 3: Spherical transform can further reduce the correlation among coefficients in the same scale.
Property 4: Spherical transform does not change the correlation among coefficients in different scales.
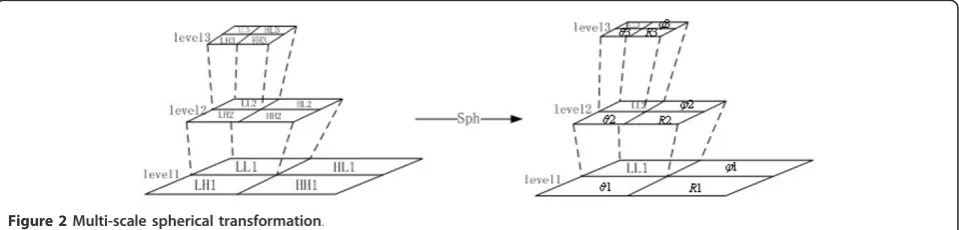
Figure 2 demonstrates Properties 3 and 4.
4. A novel threshold in spherical coordinates
DeVore [11] and Feng et al. [12] have proved the image space belong to Besov space. Chambolle et al. [13] pro-posed a threshold in Besov space. Based on Chambolle threshold, this article presents a novel shrinkage thresh-old which is optimal in spherical coordinates. The new threshold does not require pre-estimated noise intensity.
It avoids the incomplete de-noising problem caused by inaccurate estimates.
Theorem 1: The threshold in spherical coordinates system is
T=√6|R|N (5)
whereNdenotes image pixel,Ris radial component in spherical coordinates.
Proof: Chambolle et al. [13] proposed a better shrink-age threshold in Besov space as follows:
N≤T−qFq
Bβq(Lp()) (6)
where N is the number of image pixel, R is radial component in spherical coordinates system. The equiva-lent relationship between Besov space norm
FBβ
q(Lp()) and radial component norm is established
in three steps.
(a) First, to establish equivalent relationship between Besov space norm FBβq(Lp()) and wavelet
coeffi-cients normC(j,ki), i= 1, 2, 3.
Supposefis a noise image in the intervalΩ= [0, 1)2. It is proper to use Besov space norm to describe the regularity of image [11,12]. First, the image fis decom-posed by compactly supported orthogonal wavelet Dau-bechies (db2) in this article. Supposej, k= 1 denotes a cycle scaling function. Ψ= {ψ(1), ψ(2), ψ(3)} is a set of
Figure 1Spherical transformation in wavelet domain.
orthogonal wavelet bases in the space Wj2, where
ψ(1)
j,k (x1,x2)=ψ (x1) ϕ (x2)
ψ(2)
j,k (x1,x2)=ϕ (x1) ψ (x2)
ψ3
j,k(x1,x2)=ψ (x1) ψ (x2)
(7)
the 2D-DWT of imagefis
f =
j∈Z2,k∈K
C(j,ki) j,k+
j∈Z2,k∈K
dj,Kϕj,Ki= 1, 2, 3 (8)
where C(j,ki)=<f,ψj,k(i)>, dj,k=<f,ϕj,k>, forj, k = 1, the formula (8) can be rewritten as
f =
j∈Z2,k∈K
C(j,ki) j,k+<f, 1> i= 1, 2, 3 (9)
Use wavelet coefficients norm to represent the norm in the spaceLp(Ω).
fpL
p()=
j∈Z2,k∈K
C(j,ki)p+<f, 1>p (10)
If wavelet coefficients ψj,k(i) (i= 1, 2, 3) belong to the
space BβpLp()
,b>a
fBα
p(Lp())≈ ⎛
⎝
j∈Z2,k∈K
2αkp2k(p−2)C(j,ki)p
⎞ ⎠
1/p
(11)
As a general rule, we just need to consider the space Bα1(L1()), herep= 1,a≤1,k≥0, then
fBα
1(L1())≈
k∈K,j∈Z2
2k(α−1)C(j,ki) (12)
Thus, the equivalent relationship between Besov space norm and wavelet coefficients norm has been estab-lished.
(b) Second, to establish equivalent relationship between the thresholdT in Besov space and wavelet
coefficients norm C(j,ki),i= 1,2,3.
Set q = 1, shrinkage threshold formula (6) can be rewritten as follows:
T≤ FBα1(L1())
N (13)
Therefore,
T≤
k∈K,j∈Z2
2k(α−1)C(j,ki)
N (14)
Generally, dyadic wavelet is used to deal with discrete
image signal, for a≤1, set α= 1
2, the formula (14) can
be rewritten as follows
T≤
k∈K,j∈Z2
2−k/2C(j,ki)
N (15)
According to the property of inner product
2−k/2C(j,ki)= 2−k/2<f,ψj,k(i)>=<f, 2−k/2ψj,k(i)> (16)
Based on double scaling equation of wavelet, the fol-lowing formula will be established:
2−k/2ψj,k(i)= 2−k/2ψ2−kx−k
= 2−k/2√2 n∈Z
gnϕ
2−k+1x−2j−n
=
n∈Z
gnϕj−1,2k+n(x)=
n∈Z
gn−2kϕj−1,n(x)
=ψj−1,k(i)
(17)
Therefore,
2−k/2C(j,ki)= 2−k/2<f,ψj,k(i)>=<f,ψj(−i)1,k>=C(j−i)1,k(18)
From the formulas (15) and (18), shrinkage threshold in wavelet field is
T≤
k∈Z,j∈Z2 C(j−i)1,k
N i= 1, 2, 3 (19)
(c) Finally, to establish equivalent relationship
between wavelet coefficients norm C(j−i)1,k and
radial component norm |R| in spherical coordinates system.
Properties 1 and 2, threshold T just needs to process radial component R. So, the equivalent relationship between radial componentRand high-frequency C(j−1,ki) needs to be established.
Based on the spherical transform in wavelet domain (formula 4), the following inequality will be established:
⎧ ⎪ ⎪ ⎨ ⎪ ⎪ ⎩
R2>minC(j−i)1,k2
+ maxC(j−i)1,k2
R2≥3 minC(j−i)1,k2
(20)
Therefore,
2 3R
2≥maxC(i) j−1,k
2
≥C(j−1,ki)
2
(21)
wherei =1,2,3k≥0,jÎ{0,1,....2k-1}2.
Thence, the following relationship will be established between wavelet coefficients norm and radial compo-nent norm.
C(j−i)1,k≤
23|R| (22)
The interval of shrinkage threshold will be
T≤√6|R|N (23)
The least upper bound ofT is chosen in this article as the final shrinkage threshold:
T=√6|R|
N (24)
whereNdenotes the number of image pixel.
Many studies have demonstrated that different wavelet-decomposed scales play an important role in image pro-cess. The de-noising effect will be improved if we choose the proper decomposed scales. As everyone knows, noise information is especially rich in high-frequency region. At different scales, noise information has different distri-bution characteristics. Therefore, different shrinkage thresholds need to be chosen at different scales. After analyzing wavelet multi-scale characteristics, the thresh-old at different scales is multiplied by scaling factorhk= 1/4k-1. Therefore, the shrinkage threshold under different scales is finally determined as follows:
Tk=ηk
√
6|Rk|
N
,k= 1, 2, 3,. . . (25)
Based on the above proof, the new threshold has the following advantages:
(1) After the third or more decomposition of wavelet
transform, the scaling factor is ηk≤ 1
16, therefore, it
can simplify the process and advance the operation speed.
(2) Do not need to estimate the standard deviation of noise before image de-noising, which will avoid the error existed between estimated value and real value and reduce the complexity of the algorithm.
5. MSNP in spherical coordinates system
In the wavelet domain, there is a correlation among the coefficients in different scales. If the amplitude of coeffi-cients in small scales is large, at a big probability, the amplitude of coefficients in corresponding big scales is large too. Multi-scale product is based on this property of wavelet transform. Inspired by the idea of multi-scale product used in image de-noising [15,16], this article defines an MSNP which is based on the following premises.
(1) In the wavelet domain, with the increase of decomposition level, the wavelet coefficients of effective signal will increase or remain unchanged. While the wavelet coefficients of noise signal will decrease.
(2) Spherical transform reduces the relevance of scal-ing interior. However, it does not change the correlation of wavelet coefficients in different scales (Figure 2).
Define 2: The MSNP at the point (x, y) in spherical coordinates system is defined as follows:
p2k
x,y= K j=1Rj
x,y (26)
whereK is the decomposing scales. The MSNP has the following properties:
Property 5:The MSNP in spherical coordinates must be positive value.
Property 6: “The larger (effective signal) the greater, the smaller (noise signal) the smaller”. With the increase of the decomposition levelK, we will get the conclusion
p2k
signal>>p2k(noise).
The MSNP is controlled by the new threshold pro-posed in Section 4 in the image de-noising. It can enlarge the distance between effective signal and noise signal. It avoids the disadvantage of the traditional methods that smaller wavelet coefficients are wrongly removed. Therefore, MSNP will effectively remove the additive noise without loss of the important features of the original image.
6. A new curve shrinkage function in spherical coordinates system
From the promise 1 mentioned in Section 5, the maxi-mum amplitude wavelet coefficients must be the effec-tive signal.
they cannot reach the true value, which will cause the edge blurry of reconstructed image.
In order to gain better de-noising effect, this article constructs a new curve shrinkage function. It can ensure that the estimated signal is continuous at the threshold, and with the signal amplitude increases, the estimated value can reach and exceed the true value. It not only avoids the edge blurry, but also enhances the critical information. The new curve shrinkage function is
R∗i,j=
ρ·Ri,j−1 + log1 +Ri,j−T−1·TRi,j≥T
0 Ri,j<T (27)
where ρ= 1 + 1
5π arctanR
i,j−T is the adjust factor of the curve shrinkage function, N, M are the image dimensions,i= 1,2,....,N, j= 1,2,....,M.
The advantages of the improved curve shrinkage func-tion are listed below.
(a) When R(i, j) = T, it is easy to verify R*(i, j) = 0. So, the new function is continues atT.
(b) When R(i, j) >T, the proposed function meets the following inequality:
Ri,j−T≤Ri,j−1 + log1 +Ri,j−T−1·T≤Ri,j (28)
Therefore, the radial componentR*(i, j) estimated by the new curve function is located between hard and soft thresholds.
(c) As |R (i, j)|-(1+ log(1+|R(i, j)|-T))-1·T is nonli-nearity function, and log(·)is a monotone increasing function, when R(i, j)®∞, the conclusionR*(i, j)®R (i, j) will be established. Therefore, with the increase of R (i, j), the new curve function will infinite approximate to true value.
(d) The adjust factor
ρ= 1 + 1
5πarc tanR
i,j−T,rÎ[1, 1.1] in the new function will raise the approach speed of the for-mulaR*(i, j)®R(i, j). Arctan(·) is a monotone continu-ous function, which can ensure R*(i, j) smooth approach toR(i, j).rÎ[1, 1.1], as the signal amplitude increases, the estimated signal can reach and exceed the real value. Large radial component has a certain enhancement, and this increase is limited to < 110% of the original energy. Therefore, it can effectively pre-serve the edge of the signal, and avoid the local enhancement caused by the unexpected.
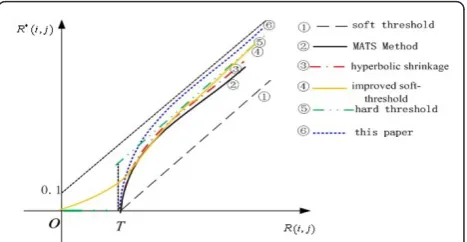
Figure 3 shows the contrast between different shrink-age functions. In Figure 3, soft and hard thresholds were presented by Donoho [9,10], MATS Method was pro-posed by Khare et al. [14], Hyperbolic shrinkage was
used by Wang [15]. Li et al [16] presented the improved soft-threshold function.
7. Algorithm design
Supposefis the observed noise image. The steps of the improved algorithm:
Step 1. First, the imagef is decomposed by wavelet transform.
Step 2. The high frequencies C(j,ki),i= 1, 2, 3 of the image at different scales are transformed to spherical coordinates system by formula (4).
Step 3. Calculate the MSNP p2k
Step 4. Process the radial components Rkat different scales
(a) At the first decomposition, the interference brought by noise is strong, the improved curve shrinkage function proposed in this article is used to process the radial components:
R∗i,j=
⎧ ⎨ ⎩
ρ·Ri,j−1 + log1 +Ri,j−Tk
−1·
Tk
Ri,j≥Tk
0 Ri,j<Tk
(29)
(b) At the second or more decomposition of wavelet transform, the new threshold proposed in this article controls the MSNP for image de-noising.
R∗i,j=
⎧ ⎨ ⎩
ρ·Ri,j−1 + log1 +Ri,j−Tk −1
·Tk
p2k
i,j≥Tk
0 p2k
i,j<Tk
(30)
Step 5. If the estimated radial components areR*(i, j) = 0, set the angleθ,equal to zero.
Step 6. The components θ,, R*in spherical coordi-nates do inverse spherical transform as follows:
⎧ ⎪ ⎪ ⎪ ⎪ ⎨ ⎪ ⎪ ⎪ ⎪ ⎩
C(j,k1)
∗
=R∗sinϕcosθ
C(j,k2)
∗
=R∗sinϕsinθ
C(j,k3)
∗
=R∗cosϕ
(31)
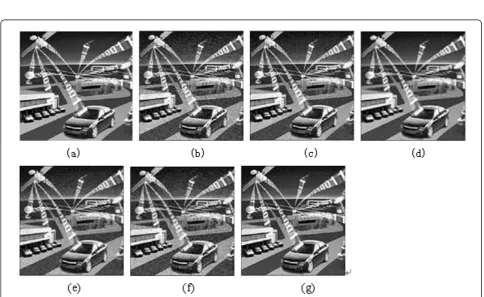
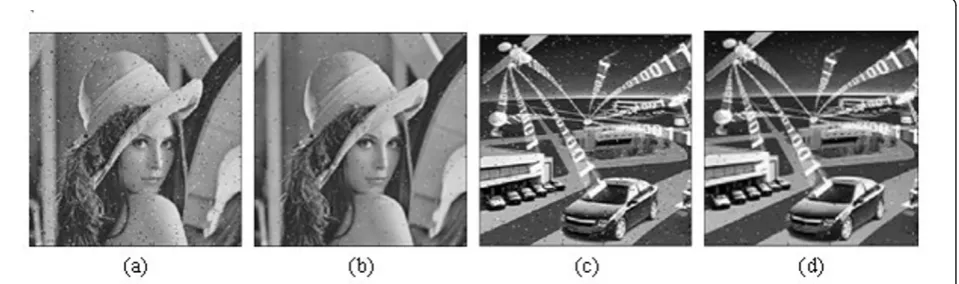
Figure 4Image lena and experimental results.(a)Original image lena.(b)Gaussian white noising image.(c)Hyperbolic shrinkage in [15].(d)
MATS method in [14].(e)Improved soft-threshold in [16].(f)AdpMpMHard in [18].(g)This article.
Figure 5Image IOT and experimental results.(a)Original image IOT.(b)Gaussian white noising image.(c)Hyperbolic shrinkage in [15].(d)
where C(j,k1)
∗
, C(j,k2)
∗
, C(j,k3)
∗
are estimated
hori-zontal high frequency, vertical high frequency, and diag-onal high frequency, respectively.
Step 7. Finally, to realize de-noising and reconstruct the image.
8. Experiments
To illustrate the effectiveness of this improved method, experimentation is done to use the image lena and the Internet of things (IOT) which sizes are 256*256.
8.1. The evaluation criteria
This article evaluates the de-noising effect from the peak signal-to-noise ratio (PSNR), mean square error (MSE), and the runtime.
PSNR = 10 log 10(255∧2MSE) (32)
MSE = 1
MN
M−1
i=0 N−1
j=0
fi,j∗−fi,j
(33)
8.2. The choice of decomposition level
First, we must determine the decomposition levels. Table 1 shows the de-noising effects evaluation of differ-ent decomposing level. In this simulation experimdiffer-enta- experimenta-tion, the improved algorithm is used for image de-noising and Gaussian white noise (the standard devia-tion is 20) is added to image lena and IOT.
From Table 1, we can get the conclusion that the de-noising effect is asymptotically stable after three levels. When the scale is greater than six levels, turbulence will generate in PSNR and MSE. Therefore, the best decom-position level is 3-5.
8.3. The de-noising results adding Gaussian white noise
According to the above assessment, level 4 is an ideal decomposition level. Here, level = 4, adding the Gaus-sian white noise (the standard deviation is 20). The de-noising results of different methods are shown in Fig-ures 4 and 5. Figure 4 shows the visual results of image lena. Figure 5 shows the visual results of image IOT. The results show that this proposed algorithm visually superior to other algorithms.
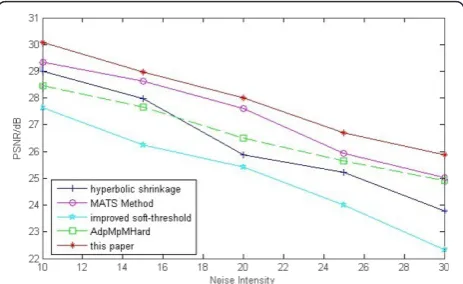
Figures 6 and 7 show the comparison of PSNR for kinds of de-noising methods to images lena and IOT. Figures 8 and 9 show the comparison of MSE for kinds of de-noising methods to images lena and IOT. From the comparisons of PSNR and MSE, we can get the con-clusion that the proposed algorithm in this article has better de-noising effect.
8.4. The comparison of running time
Figure 10 demonstrates the run time of different de-noising methods. It shows that the proposed algorithm retains the advantages of spherical coordinate system.
Figure 6Comparison of PSNR for kinds of de-noising methods
to Gaussian white noising image lena.
Figure 7Comparison of PSNR for kinds of de-noising methods
to Gaussian white noising image IOT.
Figure 8Comparison of MSE for kinds of de-noising methods
The running time is less than other algorithms. With the scale increase, this advantage is more obvious.
8.5. The de-noising results adding salt&pepper noise
Gaussian white noise and salt&pepper noise are the most common types of noise. Figure 11 shows the visual
de-noising results added in the salt&pepper noise. According to Figure 11, the proposed method is also effective to salt&pepper noising image.
Figures 12 and 13 demonstrate the comparison of PSNR for kinds of de-noising methods to salt&pepper noising images lena and IOT. Compared with other
Figure 9Comparison of MSE for kinds of de-noising methods
to Gaussian white noising image IOT.
Figure 10 Run time evaluation for kinds of de-noising
methods.
Figure 11Salt&pepper noising image and experimental results.(a)Salt&pepper noising image lena.(b)De-noising result of this paper.(c)
Salt&pepper noising image IOT.(d)De-noising result of this article.
Figure 12 Comparison of PSNR for kinds of de-noising methods to salt&pepper noising image lena.
algorithms, the de-noising results of proposed method have more advantages after adding salt&pepper noise.
9. Conclusion
In this article, we use spherical coordinates system to remove the relevance of coefficients. Based on the Besov space norm theory, this article derives a new threshold in spherical coordinate system. MSNP is defined to make full use of the correlation in different decomposi-tion scales. A new adaptive curve shrinkage funcdecomposi-tion is constructed. This function can reach and exceed the true value. It largely avoids the edge blurry during image de-noising. The new threshold controls MSNP for image de-noising. Experimental results show that the proposed method visually superiors to other algorithms, and it is more effective in PSNR, MSE, and runtime.
Acknowledgements
This study was supported by the National Natural Science Foundation of China (Nos. 61170173, 60773073, and 61001174), the Program for New Century Excellent Talents in University of China (No. NCET-09-0895), the Key project of Ministry of Education of China (No. 208010), and the Tianjin Natural Science Foundation (No. 10JCYBJC00500).
Author details 1
Key Laboratory of Computer Vision and System, Tianjin University of Technology, Ministry of Education, Tianjin 300384, China2Tianjin Key
Laboratory of Intelligent Computing & Novel Software Technology, Tianjin University of Technology, Tianjin 300384, China
Competing interests
The authors declare that they have no competing interests.
Received: 28 December 2011 Accepted: 16 May 2012 Published: 16 May 2012
References
1. M Frandes, I Magnin, R Prost, Wavelet thresholding-based denoising method of list-mode MLEM algorithm for compton imaging. IEEE Trans Nuclear Sci.58(3 Part 1), 714–723 (2011)
2. HO Yacov, D Shaked, A discriminative approach for wavelet denoising. IEEE Trans Image Process.17(4), 443–457 (2008)
3. G Chen, S Qian, Denoising of hyper spectral imagery using principal component analysis and wavelet shrinkage. IEEE Trans Geosci Remote Sens.
49(3), 973–980 (2011)
4. D Zhang, A new approach and system for attentive mobile learning based on seamless migration. Appl Intell.36(1), 75–89 (2012)
5. H Yu, L Zhao, H Wang, Image denoising using trivariate shrinkage filter in the wavelet domain and joint bilateral filter in the spatial domain. IEEE Trans Image Process.18(10), 2364–2369 (2009)
6. D Zhou, Q Wang, Q Tian, Q Lin, W Fu, Wavelet analysis and its application in denoising the spectrum of hyperspectral image. Spectrosc Spectral Anal.
29(7), 1941–1945 (2009)
7. S Parrilli, M Poderico, CV Angelino, L Verdoliva, A nonlocal SAR image denoising algorithm based on LLMMSE wavelet shrinkage. IEEE Trans Geosci Remote Sensing.50(2), 606–616 (2012)
8. D Zhang, X Zhang, A new service-aware computing approach for mobile application with uncertainty. Appl Math Inf Sci.6(1), 9–21 (2012) 9. DL Donoho, Denoising by soft-thresholding. IEEE Trans Inf Theory.41(3),
613–627 (1995)
10. DL Donoho, IM Johnstone, Ideal spatial adaptation via wavelet shrinkage. Biometrika.81, 425–455 (1994)
11. RA DeVore,Nonlinear Approximation, (Cambridge University Press, London, 1998), pp. 51–150
12. X Feng, D Jiang, G Xu, Combining variation and wavelet transform for image zooming. Chin J Comput.31(2), 340–345 (2008)
13. A Chambolle, R DeVore, N Lee, B Lucier, Nonlinear wavelet image processing: variational problems, compression, and noise removal through wavelet shrinkage. IEEE Trans Image Process.7(3), 319–335 (1998) 14. A Khare, US Tiwary, W Pedrycz, M Jeon, Multilevel adaptive thresholding
and shrinkage technique for denoising using Daubechies complex wavelet transform. Imag Sci J.58(6), 340–358 (2010)
15. S Wang, Y Zhou, D Zou, Nonlinear wavelet image compression coding algorithms based on spherical coordinates. J Infrared Millimet Waves.20(5), 387–390 (2001)
16. C Li, J Sun, Y Kang, Adaptive image denoising by a new thresholding function. WiCOM.5600682, 1(1), 1–5 (2010)
17. P Bao, L Zhang, Noise reduction for magnetic resonance images via adaptive multiscale products thresholding. IEEE Trans Med Imag.22(9), 1089–1099 (2003)
18. J Meng, Q Pan, H Zhang, Optimal threshold determination for multiscale product in wavelet denoising. ISCIT.1566924, 1(1), 570–573 (2005) 19. J Skowronski, A nonlinear transform for subband image coding. Signal
Process.77, 289–307 (1999)
doi:10.1186/1687-6180-2012-110
Cite this article as:Zhanget al.:A novel image de-noising method based on spherical coordinates system.EURASIP Journal on Advances in
Signal Processing20122012:110.
Submit your manuscript to a
journal and benefi t from:
7Convenient online submission
7Rigorous peer review
7Immediate publication on acceptance
7Open access: articles freely available online
7High visibility within the fi eld
7Retaining the copyright to your article