I11 :Partial li'ulfillment of the
Requirements !or the De&Tee of
Doctor of Philosopliy
Oalif ornia Institute of Technology
Pasadena, California
General Introduction
Phase Eq1.:«i1i1Jria L:i U;rd.rocn:rlion Systems
r.
.W.et:1:idE. a.!~d A.:p1.1ct:..·a·cusc:..:' t:ie Yi scosi t:;r o:f' 'Jas Sat1ll'ated Liquids
The Der;e:rr:,Lwti~Jr. or the r~1l·ki:r::w.1 Prc11ci:die:a a~id tr1e
P:.·oss·u:r·e-Vol Utae-'.:'e.'JJJe:~3.\,1U'e Re lat i o:.1s .:;i:f Hydro car non
1
2
Sy st e~nrn
3
Ph~rne 'l<Jqni 1Hi:ria in Hydrocarbon Systems
II~ The Metr~ana.-P:ro:pane System 4
T:C1e l?ressixre-Vo::1:wae-'.:1e:,;pe:rat·w·e .ctehttions and the
General Introduction
The work reported in this thesis was carried out during the
last three years at the Oa.lifornia. Institute of 1'echnology as part 0£ Research Project
37
of the .American Petroleum Institute. The generalpurpose of the investigation is the study of the fundamental properties
of hydrocArbon mixtures which control their retention in underground f orma.t ions.
The work of earlier investigators had indicated that rather
large challges in the physical properties from those observed at
atmos-pheric pressure took place when natural hydrocarbon mixtures were at
equ.ilibrit1111 under the pressures and temperatures found in ~ natural reservoirs. As the physical properties such as viscosity, density, etc.
have a large effect on the retention of the oil in a natural reservoir,
.• a st~ 0£ the more important o:f them was undertaken by the .American Petrole'Ull\ Institute. The work of Project
37
has been restricted tomeasm·ements o:f the composition, rate of solution. density, change in
volume, specific heat. viscosity of :hydrocarbon mixtures as a function
of pressure and temperature. The derived thermal properties are of
in-terest in the determination of the available energy of a natural
reservoir.
The work reported in this thesis consists of a description of
the apparatus used in the general study of the physical properties ot
hydrocarbon mixtures under equilibrium conditions, and of complete
equilibri'um data on the system composed of methane and propane, and of complete pressure-volume-temperature end thermal data on p'llre propane.
Both studies covered most of the pressure and temperature ranges
Reprinted from
INDUISTIUAL AND ENGINEERING CHEMISTRY
Vol. 26, Page 103, January, 1934
Phase Equilibria in Hydrocarbon Systems
I.
Methods and Apparatus
BRUCE H. SAGE AND WILLIAM N. LACEY, California Institute of Technology, Pasadena, Calif.
A
KNOWLEDGE of theueluwior of uompfox
hy-drocarbon systems under equilibrium conditions corre-sponding to those found in under-ground petroleum reservoirs is of primary importance to the petroleum production technolo-gist. The simpler examples of such systems are also of interest from the purely scientific point of view.
Apparatus and methods for studies of phase equilibria in hydrocarbon mixtures at pressures up to 200 atmospheres in the temperature range from 20° to 100° C. are described. The data
ob-tained permit the prediction of the density, com-position, and relative mass of each phase present when a mixture of any total composition is brought to equilibrium at any set of temperature and pres-sure conditions within the range studied. Subse-quent articles of this series will present data for both simple and complex mixtures.
MEASUREMENT OF ENTERING MATERIALS
Relatively nonvolatile liquids were measured by weighing a suitable container before and after pouring the sample into the equilibrium vessel. The latter was then closed and con-nected for use. If the liquid was a pure substance of volatile character, a portion of it was distilled into the equilibrium vessel from a weighed con-The aim of this work was to
follow the behavior of gaseous and liquid phases present in
equilibrium at temperatures ranging from 20° to 100° C.
(fiS ° F. to 212 ° F .) anrl a.t prp,s;;urp,s from 1 to 200 11.t.mm1pheres
(approximately 15 to 3000 pounds per square inch absolute).
In order to ascertain completely the state of the system, measurements of the density, volume, and composition of each
of the phases present were required. Those measurements
were made over a series of temperatures, pressures, and total compositions in order that the effect of these variables might be determined.
tainer. Volatile complex liquids were cooled to a sufficiently low temperature to be handled
by the method used for nonvolatile liquids.
The equilibrium
method used in this work resolved itself into the following steps: the measure. ment of the amount of an original liquid phase placed in an equilibrium vessel, the measurement of a series of quantities of gaseous material and their quantita-tive compression into the equilib-rium vessel, the attainment of equilibrium, and the determination
of the state of the
system .after each addition of ma-terial.
Gases entering the system were measured by withdrawing from a calibrated reservoir of constant volume and noting the resulting drop in pressure. The sample bomb containing
the gas supply was heated in a diethylene glycol bath to a.
sufficiently high temperature to insure complete vaporiza-tion. That the temperature used was high enough could be
FIGURE 1. COMPRESSOR AND CONTROL PANEL
verified by
deter-mination uf the dew
point of the gas at the pressure exist-ing in the sample bomb, as described below. The gas was then admitted, through heated tub-ing lines, to the reservoir bomb in a diethylene glycol bath carefully ther-mostated at 100.0° C. The reservoir was so calibrated that the quantity of gas in it was known for any given pres-sure up to a
maxi-mum of about 20
atmospheres. The calibration was made for each gas
FIGURE 2. EQUILIBRIUM CELL
pressure, drawing off succes-sive portions of gas into a mercurY buret for measuring the volume at atmospheric pressures, and noting after each withdrawal the pressure
in the reservoir. 'l'hA hnrAt.
was located in an air bath maintatned at 40.0° C. (104.0° F.) by a thermostat control. The density of the gas was measured by means of an Edwards gas density balance placed in the same air bath. Having obtained this calibration, the mass of gas withdrawn from the reservoir for use in the equi-librium system could be deter-mined from the reservoir pressure reading before and n.fter withdrawal
The gas pressure in the reservoir was measured by a fluid pressure scale connected
to tho reservoir by an
oil-filled tube. The gas was kept from contact with this oil by interposing a mercury U-tube. The volume of the reservoir was kept constant within0.005ml. (ina total volume of 175ml.) by forcing in or withdrawing oil from the connecting tube with a screw plunger, the correct volume being indicated by the flash of a signal lamp operated through a pointed contact just above the mercury surface on the oil side of the U-tube. A shut-off valve was installed in the bottom of the U in order that the reservoir might be evacuated without disturbing the pressure-measuring system. The fluid pressure scale used was a modified Crosby instrument having a range from atmospheric pressure to 300 pounds per square inch (20 atmospheres), readings being reproducible to 0.1 pound per square inch.
This method of gas moasurement was successfully used
for gases ranging in composition from methane to untreated natural gas from the well. The variation of different calibra-tions for the same gas was less than 0.2 per cent. The
reser-voir Wal!! all!!o Ul!!eful fur ueterruiuaLiuu uf eompressibility
factors of gases at pressures up to 200 atmospheres, by the
method developed at the U.S. Bureau of Standarqs.1
COMPRESSION OF GASES
The gases used were measured at relatively low pressures (below 20 atmospheres) to avoid partial condensation. After measurement it was necessary to compress the measured samples quantitatively into the equilibrium vessel without contamination or absorption by such materials as lubricants. The equipment used was a compressor in the form of a steel
buret provided with gas inlet and outlet valves at the bottom.
The measured quantity of gas was drawn in from the reservoir. Mercury was then forced into the compressor by a steam-driven plunger pump. When· the gas in the top of the
com-presisor was compre15sed to a preisisure exceeding that in the
equilibrium cells, the gas outlet valve was opened and the gas forced into the cell. The level of the mercury was followed in the lower part of the buret by signal lights con-nected to insulated contacts in the wall of the compressor. To secure a minimum clearance volume (1.5 ml. in a total volume of 1500 ml.), the upper part of the compressor was
constricted to about 4.8 mm. in diameter. In this tube
•Bean, H. S., Bur. Standards J. Researck, 4, 645-61 (1930).
the tube, the resistance between the upper end of the carbon
rod and the mercury ·was reduced. A bridge circuit, one
arm of which was the carbon rod, enabled one to follow the level of the mercury in the tube. This made it possible for the operator to make the stroke of the pump accurately reproducible. The gas inlet and outlet valves were integral
wit.h t.hP. nppAr P.nd of t.hP. t.ube.
As there was possibility of partial liquefaction of the gases
if the compression were done at room temperature, the entire
compressor was electrically thermostated at 100° C. A photograph of the compressor and the accompanying control panel is shown in Figure 1. The apparatus was always so operated that the pressures were kept well below the dew point of the gas in the pump at the time. By care in this regard the possibility of condensation in the compressor was avoided. For the Same reason the lines connecting the compressor with the reservoir and with the equilibrium cell were electrically heated to 100° C. Their temperature was measured by small thermocouples soldered to the lines.
EQUILIBRIUM CELL
Equilibrium was attained in a steel bomb (Figure 2) whose inside diameter was 2 inches (5.08 cm.), with an inside depth of 2.5 inches (6.35 cm.). The top was bolted to the body of the cell, a soft metal gasket being used to make a tight joint.
Relatively nonvolatile liquids were placed in the bomb before
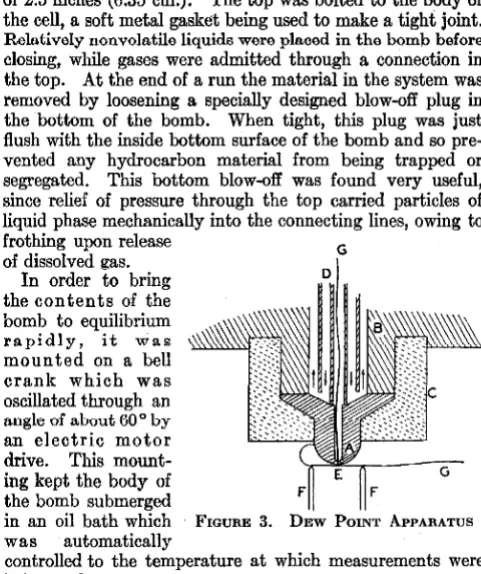
closing, while gases were admitted through a connection in the top. At the end of a run the material in the system was removed by loosening a specially designed blow-off plug in the bottom of the bomb. When tight, this plug was just flush with the inside bottom surface of the bomb and so pre-vented any hydrocarbon material from being trapped or segregated. This bottom blow-off was found very useful, since relief of pressure through the top carried particles of liquid phase mechanically into the connecting lines, owing to
frothing upon release G
of dissolved e:as. In order to bring the contents of the bomb to equilibrium
rapidly, it was
mounted on a bell crank which was oscillated through an
angle of about 60° by
an electric motor drive. This mount-ing kept the body of the bomb submerged
D
G
in an oil bath which FmuRE 3. DEw PmNT APPARATUS
was automatically
controlled to the temperature at which measurements were being made.
Since the inside of the bomb was made a!Jcurately cylindri-cal, a measurement of the height of liquid at any time when
the bomb wn.!'t in 11. vmf.tP.A.I poRition gn.ve n. mAmmre of the volume of the liquid phase. To measure the position of the liquid surface, a short piece of 1.5-mil platinum-iridium wire was mounted at right angles to the axis of the cylindrical
bomb on two needle points on tho end of a mioromotor screw.
An electrical connection from one end of the wire was brought
out of the bomb through an insulating sleeve in the microme-ter screw. The other end of the small wire was grounded to
the bomb. During operation a small current (200
milli-amperes) was passed through this wire, raising its temperature
slightly above that of its surroundings. If the micrometer
resist-January, 1934 INDUSTRIAL AND ENGINEERING CHEMISTRY 105
ance was suddenly changed. The resistance of the small
wire1 alj in(iire,etly ~easured by a simple potentiometer
circilitr ~a-ve a sttltable indication of this change, and thus the poRition of. the liq~id surface could be acc1;11'ately located, a;nd · · a reading of the nncrometer made. Readmgs of the position
of the liquid surface were easily reproducible to 0.001 inch (0.0254 mm.) by this method.
Pressures within the equilibrium cell were measured by means of another fluid pressure scale whose range was from atmospheric pressure to 3000 pounds per square inch (ap-proximately 200 atmospheres), readings being reproducible to
one poµnd per square inch. T~ scale was connected to the
equilibrium system by an oil-filled line and mercury U-tube similar to that of the reservoir system described. The cali-. · ·· bration of the fluid pressure scale was checked by comparison
with the vavur vreissures of pure carbon dioxide and pure
pr-0pane at known temperatures.
Since some of the gas measured and compressed into the equilibrium system did not pass into the equilibrium cell, it was necessary to know the amount of gas required to fill
the connecting lines and the gas side of the mercury U-tube to any pressure within the working range. This portion of the system was always maintained at 100.0° C. to avoid con-densation therein. The determination of this correction, to be deducted from the amount of gas in the system, was made directly by compressing known amounts of the gas in
que~t.ion into the lines, with the valve at the entrance to the equilibrium bomb closed, and measuring the pressures. This correction amounted to about 10 per cent of the total quantity of gas measured but could be determined with good accuracy.
DEW POINT APPARATUS
Dew point determinations furnish information which is useful in locating buumlary cundiLiurns ucLween Lhe une- and two-phase portions of these equilibrium ·diagrams. The apparatus used for such determinations consisted of a pres-sure cell built into a steel block whose temperature was ther-mostatically controlled. The essential features of this apparatus are shown in Figure 3. A hemispherical copper
tip, A, 3 mm. in radius, was supported from the steel cell top,
D
A
E-CJ
F
FIGURE 4. ELEVATION AND PLAN
OF GAS DENSITY BALANCE
A. Copper plummet containing mov-able solenoid
~: ~f~:i~~: ~~'!,~met D. Stationary solenoid
E. Contact point
F. Mercury cup
G. Torsion suspension
B, and the supporting
parts were covered by the heat-insulating shell,
C. This tip was kept at
constant temperature by circulating ther-mostated oil in contact with its upper surface through the concentric
tubing lines, D. The
walls of the cell were held at a so mew hat
higher temperature (3 °
to 4° C. higher) in order to prevent condensation on them. Approxi-mately 0.1 mm. below the copper tip was sup-ported upon the electri-cally insulated points, F,
a copper-constantan · thermocouple, E, of No. 40 B & S gage wire. This junction was prepared by carefully silver-soldering the wires exactly end-to-end in a hydrogen atmosphere. Another couple was located just inside the surface of the tip. Since the sus-pended junction was at a slightly higher temperature than the cooled tip, the difference in temperature could be in-dicated by including both couples through the leads, G, in a
closed circuit with a sensitive
galva-nometer. The
actual tempera-ture of the copper tip was measured by the internal couple and a po-tentiometer.
The dew point determination was made by slowly compressing the gas sample into the cell until a
11mall amount or' liquid formed on the copper tip thus bridging between the tip and the suspended couple and decreasing the temperature
difference
be-tween them. This
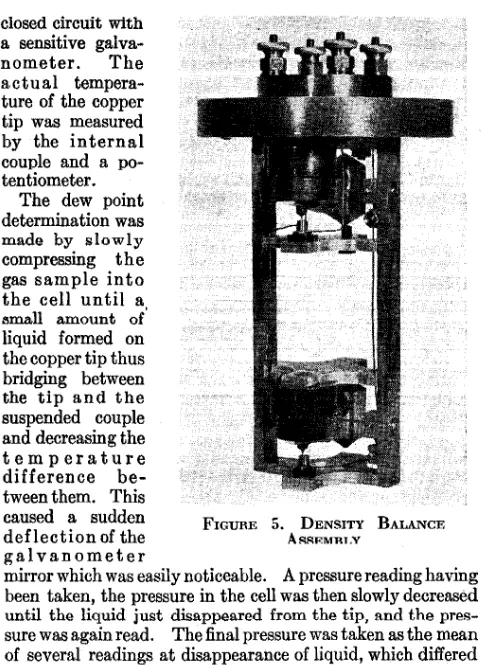
caused a sudden FIGURE 5. DENSITY BALANCE
deflection of the ARRl<MRLY
galvanometer
mirror which was easily noticeable. A pressure reading having been taken, the pressure in the cell was then slowly decreased until the liquid just disappeared from the tip, and the pres-sure was again read. The final prespres-sure was taken as the mean of several readings at disappearance of liquid, which differed ordinarily by only about 1 pound per square inch or about 0.1 atmo:sphere from the pre11sure at which liquid formed.
DENSITY APPARATUS
In the study of complex mixtures, such as those found in petroleum pools, two phases are almost always present, and measurements with the equilibrium cell and dew point apparatus are not sufficient to determine fully the state of the system. This necessitates direct measurement of the density of each of the phases.
A type of density balance was developed for the measure-ment of both gas and liquid densities at equilibrium pressures up to 200 atmospheres. Two schematic views are shown in Figure 4. The aluminum beam (8 cm. in length) carries on one end an aluminum plummet and on the other a copper
plummet. As the volumes of the plummets are unequal,
the masses being approximately equal, the force required to keep the beam in balance is a function of the density of the fluid in which the balance is immersed. This restoring force was supplied by two repelling solenoids, one of which was placed within the copper plummet and the other mounted directly above it in a stationary copper housing. A measure-ment of the current flowing through the two coils in series when they held the beam in balance gave an indication of the density of the fluids. The beam was supported by a light steel torsion mounting, the two members of which also served as electrical leads to the movable solenoid. The position of balance was indicated by the flash of a signal lamp connected in series with the platinum contact point and the mercury surface in the cup. The current (100 to 300 milli-amperes) flowing through the coils was determined by means of a potentiometer which measured the voltage drop across a standard resistance placed in the circuit.
gal agitator was provided in the bottom of the pressure cell to secure equilibrium between the two phases. The entire cell was immersed in an oil bath whose temperature was care-fully regulated. The equilibrium pressure was measured by a fluid pressure scale connected to the inlet line by a mercury U-tube trap similar to those previously described.
Since the relation between the flow of current through the coils and the density of the fluid was somewhat complicated, the balances were directly calibrated by immersing them in
...
0!;! ~ 220 c :::; ;,l 0
,
..
... I'-, r---.. .... ..,~ ~f'-.
101) 200 300 DENsm, GRAM$ PU LITER
l"o...
liquids and gases of known densities and measuring the current required to bring the beams into
bo1ti,noo. A sample
calibration curve of the gas density balance is shown in FIGURE 6. DENSITY BALANCE CALI- Figure 6. Fur this BRATION CunvE calibration carbon dioxide under vary-ing pressures was used, the density of carbon dioxide bevary-ing determined by measuring its compressibility under the same conditions of temperature and pressure as those at which the balance was calibrated.
APPLICATION TO COMPLEX MIXTURES
When studying a complex mixture of crude oil and natural gas, the oil was weighed into the equilibrium cell and its
volume and vapor pressure wore measured at tho desired
temperature. A measured quantity of natural gas was then admitted from the reservoir through the compressor. The equilibrium cell was agitated until the pressure remained constant. After each ·addition of gas the equilibrium pres-sure and the volume of the liquid phase were meapres-sured. The additions of gas were continued until the maximum de-sired saturation pressure had been reached. From these data were obtained the total mass of material and the volume of each phase, but the densities and the compositions were still undetermined. The densities of the two phases were deter-mined by carrying out measurements ·under identical condi-tions of temperature and initial concentration of oil in the density balance apparatus. The mass present in each phase could then be calculated from its volume and density.
Since the exact compositions of the crude oils themselves would be very difficult to determine, no attempt was made to ascertain the composition of the liquid phase. The com-position of the natural gas used was determined by
low-temperature fractionation analysis. By careful
manipula-tion to take advantage of the strong tendency for these hydro-carbon solutions to supersaturate, equilibrium gas samples could be withdrawn. The removal of such a sample neces-sarily terminated that particular experiment. In this way it was possible to account for the transfer of the more volatile constituents between the phases present.
If the assumption was made that the compressibility of the equilibrium gas phase was substantially the same as that of
solubility of the original gas in the original liquid at various temperatures and pressures could be determined by measure-ments with the equilibrium cell. This assumption would be most nearly valid at lower temperatures, at lower pressures, and with natural gases containing less of the easily conden-sable constituents. In these complex hydrocarbon mixtures the solubility of the gas in the liquid loses its exact significance, since the process occurring when the two are brought to equilibrium consists of a partial transfer of constituents from each phase to the other.
APPLICATION TO SIMPLE MlxTURES
Simple hydrocarbon systems containing only two or three constituent substances may be studied with more precision, and a more complete picture of their behavior can be obtained. Such studies, therefore, offer an effective method of determin-ing the fundamental behavior of hydrocarbons in mixtures, thus paving the way to more exact studies of the complex mixtures.
In the case of two-component systems, the entire amount of the less volatile component was admitted first to the
equilibrium cell hy t.he met.hod heRt. Rnit,ed t.o its volat.ilit.y.
The volume of the liquid phase, if any existed, was· then measured. The more volatile component was measured into the equilibrium cell in a series of additions, the resulting
equilibrium pressure and liquid volume being · determined
after each addition, until the pressure reached the working maximum of the apparatus. A series of determinations of this type was made at constant temperature but with sys-tematically varied amounts of the le~s volatile cumpunenL initially added. The work was then repeated at different temperatures. It was impossible to obtain precise data in the. condensed portions of the system at compositions ap-proaching that of the less volatile component, as the cell was completely full Of liquid and the attainment of equilibrium doubtful. The relations between composition, temperature, and pressure for the saturated gas were determined by use of the dew point apparatus. From these data and those from the equilibrium cell, the composition and density of the liquid phase and the density of the gas phase were obtained. The
density and P.ompressibilit.y when only one ph11.se was preRent
were determined from the equilibrium cell measurements.
ACKNOWLEDGMENT
Financial assistance in the development of the apparatus and methods described has been received partly from a fund made available to the American Petroleum Institute by John D. Rockefeller and the Universal Oil Products Company aJJ.d partly from the American Petroleum Institute.
Members of the Fred C. Henson Company, instrument makers, have shown the authors many helpful courtesies during the design and construction of the apparatus. Charles D. Kircher, Jr., and Jan G. Schaafsma have assisted in the installation and testing of the equipment.
RECEIVED August 25, 1933. The data presented in. this paper represent work done under Research Project 37 of the American Petroleum Institute.
PH.ASE EQUILIBRIA IN HYDROCARBON SYSTEMS METHODS AND .APPARATUS
I ul. ;,, l'.111·~ :!Iii, .111/y J.'1, W:J:J
Measure1I1ent of
cosities
<)f
Lic1
u:ids
Satt1-rated
·with
C~ases
at
Higl1
l_)ressures
HHuci,: H. f.hGI!], California .lm;titule uf Tn.:bwilogy, Pasadena, Calif.
T
H.E iutereot of the 11etrnleum iJHlu~try in increasing theyield of crude oil from producing formations has
caui:ied rnuch tliought to lie ginm to tlie factors
controlling it,; reconry. One of tlie IJJo~t iH1Jiorta11t <Ji tl1e;;e 'tJJpears 1•1 lie the JH'opertie;; uf tlw •1il ibelf. J'n:\·iuu,;
iH-vestigator;; found that dis,solving natural gas iu crude oil
FIGUI\E 1. DL~ORAlll OF BALL AND
TUBg
had a surprisfog effect on many of its phyi;ieal properties.
A general study of thmm d1angflH Wll" 11ndPrf:1kPn 11t. tloe California Institute a::: He8earch Project 37 of the American Petroleum Institute. This paper describes the viscometer developed for the ~tudy of the effect of dissolved gas on the
vfaco~ity of crude oik
In order to duplicate in 6ome measure the range of
condi-tions fouud in petroleum formation:;;, saturation pressures
up to 200 atmos1>heres (2940 pounds per square inch) and
temperatures ranging from 20° to 95° C. (70° to 200° F.)
mu:;t lJe attained. The work of other investigator,; (1 ), at
lower pressures, indicated that the change in vi8co.sity of the
oil would be very large at saturation pressures of 200
Jm?a::'lfff? :weuratcly .t \\itle rang;e of \ ioeo,.itieo 11itlmut re-1111iring intermediate alterat forns or readjust men ts. There are
,,c1 \!l'iil utl1er require111enls \d1id1 lliUtt be nid by ;m
iu~tJ'U-1rn:1Jt. '"1it<1l1lu fm· tJ,b "tudy. 8v11Jt: Ilh:·>ll~ niq,:it h: 11ro•.idt:d
for c:sta bli•hing cqnilibrium between the ga~ and oil '\\ it!Jin a
rca~onable time. The imtrumcmt should lie of tiud1 a nature
tlwt it.~ caliliraliou io indtJH!Wlt·JJt of proc~Ul·e. There i~i abo
ilced tor JJh::H1' uf 111e:1.,;uring tlw ::;aturatiuJJ Jll'l:::>bl!I'e awl uf hi tiutaiuing tbto t1:u1perc1t1uc ut tliu 'iouJIHCter t:uJJ::lcu,t
duriHt; a given set uf llleasurements.
!'HJf,l'Jl'J.B llTJJ.JZt:U
TVBt:'
\
r \\.. CONTM! __ h
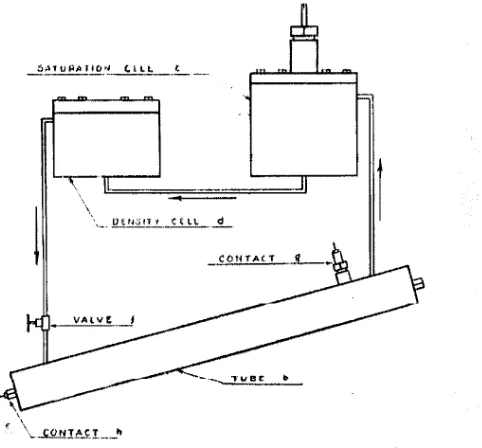
Fu;uRE 2. .DuuRAM OF VtscoSTTY-MEASURJNG APPARATUS
the needs of thi:; work was a modified form of the viscometer
developed by Flowers (;J) aud Hersey (4). The ~ketch in
Figure l illui:;trate;i the principle of the intitrument. The ball
a fa at tile upper end of the closed, liquid-filled tube b. As
tlic ball lllO\Cti dowu tlie tulie (probably by both rolling and
~liding), tlie di;placed liquid mutit lluw paet it through the
space between the hall and the tube. For any given uall
"ith the tube held at a constant angle, the trarnl time of the
hall 111ulliplied by the difference lietwecn the density of the
li:i II am) that of the liquid is a linear function of the absolute
,-i:ot'.l):'ity nf the liquid. This linear f1rncti1m break,; down, however, if the rah: of JJJ<.1Yellle11t of the ball is ~o great tlia t I he fluw hecurnes turbulent. .
above principle. In order thst equilibriurn l1el.11t·eJi tlw g:1,
:md oil may be reached, n dched 1·irc11Jati11g Fy,;t.ern is J!l'U\ ided
TJw liquid H.,w,; from th., Hatu1·td.i<11t oell <1 t.o tho •kn,;Jt,~
HH;:Jsurin;i, l1olllli rl, UJt'lh:e Iii the IJfJttom oJ tlie int:liHnl
tube b iJl' the ds1:urndcr jt,;,elf, retumiJJg from tlie top of U1e tlll11i to Lhe ga;i :ijl:ti;e 11! tlw ,;:tlllt:1lioll c1:ll :\. ,,,11,111 1;aJJJ JHWIJJ in the liottoJJJ of th,; ."i.iiuratio11 ecJJ tin:ubtt·~ the "il througJ1 the sy~l.ern a,; desired. A pl1ot.ogr:1Jih of ilte
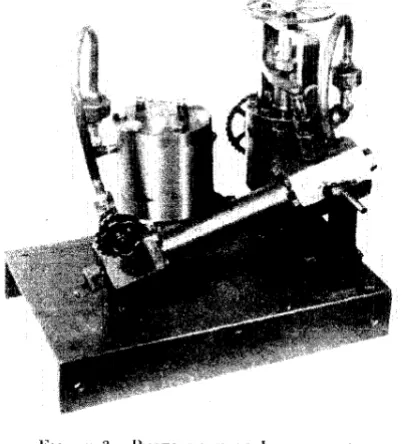
:wtual instrument is s}1own in l:t'igurc lt
The entire system, except the upper fmrt uf the satw·atiuu
FlGbllE 3. PHOTOUH\Pll OF 1NSTllUAJENT
cell, i;:; lilJcd with the oil sawple, tlw syRtern lidng so ana11g(•d that any entrapped ga.,; h; ~Wl'jlt 1JUt upon circ11lati1m. Liquid
is 1mmped t,Jirough I.lie ~ystt)IJJ after t!Jermal equililiriwn i~ attained, tlw ball being forced to the upper end of tlie tul1t· b
above the outlet tube. When drculatioll i,; stopped, the liall is allowed to move ptirt way tlow11 the tube. The upper
contact iJ is then screwed down u small amouJJi, and the
circulation again started. Thn liall, moving up I.hie tuliP.,
now wedge,; itself against the lowered coutact, aud is in
jJosition to start a measurement. Tliis pr()cedure of 11 edg,iug the ball from below the contact gives a sharper and uwn! rep1·odueihle rnfoas0 upon rui~i11g tho coutaot than h; tho ea~•l with the l 1all above. The ,valve f at the lower end of the
ball tube is now closed and the contact lifted, startil)g the
ball the tube. The break in contact is recorded on I\
chronogravli. When the hall f,ouches the lower contact h,
another mark is made on the chronograph record. The
f is again opened, circulation reestablished, and the measure· nlCHt repeat<:'d often
as
deBfred, is admitted totho top of the £atun1lfon eoll and mainblirwd
until the attaiurnent of equilibrium i8 indicated
of pressure reading. A new set of hall times is <letmw1111!:'1l
al:i before, more g:1s i;; then admitted, and the measurements
are iept:;;<ted at the 1esulting satur:ition pres:>ure.
This proces:i is continued until the pl'essure approaches the upper limit of 200 atmospheres (2940 pounds per square iuch).
A series of determinations of this nature involving
meas-uremerits at ten ditierent pressures requires in the
neigh-borhood of two hours after the initial thermal equilihrium has been reached.
2eoo II\
"'
"'
52400 ~
-i--r--T ROll -i--r--TIME IN SECONDS l··----1---·
f;l DENSITY Of BALl
P O~NSIT!._ OF LIQUID+-+---",~--•·~-+--<
~ 20001----t---+~ ,..
t: 16001----1--+---·+·~+
"'
8 !!)1200
>
"'
I- 6001--·--"1-·---+-:.&'-t-·-~+
::>
a
:a <
4000 6000
T(f;l-P)
FrnmtE 4. CAUBRA'l'ION C\mvEs FOR Two BA1.ts
The density of the liquid is measured in the density bomb
at oaoh of the outw·ation pressures by mcunri of a small torsion
mounted balance. Since the two ends of the beam are con-structed of materials of different density, the volume dis-placed is different and the force required to bring the beam iuto lmlauce lt> a furwtlon of the density of the liquid in which it is immersed. This force is supplied by two solenoid coil,;, one mounted on the beam, and the other held in a fixed position. When current is passed through the coils a
re-pelling force is exerted between them. By measuring the
current flowing through the coils when the beam is in bal· ance, a measure of the density of the liquid in which the beam is immersed is ohtained. The instrument is calibrated
by immersing it in a series of liquids of known density.
The saturation pressures am measured by means of a fluid pressure scale connected to the gas space of the system
determined value by means of an oil bath controlled by a
mercury regulator. The temperature of the bath can be
varied between 20° and 95° C. (70° and 200° F.); the
maximum variation from the desired temperature during a run is about
o.oa°
C. (0.05° F.).CALIBHATION
The viscometer is calibrated by measuring the roll time at
aLmo;,;phl:lric JJrei:;i:;uni for liquitb uf known viscosity. The
liquids used in this work were standardized by the Bureau of Standards. The viscosities of these liquids were known at several temperatures, so that the effect of temperature on the calibration of the instrument could be determined.
Figure 4 shows calibration curves for two balls of slightly different sizes. The curves arc straight lines over Lhe greater
•
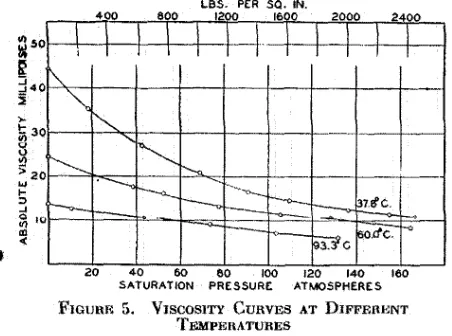
Les. PER SQ. IN.
400 800 1200 16 0 200 0
~ 501----+---!--+----+-.+--+---I - t - - · - 1 - - - < --+---+---! ~
j40r-"~+--+---+---+---+--+---f---,i---l
~
o.ctc .
20 40 60 60 100 120 140 160
SATURATION PRESSURE:. ATMOSPHERES
l''mmm 5. VISCOSITY CURVES AT DIFFERENT
TEMPI>llA TURES
part of the range but flatten off at roll times ovpr twelve to
fifteen minutes. This may be due to the break-down of the
film between ball and tube. The effect of turbulence ca:n be seen at the short roll times on the upper curve. The instru-ment gives satisfactory results in this range if enough cali-bration liquids are used to give the location of the curve with the desired certainty. The marked divergence of the two curves for a small change in ball size points to the need of high accuracy in the machining of both the ball and the
tube. It is also evident that change in the surface condition
-0f either the ball or the tube will change the calibration of the instrument to a marked extent. The balls used in this work were spherical to within 0.0001 inch, this degree of accuracy being necessary to obtttin duplication of roll times of 0.25 per cent.
Th@ effect of pressure on the calibration of the instrument
was investigated by comparing the small measured increase in viscosity of water under pressure with that expected from the work of Bridgman (2). This comparison indicated that at 170 atmospheres (2500 pounds per square inch) any change in calibration due to pressure could be neglected.
Tlie range of measurable viscosities covered with one ball
is quite large, frorn about 2500 milliµui~es Lluw u Lu 10
milli-poises. However, the long roll times encountered at the higher viscosities make a smaller ball desirable when working in this range.
From the measured roll time and the density of the liquid, it is a simple matter to read the absolute viscosity from the calibration curve. The kinematic viscosity can then be
comp11t.ed from the Hhfmlut.e viRcoRity and the density_
An illustrative set of results is shown in Figure 5. These viscosity curves are for a sample of Santa Fe Springs oil and dry natural gas at three temperatures. The decreased
effect of the dis::;olved gas at tlrn higher temperatures is
probably due to the lower solubility of the gas under these conditions.
CONCLUSIONS
The use of this instrument has indicated that:
1. The viscometer described may be satisfactorily applied to the study of the effect of dissolved gas upon the viscosity of crude oil at relatively high pressures.
2. The instrument is satisfactory for use at temperatures up to 100° C. (212° F.).
3. A wide range of viscosities can be measured with one ball, and to extend such range greatly, only a simple change of ball sizes is needed.
4. Buth the ball and the tube must be made with a high degree of accuracy.
5. The density of the liquid must also be measured in order to arrive at either the kinematic or the absolute vis-cosity.
ACKNOWLEDGMENT
This instrument was developed as part of Research Project 37 of the American Petroleum Institute. Financial support for this work has been received from a fund given jointly
by John D. Rockefeller and the Univernal Oil I'roducts
Company. Credit is due W. N. Lacey for his suggestions and interest in the design of the instrument. Charles Kircher did much to aid in the construction and the operation of the instrument. Acl\:nowledgment is made to tlarvey T. Kennedy, of the Gulf Research and Development Corporation, Pitts-burgh, Pa., for his suggeRtion of an improved method of plot-ting calibration curves.
(1926).
(2) Bridgman, P. W., Prue. Nai. Acwl., 11. ti11:3 (i\!~5).
(:3) Flowers, p,.oc . . 1111. Soc. Testina Mutc1i:u/.,, 14, 5GG (101!;.
(4) Hersey, M. D., J. Wash A.cad. Sciences, 6, 525 ( l!Jl6); M cch.
EniJ., 45, 315 (l!J23).
RECEIVED March 14, 1933.
THE DETERJ.fU~ATION OF THE THERL'.AL PROPER'.::IES AND THE
!rBE DETERMIN.A.TION OF THE THERM.AL PROPERTIES
AND !rl:l.E
P.USSURE-VOLUME-llMPERATUBE RELATIONS OF HYDROCARBON SYSTEMS
A knowlede;e of the thermal properties and the
presoure-volume-temperature relations for natural lzy'd.roearbon systems is of
interest to the petroleum producer in order to ascertain the available
reservoir energy and the most suitable method of employing it in pro-duetion. Such data on both simple a.nd natural systems are of value in
determining the energy relations in su:bsequ.ent processes where no
chemical changes are involved. The methods described in this paper
permit the determination of all of the general thermodynamic properties
of a )V'drocarbon system of constant composition, no matter how complex.
The apparatus used has a range from 50°F to 250°F and pressures up to
3000 pounds per square inch.
General Method: The changes in all of the thermal properties
at constant temperat'Ul"e ere completely determined by tho preee'l.lre-vol"UIIlO.:.
temperature relations of the system, and can be rigorously calculated
from them by application of the fundamental equations of thermodynamic
equilibrium. (l) However, the cha.Dge in at lea.st one thermal property
under known conditions (i.e., at a constant pressure or a constant
volume) as a function of temperature mu.st be directly measured before
all of the thermal properties of the system can be correlated as a
func-tion of temperat'llre. The following discussion will deal first, with an
apparatus for determination of the pressure-volume-temperature relations,
second, with an indirect method of meas'llrement of. the specific heat at
constant pressure in the condensed region, third, with an adiabatic
Cal-orimeter for measurement of the specific heat at constant volume, and,
2.
The Pressure-Volume-Temperature Apparatus.
The apparatus used in pressure-volume-temperature studies
previously described by the author and his co-workers (see part I of
this thesis) is not entirely suited for securing data for thermodynamic
calculations. It was primarily a constant-volume apparatus in which
the change in pressure with composition was followed at constant
tem-perature. The thermodynamic calculations herein described 11I11st be made
on a system of fixed composition and data obtained with the
constant-volume apparatus required nm.ch interpolation before it could be used
for such calculations. Moreover, this apparatus did not permit extended
studies in the condensed region. For these reasons new methods were
adopted in order to overcome these difficulties.
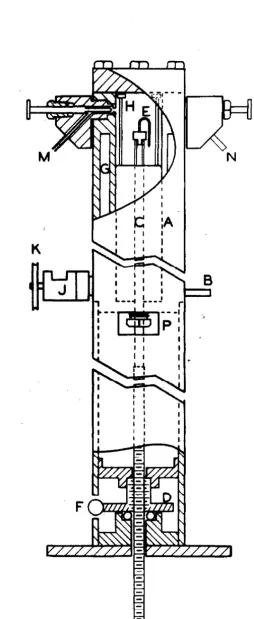
A sketch of the apparatus used is shown in Fig. 1. It
con-sists of a steel pressure cell (A.) whose inside diameter is two inches
and whose height is eleven inches. The volume of this cell J:DaY" be varied
at will by the addition or withdrawal of mercury through a valve located
at (B) near the bottom of the cell. The mercury is supplied to the
ap-paratus from a steam-driven reciprocating pump at pressures up to
3500
pounds per square inch. The mercury,before being admitted to the cell,
is preheated to the temperature of the apparatus. The volume of the space
above the surface of the mercury is determined from the position of the
mercury surface. The latter is ascertained by means of an electrical
contact (E) which is mounted upon a hollow rod which enters the bottom
of the cell through a packing gland. The wire from the electrical
t act (E) is brought out of the cell through the hollow rod and is
con-nected through a sens1t1ve relay to a signal 11ght. '?he lower portion
of the rod (C) e:ngegea a nut (D) which ia in turn driven b7 the
worm (F). A small motor attached to (F) permits the contact (E) to
be moved up or down the length of the cell (A). The final
adjust-ment of the position of the contact (E) is made by manual movement
of the worm (F). As the rod (C) was threaded with extreme care a
counter mounted upon the work (F) gives a direct indication of the
position of the mercury surface.
A
photograph of the exterior ofthe apparatus is shown in Fig. 2. The total volume over the mercury
surface for a given counter readiDg is determined by adding a known
volume of liquid to the cell and determining the counter reading when
the cell is just full of liquid at atmospheric pressure. This is
in-dicated by a very rapid rise in pressure for a small addition of
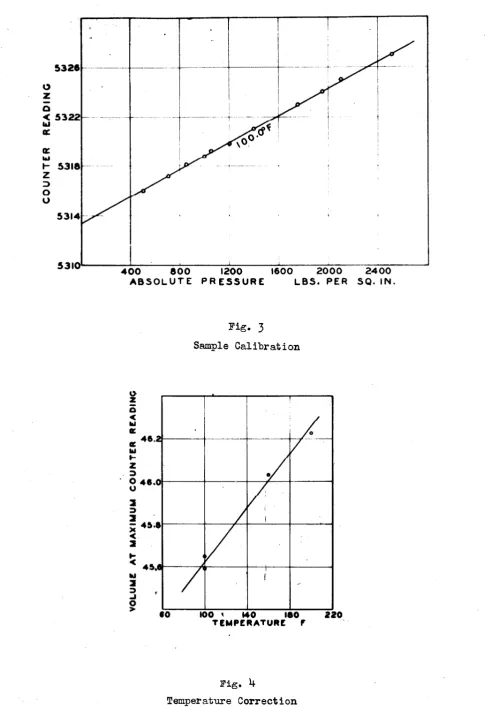
mer-cury. In Fig.
3
is shown a sample calibration curve. The line isextrapolated to atmospheric pressure and permits the determination
of tho counter reading for a known vol"WD.e of the cell. The
extrapo-lation to atmospheric pressure is necessary because the density of
the calibrating oil is knwwn only at this pressure. Since the cell
wa• carefully ma.chined and the screw was ma.d.e with high preeicion
(maximum deviation 0.0004 inch in a length of eleven inches) the
volume of the cell for any other counter reading could be readily
computed. It was found that the position of the mercury surface
could be determined within 0.0004 inch which corresponds to a volume
of 0.0012 cubic inches (0.02
ml.).
The pressure existing in the cell was measured by means of
atmospheric to 3000 pounds per square inch and the other A range
from atmospheric to 300 pounds per square inch. The reproducible
accuracy of each is 1.0 and 0.10 pound per square inch, respectively.
They are connected to the bottom of the cell by means of a. mercury
oil trap.
The temperature of the cell is controlled by an electric
heater wound directly on the outside of the cell. In order to
main-tain constant temperature, a mercury regulator (G) was built directly
into the wall of the cell. This regulator is connected through a
re-l~ to the heater. An auxiliary heater is provided in the insulated top to prevent possible temperature variation.
A
cooling coil woundon the cell permits studies below room temperature. The cell is
in-sulated from its surroundings by a one and one-half inch l~er of magnesia insulation. Great care was taken in the construction of the
heater and in the application of the ineulntion to insure constant
tem-perature at all points in the inside of the cell. The temtem-perature of
· the cell is determined by a calibrated thermometer placed in a deep
well in the wall of the cell. The uniformity of the temperature
through-out the cell was ascertained by the consistency of the dew point of a
pure substance at various total volumes of the apparatus. It is
be-lieved that the maximum temperature variation throughout the interior
of the cell is about 0.2°F. However, as most of the work is done in a
restricted region near the top of the cell this small variation is not
often encountered.
To secure equilibrium the contents of the cell are agitated
by a CS€e of four vertical rods (H) (see Fig. 1), which is rotated at
about 120 revolutions per minute by the shaft (K). This shaft is
con-nected to the cage by a pair of bevel gears not shown in Fig. 1. The
addition of this agitAtor did not affect the uniformity of chRnge in
volume of t~e cell with variation in the height of mercury, as the rods
are of uniform diameter and the volume of the ring at the top of the
rods is taken into account in the calibration.
The top of the cell is removable to allow the addition of
non-volatile liquids. Volatile pure liquids ~ be distilled into the cell from weighed pressure containers throu.gh valve (M). Measured
volumes of gas may be admitted. through valve (N), which is connected to the rest of the apparatus {see part I of this thesis).
The effect of pressure upon the calibration of the apparatus
was determined by maintaining the mercury surface at a fixed position
as indicated b~ a fixed electrical contact 1n the top of the cell
(not shown in Fig. 1) and noting the change in counter reading as the
gas pressure over the surface of the mercury was increased from
atmos-pheric to 3000 pounds per aqua.re inch. It was foi:md that the m<im:um
pressure correction was less than 0.05 percent at the minimum volume
of the apparatus. The effect of temperature upon the calibration of
the apparatus was eliminated by calibration at a meriee 0£ temperaturee.
The magnitude of this variation of volume due to change in temperature
is shown in Fig.
4,
which shows the volume of the cell as a function oftemperature at the maximum counter reading, which corresponds to the
minimum volume of the apparatus.
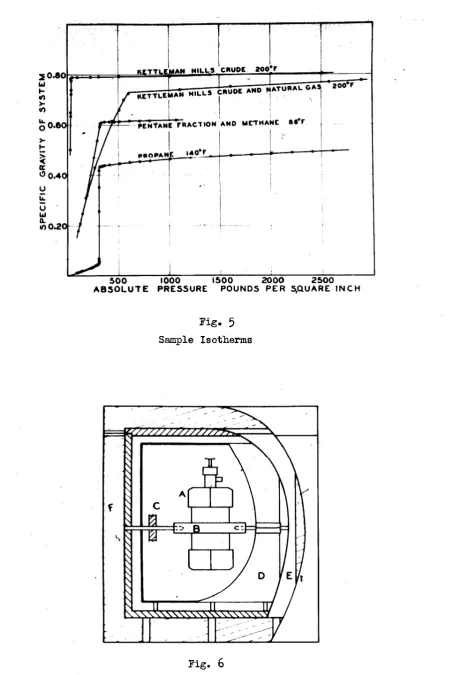
As an example of the type of data obtained with this
appara-tus, there are shown in Fig.
5
four isotherms. One is for Kettleman6o
0l', 0.8383(37 .'1°
.A.PI). (Specific gravity as used in this pa.perrefers to the ratio of the weight of a unit volume o:f the material at
a given pressure and temperature to the weight or a unit vol'llIIle of
water at its maximum aensity at atmospheric pressure.) Molecular
weight 188 (freezing-point method). An.other of the isotherms is for
a mixture of this oil and a blended natural gas of the same composi-tion as that obtained from the flowing well. The fraccomposi-tionacomposi-tion
analy-sis of the gas was the following: Methane
77.0%,
ethane11.0,&,
p'l"'opane 6.
7%.
butane 2.4~. isobutene l. l~. heavier 1.g"· The ratio of the gas to the oil was ll0.3 cubic feet per barrel, both oil andgas being measured at 60°F and one atmosphere. The sharp break in
each curve represents the point at which the system becomes entirely
liquid. The greater compressibility of the gas-saturated oil is
shown by the relative slopes of the two isotherms in the condensed
region. The specific gravity in the two-phase region is that of the
system as a whole, a quantity which is required for thermodynamic
cal-culations on systems o! constant composition •
.An isotherm for a mixture of methane (methane
99.29%,
ethane 0.01~, nitrogen
0.7%)
and impure pentane (97.5~ pentane) is alsoincluded in Fig.
5.
The more nearly linear relation of pressure tovolume in the case of the simple mixture in the two-phase region is
quite apparent.
An
isotherm for propane has been included also. Theconstancy of the vapor pressure in the two-phA.se region verifies the
Thermal Measurements
Specific Heat at Constant Pressure. After the variable
volume cell had been constructed and was found to yield such
satis-fac.Otl"Y P-V-T data in the condensed region, i t also furnished an ad-\ ""
mirable apparatus to determine the specific heats of materials in the condensed region. This was done by measuring the challges in
tempera-tu.re due to adiabatic challges in pressure.
In order to measure the change in temperature, a four
junc-tion copper constantan thermocouple was installed on the lower surface
of the head of the cell (not shown in Fig. l). One set of junctions
wns mounted upon two small bakelite posts (l/S inch aiameter) about
3/4
inch below the head of the cell. while the other junctions weremounted in
small
glass bulbs{l/16
inch diameter), which were set about1/8 ineh in the wa.11 of the steel head. The adiabatic change in
pres-sure was accomplished by connecting the mercury in the cell to an air
chamber of sufficient size that the pressure in the tube remained
con-stant in spite of the slight leakage past the plunger of the connected
fluid-pressure scale. Another air chamber was provided which was
main-tained at a somewhat different pressure than the first. The pressure
in the tube could then be changed easily and rapidly by closing the
valve to the first air chamber 8lld opening that to the second. The change in pressure being directly measured on the fluid-pressure scale.
A high sensitivity, low resistance galvanometer in connection with a
calibrated potentiometer was used to measure the temperature change
due to the adiabatic change in pressure. As the walls remained at
em-ployed in order to arrive at the true temperature change. After a.
little experience it was found possible to commence recording
tempera-tures about ten seconds after the pressure changed. .A. chronograph was
used to record the elapse of time. The record of the change in tem-perature as a function of time wa.s continued for a.bout one hlIDdred a.nd twenty seconds.
In
the case of hydrocarbons more viscous than kerosenethe effect of convection currents was so small that the cooling curve
results cuu.ld be owit.tedt for the maximum temperat'Ul"e reached by the
liquid could easily be measured before a fall in temperature due to
diffusion took place. The value of the thermocouple volta&e at zero
time yielded, from calibration of the thermocouple, the change in
tem-perature of the liquid for a known change in press-are. From this data. a
mean value of the
~g~>s
• could
be obtained for the average pressureexisting. This meas-arement was then repeated at a lower pressure and
another value of the coefficient obtained. By combining this data with
the thermal expansion.
c~;>p.
according to the general relationT(4l)p
Cp
=
~ the value of the specific heat at constant pressure was(dP)8
obtainea.
Specific Heat at Constant Volume. The method for
determina-tion of the specific heat at constant pressure is limited to material
which may be obtained in the condensed state over the entire temperature
21
range investigated at pressures somewhat below 3000 pounds per square inch.
Many natural hydrocarbon systems exist in the two-phase region only at
pressures well above this value, so the method of adiabatic cooling
cannot be applied to them. As measurement 0£ the specific heat must,
in such cases, be done in the two-phase region, a constant volume
calorimeter offers the simplest method of approach.
The apparatus used for the measurement of the specific heat
at constant volume is shown in Fig.
6.
It consists of a steel bomb (A) containing the sample, a heater and a thermocouple. The bomb (A) ismounted in a bak:eli te ring (B) which can be oscillated through about
150 degrees on shaft (K). This motion provides t.he necessary agitation
to insure both thermal and phase equilibrium. The motion is imparted
to the shaft (K) by means of cords attached to the grooved pulley (C).
In order to insure as little heat interchange between the bomb and its
surroundings as possible, an adiabatic jacaet (E) made of
1/4
inch co-:p-per was provided. In order to maintain the inside of the adiabaticjacket at the same temperature as the exterior surface of the bomb, a
thermocuuple was pro-vid.ed., one juuction bei.ug attacl1ed. to each surface.
These were directly connected to a high sensitivity, low resistance
gal-vanometer, which controlled an photoelectric relay. The rel~ in turn
controlled the flow of current through the heater mounted on tho
out-side of the copper jacket (E). Cooling coils were also provided on the
outside of the jacket to permit studies below room temperature. A
pic-ture of the jacket and accompanying parts of the calorimeter before
as-sembly is shown in Fig.
7.
To prevent excessive heat loss from thejacket, it was surrounded by a one-inch latYer of diatomaceous earth. The entire calorimeter was placed in the air thermostat which could be
pre-vented any change in the temperature distribution in the jacket when
studies are made at different temperatures. In order to further
re-duce the heat loss or gain by the bomb, a very thin radiation shield (D)
was provided. Due to the bakelite ring (B) the metal shaft (K) did not
come in contact with the bomb, thus reducing heat exchange from this
source. !t'he entire inside of the calorimeter wno niokel-plnted, covered with a very thin layer of chromium and polished. A picture of the
in-side of the assembled calorimeter is shown in Fig.
9.
In Fig. S a.re ,~hown the details of the constant-volume bomb. which was built of alloy steel to withstand a. maximum working pressure
of 3000 pounds per square inch. It consists of a cylindrical steel
tube (A) to which the removable heads (B) and (C) are fastened by means
of the large hexagonal union nuts (T). The energy is supplied to the interior of the bomb by a non-inductive heater (D) whose leads are
brought out at the contacts (E) and (F) located in the head (B). The
temperature of the bomb was measured by the thermocouple (G). The leads
from this cuupltJ wt1rtJ b1·ougllt through thtJ hollow contacts in the, lower
head.. This avoided any contact voltages at the surface of the bomb.
A photograph of the parts of the bomb is shown in Fig. 10. Liquid
material~ are added b~ removing one of the heads. Gaseous material. is added through the needle valve {H). (see Figure 8) The weight of
material added is determined in each case by the difference in the
initial and final weight of the bomb. When a. mixture is to be studied, each component is added successively, the bomb being weighed after each
addition. The amount of energy added to the bomb and contents was
de-termined by the current flow through, and the voltage drop across, the
heater (H). These were measured by means oi a standard resistance, a
volt box, and a potentiometer.
In order to determine the heat capacity of the bomb itself
it was almost filled with a non-volatile liquid and placed in the
calorimeter. .A.fter the jacket had come to temperature and the bomb no longer changed temperature with time, showiDg that the heat inter-change was exceedingly small, the internal heater was turned on for a
short period, usually about ten minutes. The bomb was agitated for
one minute and allowed to come to equilibrium. The rise in temperature
was then measured by connecting the thermocouple junction inside the
bomb to another mounted in a well heat-insulated copper block which
was brought to the temperature of the air thermostat and did not change
with time. :By this means the range o!" the potentiometer could be re-duced so as to just cover the rise in temperature of the bomb and
per-mitted much more accurate measurement of the temperature rise. The
meaisuremeut of the temperature rise Q.ue to the ad0.1t1on of a known
amount of energy was repeated at a series of temperatures covering
the entire range. Another set of similar measurements was then ma.de
with the bomb only about one quarter full of liquid and from this data
on the heat capacity of the bomb and two different quantities of oil
the heat capacity of both the bomb alone and that of the oil could be
calculated. The heat capacity of the bomb as a funet ion of temperattlre
is shown in Fig. 11.
It was found th~ the jacket followed the bomb so closely that
the temperature of the bomb remained constant within O.Ol°F for several
With this in view. no correction for heat loss was needed nor was there
any need to use a cooling curve to determine the true temperature rise.
The short period of Agitation did not add enough energy to warrant a
correction, for the energy added in this way only changed the
tempera-ture of the bomb about
o.09°F
per hour of agitation.Due to the large heat capacity of the bomb. the specific
heat at constant volume is only reproducible to about
1.5%.
However,as this requires that the heat capacity of the bomb and contents be
known to at least 0.3~ it is considered satisfactory.
Thermal Calculations for Hydrocarbon Systems. From the
pressure-volume-temperature data and a single measured thermal
pro-perty as a function of temperature, the calculation of the entire
thermal behavior of a system of constant composition is possible.
Of the various graphical methods of presentation available, the
temperature-entropy plane furnishes the best pict"Ul"e when both the
condensed and superheated regions are include&. The following
dis-cussion will apply to the construction of such a chart including the
five variables. pressure. temperature, volume, heat content, and
entropy.
As convenient datum conditions, the entropy and the heat
content of the saturated liquid are arbitrarily taken as zero at the
lower temperature limit of the experimental data. At this lowest
temperature lhe change .in entropy with pressure can be calculated by
use of the general equilibrium. equation
(~)T
=
($)p• Thisre-lation cannot be used in the two-phase region in the case of a P'Ure
substance, but can there be replaced by the Clapeyron equation,
· .6.h,
=
~
T h.v. From the above-mentioned relation of entropy to pres-sure at constant temperature the position of a series of constantpressure and volume intercepts can be determined at the datum
tempera-ture, the pressure-volume-temperature data being directly employed to
locate the constant volume lines a:fter the constant pressure lines had
been determined. .Again this procedure is somewhat modified in the
two-phase region of a pure substance. From direct thermal measurement
the position of either a constant volume line or a constant pressure
line can be determined as a function of temperature by use of the
proper one of the two following relations:
(
~s) Cv~v=
r
<aT>P=
,sl.!
T
CpAs the intersection of this line with the datum temperature is known
and its slope determined by the above relations it can be readily drawn on the tem;per.e.ture-antropy plane. From the
pressure-volume-temperature data the pressure and the volume is known at each
tempera-ture along this line and by applying the same methods as were used
at the·datum temperature the entire field of constant pressure and
volume lines can be drawn in.
The change in heat content with pressure at constant
tem-perature can be determined by graphical integration of the expression
(~)~
=
v -f(~)p
By following the same method as outlined above a field of constant
pressure lines may be drawn on the heat content-temperature plane.
There is no need of including the constant volume lines on this
auxiliary plane as they are already fixed on the temperature-entropy
. cdh>
cas>
plane. The relation
a
T p = T ~T p = Cp is used to establish onemeasured thermal quantities. From the temperature-heat content plane
the temperatures at which constant heat lines intersect constant
pres-sure lines can be determined and the constant heat content lines
transferred to the temperature-entropy plane •
.A.11 of the above calculations can be done by mathematical
analysis but the author feels that the graphical methods employed do
much to correlate the data and to point out errors. Tabb.lated data
are taken from the :final charts which were drawn to a scale to make
the tabulation accurate to at least
0.5"
throughout the entire range.Work of this nature on many hydrocarbon systems would require for practical application only a small part of the range usually covered in the thermal studies of pure substances. In general. data would only be needed for the condensed region and a part of the two-phase
region for a normal crude oil-natural gas mixture. In production practice. one would never reach pressures low enough to encounter the saturated gas line nor would production operations go to temperatures
high enough to reach the critical temperature of the mixture. Again.
on the other side of the composition scale with a wet natural gas,
one would need to cover most of the superheated region and the
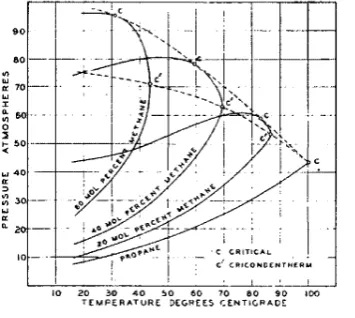
satu-rated gas relations but would only be required to go a little wa;r in-to the two-phase region as temperatures ordinarily met a.re above the
critical temperature of the gas and below the cricondentherm, (i.e ••
the maximum temperature at which two phases can exist). However, the
pressure might be far below that necessary to reach a one-phase region. In the case of a very dry gas. tenperatures would probably be above
the cricondentherm and one would ordinarily never encounter ~ two-phase region at all.
REFERENCES
1. "Thermodynamics," Lewis and Randall, 132-140, New York:
T
v
p
s
McGraw-Hill Book Co., 1923.
SYMBOLS USED
Specific heat at constant pressure expressed as the ratio of the heat required to raise a mass of material 1°F ab a con-stant pressure to that required to raise an equal mass of water 1°F at its maximum density under a total constant pres-sure of l atmosphere.
Absolute temperature in degrees Rankine.
Volume occupied by a unit mass af material expressed as cubic feet per pound.
Absolute total equilibrium pressure exerted on the system
by its surro'1ndings, expressed,in pounds per sq'U8l"e inch.
Specific entropy expressed in Btu per pound per degree Rankine.
K
I I
t::
I
I
:A
I
I I
I i I I I I I I I I I I , I I
.. -·'4 i--~ r
r--~p-:
I I I I
I I I
I I I ,
f·~ I
I I
Fig. 1
"
z
0
~321
< 5322
....
a::
a::
....
t- 5318
--z
::>
0
u
S3tOi'-~---.~o-o
_____
a_o~o---,2~0-o---,6~0-o---2~0-o-o----2-4-o-o--~--'ABSOLUTE PRESSURE LBS. PER SQ. IN.
\) z Ci
<
...
a:: a:: 46.II.I
...
z
:::)
Fig. 3
Sample Calibration
0 41.ni----l----~---1---I
u
:I :::> :I
i 4&;9
<
:I
...
< 4& •
..,
:I :::>
...
0
> to
100 ' 140 180 220
TEMPERATURE r
Fig.
4
Temperature Correction
"'
...
.,,
>
.,,
LL. 0
o.&o
>
...
~
a: "o.4 u ~
u
LIJ Q.
.,,.0.2
KETTLEMAN HILLS CRU ' I ' I
I ! I \ '
I ' [
~~'::'.!-,-:p;'.£ N::'t:;;:A;;N;iE;riF ft ACT 10 N' AND
I
I
P•OPANt i•o•f' I I j
I
I ""·
I
Mt"THANt
1.
al°r
500 1000 1500 2000 2SOO
ABSOLUTE PRESSURE POUNDS PER S,QUARE INCH
f
Fig.
5
Sample Isotherms
Fig.
6
Fig..
7
Unassembled Calorimeter
Figo S
F • 10
98
>-
I-u 94
<
ll.
<
u
90
I-
--I
I u 0
I 0
I 0
i
--0
... +
..
0I
-
1I
I I · - - ·
! I I
I
I
I
' i
1
- - ----., ______________ <
I.a.I
1:
I
60 80 100 120 140 160 18Q 200
TEMPERATURE
°F
Fif" 11
Figure

Related documents
Berdasarkan hasil analisis dalam tabel di atas, peningkatan hasil belajar kognitif speaking antara metode KWL dengan metode Teks Monolog, diketahui dari selisih
[r]
• in versions with cable outlet by means of a vented cable (IP67) In the absolute pressure range there is no need for compensa- tion with respect to atmospheric pressure.. Note:
Whenever the Town Manager shall submit to the Town Council a request for a new appropriation of any sum of money, either as a supplement to some item in the annual budget or for
lution. Tacit knowledge is often transmitted by observation and imitation — what anthropolo- gist Rene Girard calls mimesis. Girard suggests that this mimetic tendency has had
Since this programme was current affairs it should not have been sponsored and was therefore in breach of 6.2.1 of the Advertising & Sponsorship Guidelines for BBC
Having justified the choice of France as starting case study, we will have a look back in the recent history of agricultural and rural development policies to assess the social
Wheel and tire manufacturers recommend adjusting the air pressure to the trailer manufacturer’s recommended cold infl ation pressure, in pounds per square inch (PSI) stated on
