R E S E A R C H
Open Access
Research on the construction of regional
electronic commerce large data analysis
platform
Peng Zhang
Abstract
The construction of regional electronic commerce large data analysis platform is studied. First, the collaborative filtering algorithm is focused on the further elaboration. According to the demand of the recommendation system of the electronic commerce large data analysis platform of a certain agricultural product, the most core part of the recommendation system is realized and the collaborative filtering algorithm is improved emphatically. Based on the large user behavior data accumulated by the regional e-commerce platform, by mining the user’s implicit
evaluation of the merchandise, the sparsity of the scoring matrix is reduced, and the recommended effect of the algorithm is improved. The experimental results show that the improved algorithm can improve the efficiency and accuracy of the data processing of the regional electronic Commerce large data analysis platform.
Keywords:Recommendation algorithm, E-commerce, Large data, Analysis platform
1 Introduction
With the continuous improvement of information technol-ogy, the data pattern is highly complicated and the data scale is increasing rapidly. The whole society has entered the age of large data. The rapid rise of large data has be-come a link to the ternary world [1]. With the development of large data, the role of e-commerce in the network econ-omy is more and more important, and the development of E-commerce has become the primary task of all countries and regions [2]. E-commerce is one of the hottest topics nowadays and one of the most promising areas. Countries in the world have listed E-commerce enterprises as strategic industries to develop [3]. At the same time, due to the rapid development of the network economy, large data will be-come the strategic decision of the countries to seize the de-velopment, the control and application of the data will become the core competitiveness of the future society [4]. The research of regional e-commerce development based on large data analysis will promote the development of e-commerce in the region, and improve the Government, enterprises and other institutions to obtain benefits from
large data, so as to lay the cornerstone of large data indus-try, improve service capacity and operational efficiency [5].
2 State of the art
Traditional e-commerce data analysis is based on the preset targets, and irrelevant data will be discarded [6]. The large data analysis collects the various data of the enterprise. The potential application of the data stored in the future will not be limited to the initial set of targets, and it is also im-possible to predict what and how much value it will be [7]. One of the important features of large data analysis, which differs from traditional data analysis, is the real-time nature of analytical processing. This requires real-time analysis of the data generated at any time to obtain the required infor-mation and apply it in real time [8]. As an example of E-commerce recommendations, a new user should be able to immediately analyze their preferences for product rec-ommendations. A new product on the line should be able to immediately analyze and recommend to the potential customer base. With the development of information tech-nology, the data in every field is increasing rapidly, and the research on large data is becoming a hot spot. The arrival of the big data age brings about the change of the concept to the electronic commerce, impels the service mode Correspondence:[email protected]
School of Logistics, Chengdu University of Information Technology, Chengdu 610225, Sichuan, China
innovation [9]. In the application of large data analysis platform in E-commerce Network marketing, customer analysis, decision support, logistics distribution and other aspects of more research, and in Google, Baidu, Ali, Tencent and other large companies have been applied, and achieved great benefits. Small and medium-sized enter-prises account for the vast majority. However, due to many problems such as technology, capital, data quantity and tal-ent, it is very difficult for the majority of small and medium-sized enterprises to carry out large data analysis and application independently. Therefore, it is of great significance to help small and medium-sized enterprises to share large data analysis technology to the great advantage of enterprise development by constructing the third party electronic commerce large data analysis platform [10].
3 Methodology
3.1 Recommendation algorithm construction based on user behavior
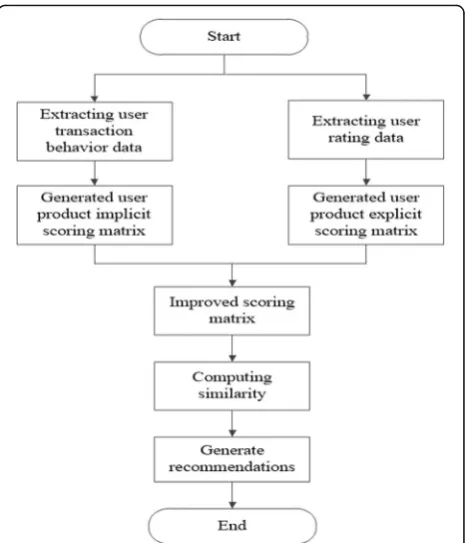
The collaborative filtering recommendation algorithm has been widely used in many fields, and the algorithm is be-coming mature and perfect, which has solved many prob-lems successfully. In the field of e-commerce, collaborative filtering algorithm is also popular, but also presents many problems, such as the scoring matrix is too sparse, data support is not complete, so that the final results of the ac-curacy and effectiveness of the reduction is caused. The most common is that the end user through E-commerce completed transactions did not immediately evaluate the goods. At this time, the E-commerce platform cannot require users to immediately evaluate. In this case, collab-orative filtering algorithm is difficult to calculate the similarity of this transaction. The end user will produce a lot of data in the process of E-commerce platform transac-tion. Especially some data have important storage and research significance for e-commerce platform. Through the optimization of collaborative filtering recommendation algorithm, the value data generated by the e-commerce platform can be calculated to grasp the user’s value behav-ior in the transaction process, for example, according to the user’s collection of goods, attention or whether or not to join the shopping cart, so as to excavate the user’s recessive evaluation of the merchandise, find out the psychological needs of customers, Improve the accuracy of the recom-mended results. In this context, the proposed algorithm is optimized from the user transaction behavior, and the opti-mized flowchart is shown in Fig. 1. The optimized algo-rithm is divided into two steps, one is to randomly extract the relevant data from the electronic commerce platform database, thus constructs the user dominant scoring matrix and the recessive scoring matrix. The second is to calculate the similarity of the users by using the collaborative filtering algorithm. Finally, the results are recommended to users to meet personalized customer needs. The optimization
method of collaborative filtering recommendation algo-rithm is described in detail below.
Firstly, the data is extracted and the scoring matrix is generated, and the user scoring data is extracted from the
electronic Commerce Platform database, and the
user-commodity explicit scoring matrix is generated. At the same time, the program extracts the user transaction behav-ior data from the database, converts the user’s implicit evalu-ation into the scoring, and generates the user-commodity implicit scoring matrix by calculating the algorithm. Then the scoring matrix is improved to solve the problem of sparse parts of the scoring matrix, and the scoring matrix is improved by combining the user’s explicit score with the implicit score, so that the algorithm can get more accurate calculation results. Then the user similarity is computed. In order to avoid the influence of different user’s grading scale on the calculation result, the similarity calculation method is used to calculate the similarity degree. User I and User J’s similarity sim (I, J) can be represented by formula 1.
sim i;ð Þ ¼j
The Rik and RJK in Formula 1 represent the user i and User j’s score for item K. Riand Rjrespectively represent
the average score of user i and User j on the project col-lection. Ii, j represents a collection of items that user I share with User J. The formation of close neighbors is to search for the target users to have similar hobby of the nearest neighbor set. That is, for the target user U, a nearest neighbor sequence U = {u1, u2, u3,……, un}, u∉ Usorted according to the size of similarity is generated. The quality of the collaborative filtering algorithm based on the user is largely determined by the nearest neighbor collection. Finally, it is recommended to generate the user’s nearest neighbor set by the similarity calculation, according to the recent neighbor set evaluation of the project, the user U to the Project J Prediction Score Pu, j, can be expressed in Formula 2.
Pu;j¼Ruþq
X
i∈Usim u;ð Þi Rij‐Ri
ð2Þ
The Pu, j in Formula 2 represents the predictive value of the user U’s rating for item J, based on the user’s score in the nearest neighbor collection of the target user, and the SIM (I, J) indicates the similarity between user I and user J. Q is the normalized factor, and the re-ciprocal of similarity. Ru represents the average score of a project that the target user u previously rated excessively.
3.2 Experimental data sources
The first step is to extract data and generate a scoring matrix, remove user rating data from an e-commerce platform database, and generate a user-item explicit rat-ing matrix. At the same time, the program extracts user transaction behavior data from the database and calcu-lates the user implicitly by algorithm. The rating is con-verted into a rating and a user-product implicit rating matrix is generated.The experimental data used in this paper are derived from an E-commerce platform for agricultural products. As the platform has been running on line, there are a large number of customers on the
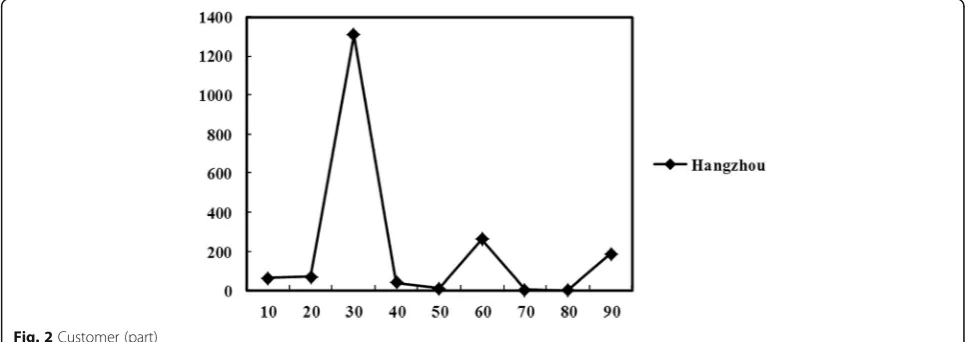
market on a daily basis for trading operations. In order not to affect the normal operation of the platform, the E-commerce platform customers to the author of the data provided by the offline way. To ensure security, sensitive data has also been dealt with, to the greatest extent to protect the confidentiality of trade and cus-tomer privacy. The data provided consists primarily of the trading data of the platform in 2013–2015, as well as the data of the transaction users involved, which are exported using Oracle DataPump to export the data packets. After importing the data into the development database, the data size of the client is about 20G by query. After the analysis of the data, including the trans-action data amounted to more than 10 million, the rele-vant transactions more than 9000 customers. Customers throughout the country 29 provinces, autonomous re-gions, municipalities, as shown in the table, it has a bet-ter representation (See Fig.2).
Because of the data in the electronic commerce plat-form, part is through the manual input. According to the past experience, there will be errors or omissions, data cleansing is to deal with the error data. Checking data consistency, dealing with invalid and missing values, eliminating duplicate data, unifying data formats, and so on, is the last program to find and correct data errors. For the processing of error data, such problems are mainly due to the existing problems of the existing E-commerce platform, when the system is entered, no judgment is inserted directly into the database, for ex-ample, the input string before and after the blank space, the input value of the number of digital transmission, date format is not correct or hyper-bounded, the amount of units are not uniform. These errors need to be sorted for processing. For the logical problems of the
data itself, such as incorrect date format or
hyper-boundary, the amount of units are not unified such errors. It is easy to affect subsequent processing of data, and SQL statements need to be handwritten to find
these errors. Subsequent data processing can be done after the confirmation is made with the customer. Deal-ing with problems such as incorrect data format, such as a space before and after the input string, the relevant function in the SQL statement is used to process the data extraction to get the correct data. For the process-ing of missprocess-ing data, such problems are mainly related to the management of E-commerce platform system, result-ing in some due data loss, such as customer company name, customer area information incomplete, customer registration capital information incomplete, the main table in the system and the information from the table cannot match. For this type of error, the SQL statement usually needs to be written, filtering out the problematic data, sorting out the missing parts, and giving feedback to the customer. After the completion of the customer input database, if not in accordance with the needs of the analysis of completion, some data may need to give up in order ensuring that the algorithm input data specifications.
The problem of dealing with similar and data formats is not correct, such as the input string before and after the space and other issues, you can use the relevant functions in the sql statement in the data extraction process, to obtain the correct data. For the processing of missing data, the emergence of such problems has a
cer-tain relationship with the management of the
e-commerce platform system, resulting in some missing data, such as the name of the customer company, in-complete customer area information, and customer reg-istered capital information. Incomplete, the primary table in the system and the information in the slave table do not match. For this type of error, it is usually neces-sary to write sql statements, filter out the data that has problems, sort them according to the missing parts, and feed them back to the customer. After the customer completes the entry, it will enter the database. If it can-not complete the analysis according to the needs of the analysis, It may be necessary to give up some data to en-sure that the algorithm enters data specification.
4 Result analysis and discussion
The experimental data used in this paper’s recommenda-tion algorithm is derived from an agricultural product e-commerce platform. Since the platform has been on-line operation, there will be a large number of cus-tomers on-line daily trading operations, in order not to affect the normal operation of the platform, the e-commerce platform The data provided by the client to the company is in an offline manner. To ensure security, relevant data is also processed for sensitive data, and commercial confidentiality and customer privacy are protected to the greatest extent. Then the model and al-gorithm are tested, and the RJDBC packet is used to
connect the database, which is referred to as <pref> in the algorithm <uid> < iid>. The input data is extracted, and then the user-commodity explicit scoring matrix is established by using the user’s scoring data on the mer-chandise. Similarly, an implicit scoring matrix is estab-lished. The scoring matrix has been improved to integrate the user’s explicit and implicit scoring, and the user’s score for a product is fused with the following strategy: If the product does not have an explicit rating, the user’s rating for the item is implicitly graded. If the user has had an explicit rating on the product, the user’s implicit rating of the product is compared with the ex-plicit score to take a larger rating of the product as a user. Then according to the comparison of the similarity calculation method of the collaborative filtering algo-rithm based on the user, the algoalgo-rithm uses the correl-ation similarity to calculate the direct similarity of the user, and then calculates the nearest neighbor based on the calculation result of the similarity, as shown in the following Fig.3.
For each target user UI, the user similarity is arranged in order from highest to lowest in the entire user simi-larity space, and then the user’s neighbor collection is generated. The formulaU = {U1, U2, U3,……, Un}, Ui∈U, from the set U inside to the first n users with the highest similarity to the target user, is taken as his nearest neigh-bor. The nearest adjacent number n can be set according to the system size. In this example, to guarantee the speed of the recommended system operation, n is set to 5. According to the nearest neighbor set generated in the previous step, the user’s prediction score for the pro-ject is calculated. The top-n is then sorted according to the forecast score to produce the recommended collec-tion. The user U’s nearest neighbor set is set to NBSU, and the user U’s predictive scoring value for project I pu.i can be scored using the items in the user’s nearest neighbor collection NBSU. User forecast score, and some of the recommended results are shown in Table1.
The transaction data provided by the customer is processed as the experimental dataset of this example, 80% data sets are selected as the training set, the remaining 20% data is used as the test dataset, and the average absolute error of the proposed algorithm is Mae compared, as shown in Figs.4and5.
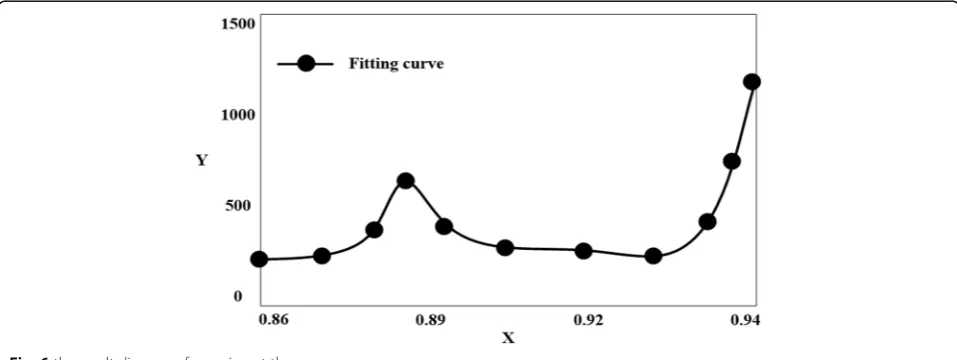
Compared with the minimum value, information tech-nology, facilities, personnel operating reliability in-creased by 0.014, 0.1296 and 0.1423 respectively, the highest level of upgrading is the facilities and equipment. Thus, the reliability of distribution varies with the degree of importance. In the initial value, the facility equipment is the most important, so the distribution reliability is in-creased more than the information technology and personnel operation. Therefore, ignoring the maximum reliability, the minimum reliability and the complexity, the first priority operation of the unit with the highest initial importance is given, which can improve the reli-ability of the system. Through the fitting curve function of MATLAB, the value of the cost of information tech-nology, facility equipment and personnel operation in-creased with the increase of reliability is obtained. In Fig.6, the horizontal axis represents the variation of the reliability of each influencing factor. The ordinate repre-sents the cost of the system changing as the reliability
changes. It can be seen from the figures that the degree of importance varies with the cost of the data.
As can be seen from Fig.6 above, when the reliability of information technology is in the range of 0.86 to 0.92, the cost is increased at a constant speed with the in-crease of reliability. When the reliability is in the range of 0.92 to 0.95, the curve suddenly tilted steeply, show-ing the trend of infinite ascension. It can be seen that the increase of system reliability is positively correlated with the increase of information technology, but the cost will be greatly increased when more than a certain inter-val continues to increase, and when the reliability of fa-cilities is 0.86 to 0.99, the cost of the equipment increases with the increase of reliability. When the reli-ability is in the range of 0.95 to 0.99, the curve suddenly tilted steeply, showing the trend of infinite ascension. When the operational reliability of the personnel is 0.86 to 0.99, the cost is increased with the increase of reliabil-ity. When the reliability is in the range of 0.95 to 0.99, the curve suddenly tilted steeply, showing the trend of infinite ascension. When the external condition is cer-tain, the distribution result changes with the change of the important degree. Due to the maximum importance of facility equipment in three factors, the reliability in-creases with the increase of its important degree.
Table 1sample of recommended results
User ID Recommend 1 Score Recommend 2 Score Recommend 3 Score
12,518 RB2202 4 RBI204 3,67 RB2203 3.4
11,208 RB2209 5 RB2220 3.67 0 0
11,823 0 0 0 0 0 0
12,135 RB2222 5 RB2222 3.5 RB2208 3.33
9133 RB2208 4 RB2209 4 RBI220 3.33
5733 RB2202 5 RB2203 5 RBI220 4.5
6602 RB2205 4 RB2209 4 RBI222 3.67
12,839 RB2222 4.33 RB2205 4 RB2204 3.67
Therefore, ignoring the maximum reliability, the mini-mum reliability and the complexity, the first priority op-eration of the unit with the highest initial importance is given, which can improve the reliability of the system. When the reliability of the unit increases, the system re-liability will be increased, so that the system cost is greatly improved, so we need to consider the influence of each factor on cost and system reliability. Through the above experimental results, what can be seen is that the improved collaborative filtering algorithm based on users has the smallest Mae and Rmse compared with other two collaborative filtering algorithms. Therefore, the proposed algorithm improves the recommended quality and adapts to the demand of the e-commerce platform. Compared with the other two collaborative fil-tering algorithms, the improved recommendation algo-rithm can be used to reduce the sparsity of the scoring
matrix by mining the user’s implicit evaluation of the product and the user’s explicit evaluation.
From the above experimental results, we can see that the improved user-based collaborative filtering algorithm in this paper has the smallest MAE and RMSE com-pared to the other two collaborative filtering algorithms. Therefore, the improved recommendation algorithm in this paper improves the quality of recommendations, and can better meet the needs of the e-commerce plat-form. The improved recommendation algorithm of this paper, compared with the other two kinds of collabora-tive filtering algorithms compared with it, mainly through mining the user’s implicit evaluation of the goods, combined with the user’s explicit evaluation of the goods, reduces the sparseness of the scoring matrix. In the other two collaborative filtering algorithms, the rating value is given by the user display, and there is a problem
Fig. 5Comparison of recommended algorithms RMSE
that scoring is difficult to obtain and the rating data is sparse. In order to solve this kind of problem, the im-proved recommendation algorithm of this paper, accord-ing to the user’s transaction behavior in the e-commerce platform, obtains the user’s implicit evaluation of the product, and converts this implicit evaluation into a score, and the user’s display of the product. Ratings are com-bined to achieve better recommendations.
In summary, through the above analysis, we can see that in recent years, China’s e-commerce has devel-oped vigorously and has a large scale, and it has be-come the world’s largest Internet market. At the same time, with the development of information technolo-gies such as cloud computing and the Internet of Things, the rapidly expanding data has brought hu-manity into the era of big data. Therefore, building a regional e-commerce big data analysis platform has very important practical significance. How to quickly and accurately analyze regional e-commerce big data
has become an urgent requirement for many
e-commerce platforms. According to the demand ana-lysis and design, this paper implements the most core part of the recommendation system, uses the big data of an agricultural product e-commerce, and improves the collaborative filtering algorithm in light of the sparseness of the scoring matrix. The improved algo-rithm is mainly based on the user’s transaction behav-ior in the e-commerce platform, and can represent the user’s implicit evaluation of the product. By con-verting this implicit evaluation into a score and
com-bining with the customer’s explicit rating of the
product, it can achieve better results. The average ab-solute error MAE and the root mean square error RMSE are used as the criteria for measuring the ef-fectiveness of the recommended algorithm. After the experimental comparison, the improved algorithm has the smallest mean absolute error and the root mean square error, indicating that the improved algorithm adapts to the region. The demand for e-commerce big data analysis has improved the efficiency and ac-curacy of big data analysis.
5 Conclusion
In recent years, our country’s electronic commerce devel-opment has become the world biggest internet market which is vigorous and the scale is huge. At the same time, with the development of information technology such as cloud computing and Internet of things, the rapid expan-sion of data has brought human beings into the big data age. Therefore, it is of great practical significance to con-struct the regional electronic Commerce data analysis platform. How to quickly and accurately analyze the large area electronic commerce data has become the urgent de-mand of many e-commerce platforms. According to the
requirement analysis and design, the most core part of the recommendation system is realized, and the cooperative filtering algorithm is improved by using the large data of the electronic commerce of a certain agricultural product, aiming at the sparse problem of the scoring matrix. The improved algorithm is based on the user’s trading behavior in the E-commerce platform, and can represent the user’s implicit evaluation of the product. By translating this im-plicit evaluation into a score, it is combined with the cus-tomer’s explicit scoring of the product to achieve better recommendation results. Mean absolute error Mae and RMS error RMSE are adopted as the criterion of the effect of the metric recommendation algorithm. The experimen-tal results show that the improved algorithm has the mini-mum mean absolute error and mean square root error, and the improved algorithm adapts to the requirement of large data analysis in E-commerce area, and also improves the efficiency and accuracy of large data analysis.
Abbreviations
MAE:Mean absolute error; RMSE: Root Mean Square Error
Funding
This work was support by the Sichuan e-commerce and modern logistics research center project at 2017(project number: dswl17–14), and Sichuan science and technology department technology support project at 2015 (project no.: 2015GZ0357).
Authors’contributions
PZ has made contributions to the collection and analysis of big data in electronic commerce. The author read and approved the final manuscript.
Author’s information
P Z, Master, Lecturer. Graduated from Wuhan University in June 2006. Work in School of Logistics, Chengdu University of Information Technology. Research Direction is Electronic Commerce and Big data. (E-mail: [email protected]).
Competing interests
The author states that there is no competitive advantage.
Publisher’s Note
Springer Nature remains neutral with regard to jurisdictional claims in published maps and institutional affiliations.
Received: 16 May 2018 Accepted: 18 September 2018
References
1. J. Lee, J.H. Lee, Constructing efficient regional hazardous weather prediction models through big data analysis. Int J Fuzzy Logic Int Syst16(1), 1–12 (2016) 2. H.U. Lin, Human resource flow region estimation model simulation based
on big data analysis. Modern Electron Tech59(6), 457–532 (2017) 3. H. Zhao, Q. Li, Foundations and countermeasures on big data analysis for
dynamic monitoring and evaluation of regional soil and water loss. Sci Soil Water Conserv365(5), 4257–4321 (2016)
4. Y.U. Shengquan, L.I. Xiaoqing, Research on the Analysis and Improvement of Regional Education Quality Based on Big Data. e-Educ Res356(4), 346–427 (2017) 5. M.L. Song, R. Fisher, J.L. Wang, et al., Environmental performance evaluation
with big data: Theories and methods. Ann. Oper. Res.385(3), 1–14 (2016) 6. G. Liu, J. Yang, Y. Hao, et al., Big data-informed energy efficiency assessment
of China industry sectors based on K-means, clustering. J. Clean. Prod.
7. R. Lovelace, M. Birkin, P. Cross, et al., From big noise to big data: Toward the verification of large data sets for understanding regional retail flows. Geogr. Anal.48(1), 59–81 (2016)
8. W. Zhang, K. Thurow, R. Stoll, A context-aware mhealth system for online physiological monitoring in remote healthcare. Int J Comp Comm Control
11(1), 142–156 (2016)
9. M. Kumar, Y. Mao, Y. Wang, et al., Fuzzy theoretic approach to signals and systems: Static systems. Inf. Sci.418, 668–702 (2017)