R E S E A R C H
Open Access
Similarity-aware data aggregation using
fuzzy c-means approach for wireless sensor
networks
Runze Wan
1, Naixue Xiong
2*, Qinghui Hu
3, Haijun Wang
1and Jun Shang
1Abstract
For resource-constrained IoT systems, data collection is one of the fundamental operations to reduce the energy dissipation of sensor nodes and improve the network lifetime. However, an anomaly or deviation will exert a great influence on the quality of data collected, especially for a data aggregation scheme. By taking into account data-aware clustering and detection of anomalous events, a similarity-data-aware data aggregation using a fuzzy c-means approach for wireless sensor networks is proposed. Firstly, by using a fuzzy c-means approach, the clustering process can be performed to organize sensors into clusters based on data similarity. Next, an effective support degree function is defined for further outlier diagnosis. Afterwards, the appropriate weight of valid data can be obtained by taking advantage of the probability distribution characteristics of normal samples within a certain period. Finally, the aggregation result in the cluster can be estimated. Practical database-based simulations have confirmed that the proposed data aggregation method can achieve better performance than traditional methods in terms of data outlier detection accuracy and relative recovery error.
Keywords:Fuzzy c-means, Data similarity, Aggregation, Wireless sensor networks
1 Introduction
Wireless sensor networks (WSNs) are typically com-posed of many small and low-cost sensor nodes with re-source constraints, such as low memory capacity, less computational complexity, low communication band-width, and limited power. This new type of network demonstrates the characteristics of low cost, wide distri-bution, small volume, and flexible self-organizing [1]. With the rapid development, it has been successfully ap-plied in the consumer electronics market and more and more widely used in the fields of target tracking, intelli-gent transportation, health prognosis, industrial automa-tion, and so on. However, due to the WSN’s imperfect nature, the sensor nodes need to be deployed densely to compensate for the quality of data collected [2, 3]. Nonetheless, for process-monitoring applications, high frequent sensing and the transmission of readings result in a large number of redundant samples, which may lead
to the waste of the node’s energy and bandwidth re-source as well as the reduction of the network lifetime. Therefore, how to employ spatiotemporal correlation of the readings between sensor nodes and develop efficient data redundancy reduction for saving the energy of the sensors are urgent problems.
Data aggregation is an effective method to solve the above problems [4]. The basic idea is to aggregate the samples of multi-sensors with a certain degree of redun-dancy rather than transmit raw data. It means that some nodes will act as aggregator to eliminate redundant data received from other sensor nodes and achieve desirable results for data accuracy. In practical application, the monitoring indicators, such as temperature, humidity, flow rate, or pressure, will demonstrate smooth and steady change in the majority of cases [5]. Once a sud-den event occurs, the surrounding sensor nodes are gen-erally able to detect the situation and obtain the readings synchronously. Therefore, the samples with large deviations from individual nodes may have a greater impact on the overall fusion results and influ-ence the quality of data collected [6]. In this paper, we * Correspondence:[email protected]
2Department of Mathematics and Computer Science, Northeastern State
University, Tahlequah, OK, USA
Full list of author information is available at the end of the article
focus on spatio-temporal correlation of the readings in cluster-based WSNs. In particular, we cope with data-aware clustering and detection of anomalous events, and we use fuzzy c-means approach to organize sensors into clusters based on data similarity.
2 Methods
This study originates from the need for detecting spatial outliers in terms of the spatial correlations among neigh-boring sensor reading, which can get more accurate fu-sion results. Our approach uses the spatial temporal correlations of sensor’s samples to detect outliers locally. Compared with previous works, our contributions are presented as follow:
We propose a novel similarity-aware data aggregation using fuzzy c-means approach for wireless sensor networks.
We propose a theoretical analysis to determine the optimization of cluster formation.
We conduct extensive simulations to demonstrate the performance of the algorithms. Simulation results show that our proposed method can achieve better performance than traditional methods in terms of data outlier detection accuracy and relative recovery error.
3 Related work
The traditional methods of data aggregation can be clas-sified into two major categories: random theory-based and artificial intelligence-based approaches [7, 8]. The former includes the weighted average method, least square method, the Bayesian estimation, D-S evidence theory, and so on. The latter uses artificial neural net-work, fuzzy reasoning, or rough set to eliminate the anomalous data.
Izadi et al. [9] presented a fuzzy-based data fusion ap-proach for WSNs to mitigate redundant data and reduce energy consumption. The authors utilized a fuzzy logic controller to obtain the confidence factor, and then the true value is distinguished and transmitted to the cluster head (CH) for multi-sensor data fusion. Fu [10] pro-posed double CHs model for secure and accurate data fusion, in which each cluster maintains dual CHs ac-cording to the reputation evaluation. All CHs make data fusion and transmit the results to the base station (BS), and the dissimilarity coefficient can be obtained by BS according to the fusion results. If the dissimilarity coeffi-cient exceeds the threshold, the CH will be put into the blacklist and rotate the CH selection immediately. Xiang et al. [11] proposed a data aggregation method based on
the compressive sensing theory. Particularly, they
adopted diffusion wavelets to make the raw sensor data
sparse to decrease the communication overload as well as the computational complexity.
Furthermore, there are several strategies proposed in order to mitigate the energy hole problem. Sun et al. [12] proposed a data aggregation method of wireless sensor networks using artificial neural networks. The data fusion tree is established to reduce the packets flow and can update the leaf nodes dynamically. Aikaraki et al. [13] introduced a joint design of data aggregation with the routing technology, and presented a grid-based routing and aggregator selection scheme to achieve low energy dissipation and low latency without sacrificing quality. By investigating data fusion with communication constraint between the fusion center and each sensor, Xu et al. [14] presented a data fusion mechanism for tar-get tracking in wireless sensor networks based on quan-tized innovations and Kalman filtering. By adding some delay time, all the data collected by relay node can be fused at one time so as to reduce the energy consump-tion. Aiming to ensure the data quality, Li et al. [15] pro-posed various metrics for QoS (quality of service) in the process of data aggregation, including lifetime, data delay, and retransmission rate. Also, the approach is dis-cussed to ensure above QoS metrics in details.
presented outlier detection methods based on a neural network for WSNs, which exploited historical data to train the neural network to determine whether the ac-tual measured value into the prediction interval so as to distinguish the data anomalies.
4 Network model and cluster formation
4.1 Network model
We consider a cluster-based architecture for a wireless sensor network, where all sensor nodes can monitor the given condition and periodically send its collected data to its CH. Most researches demonstrate that clustering is considered as an efficient topology control method in WSN to improve the scalability and lifetime of the whole system [21]. By dividing the network, sensor nodes will be grouped into different clusters based on certain rules and each cluster has a cluster head [22]. CH is respon-sible for managing the cluster and receiving the set of collected data from its member node during a certain period. Also, in order to improve the efficiency of data fusion, CH should have the ability to employ statistical detection based on the sensor readings. It can detect spatial outliers that deviate from normal data, thus en-suring the accuracy of data fusion.
In addition, the following assumptions about the net-work’s topology are suggested:
1. At each period, the sensor nodes acquire the monitoring readings at a fixed sampling rate withm measures.
2. The original attribute information collected from the sensor nodes can be fuzzified into a set of membership functions.
3. In each cluster, the member nodes collect data in a periodic manner. Subsequently, all member nodes will send their data to the appropriate CH for data aggregation at the end of a round.
4.2 Cluster formation algorithm
In this section, we discuss the cluster formation based on data similarity by using fuzzy c-means approach. Compared to other topologies, cluster-based network topology is recently considered to be more effective for aggregating data packets separately. In addition, most of the existing data aggregation techniques based on clus-tering topology are dedicated to an event-driven data model. Many hierarchical cluster formation algorithms focus on the distance between nodes, residual energy, geographic coverage, and so forth. In contrast, the main purpose of our proposed method is to clear and amelior-ate the collected data and provide the best information to end users [23]. From a statistical point of view of the correlation, the perceived data of same time slot can demonstrate spatial-temporal correlation in the adjacent
monitoring region. If the monitoring indicators of per-ceptual physical objects in the region do not show great fluctuation, there will be minimal deviation of the data collected by the sensor nodes with close geographical lo-cation [24]. Therefore, cluster formation algorithm can make use of the spatial-temporal correlated environmen-tal data and partition the adjacent sensor nodes with similar data instances into one cluster and different to objects in other groups.
The fuzzy c-means (FCM) algorithm was proposed by Bezdek [25] and has been used in cluster analysis, pat-tern recognition, image processing, and so forth. FCM is a clustering method derived from unsupervised learning, which uses fuzzy theory to divide a set of data points into a set of fuzzy clusters according to certain partition-ing criteria [26]. Suppose a WSN that consist ofN -sen-sor nodes randomly distributed over an area of S×S meters. By using of the sensor’s respective geographical location and collected data initially, the BS computes the cluster centers and allocates sensor nodes to the clusters by applying the FCM algorithm.
Each node is assigned a degree of membershipuijto a
cluster Ck rather than completely being a member of
other clusters. According to [27], to achieve adequate coverage rate, the optimal number of Kclusters should be determined by
K¼ ln 1ð −δÞ ln 1 −3pffiffiffi3R2=2S2
& ’
ð1Þ
where S represents the side length of square region, R represents the sensor’s communication radius, andδ de-notes the coverage rate to be assured.
Assuming that sensor nodesiandsjlocate in the same
cluster,XiandXjrepresent their collected data sets
dur-ing a fixed period.xij denotes the measure generated by
the sensor si at the time slot j, and m is the number of
samples in the fixed period. In the periodic data collec-tion model, in order to minimize data redundancy and still guarantee the accuracy of fusion results, studying the variance between measurements is an analytical way to choose appropriate nodes to form clusters. According to information entropy theory, the entropy value of all samples at timejcan be obtained by
ej¼−
Since the utility value of the index is proportional to its impact on fusion results, the weight value of variable
ωj¼
Next, the weighted Euclidean distance between the reading of node si and centroid point vk of cluster Ck
can be expressed as
where vkj indicates the reference value of the centroid
point at timejin clusterCk.
Next, the objective function should be proposed to en-hance the quality of the clusters and allocate sensor nodes into their most appropriate one [28]. By using FCM, the objective function, which will operate with it-erative procedures, can be formulated as follows:
minJ Xð ;U;C1;C2;⋯;CKÞ ¼
where uki denotes the degree of membership being
assigned to node si to join in the cluster Ck. U denotes
the membership matrix ofuki.υ0is a weighting exponent
on each fuzzy membership that determines the amount of fuzziness of the resulting classification, and is set to 2.
By using the Lagrange’s multiplier to optimize formula (18), the problem is equivalent to find the minimum value of the Eq. (6).
where wi indicates the weight value in process of data
aggregation. It can be set as 1/Ninitially, and be updated by formula (22) at the end of each sampling period.
Note that the first order partial derivative should be equal to 0, i.e.,∂F/∂λ= 0 and∂F/∂uki= 0. Then, we have
Thus,ukican be determined as
uki¼ wi½Dis sði;vkÞ
Similarly, suppose that ∂F/∂vk= 0, the reference vector
of the centroid point in clusterCkcan be given as
vk¼
Outliers are often known as anomaly or deviation, which can even mislead systems into unsafe conditions. Whether the quality of data collected by WSNs is reli-able and accurate or not will influence the performance of the whole system [29]. Therefore, data outliers should be detected and isolated in time so as to ensure the val-idity of data aggregation result and fusion efficiency. For clustered WSN, it is impossible for CH to determine the validity of the data sent by its members. However, the geographical relationship between the readings of sensor nodes within a certain physical spatial range or cluster may be an effective means to identify outliers through credible tests of the masses. In this sub-section, an ef-fective support degree function is defined for further outlier diagnosis is introduced, which is based on a standard statistical distribution model and makes use of the measures between neighboring nodes.
As mentioned above, due to the spatial-temporal cor-relation in the adjacent monitoring region, the
measure-ments between node si and sj at the same sampling
period will show relatively small differences. Hence, the support degree from node sj to si can be expressed as
consistency between the samplesXiandXj.
First, to eliminate the influence of the measurement scale, the normalization processing of raw data is intro-duced to make a relatively objective comparison between measurement sets collected by different sensor node. The original attribute of raw data may belong to positive index or negative index. First, linear transformation of raw data can be given by
x0ij¼xij=^xj; if xj is positive index
x0ij¼^xj=xij; if xj is negative index
ð11Þ
where ^xj denotes the ideal value for the samples at the
time slotj, andx0ijis the proximity ofxijto ideal values. Then, the normalized value of samplexijcan be
yij¼x0ij=
Xn
i¼1
x0ij ð12Þ
In order to characterize that mutual support relation-ship between sensor nodes, the support degree can be defined as
where^ykrepresents the mean value.
According to the above function, the support degree matrixPof the measures from all nodes in a cluster can be obtained
collected bysifrom the member nodes in the same
clus-ter, andnindicates the number of member nodes. By in-tegrating the evaluation of all neighboring nodes, the comprehensive support degree ofXican be calculated as
Ti¼
Since Ti is relative to the amount of support degree
from other member nodes or its nearest local neighbors, it indicates normal level compared to the majority of sensor readings. When a sensor sends abnormal data due to noise errors or malicious attacks, the readings will obviously deviate from the measures of other sen-sors. As a result, its comprehensive support is very small. Unless a large area of intra-cluster nodes fail sim-ultaneously, the probability of that exceptional case will be very low and can be neglected.
Suppose that the comprehensive support of data Xiis Ti, ifTi≥ζ, Xi is determined as normal data. Otherwise,
the data will be regarded as outliers. Among them, the parameter ζ is set as the availability threshold value. When the value of Tiis less than the threshold value ζ,
the corresponding readingsXiwill be processed to
miti-gate the influence on the aggregation result.
5.2 Data aggregation strategy
In this section, we present the data aggregation strategy to ensure the accuracy of the aggregation result. Before aggregation process, the data being collected from mem-ber nodes will be sent entirely to the cluster head, which
can conduct outlier detection based on the centralized approach. If the data being received is valid, it will be put into data aggregation process. Otherwise, they should be rejected immediately. Therefore, the two types of memory buffers can be embedded in CH and corre-sponding parameteraandb is set to count the number of normal and outlier data uploaded by each member node. Under certain conditions, the probability distribu-tion of normal and outlier data will be approximate to the posterior probability distribution with binomial model, which can obey the beta distribution. Therefore, the beta distribution characteristics can be employed to evaluate the data validity.
Set χ as the posterior probability of a random event, the probability of distribution can be obtained based on the Bayesian statistics as
The probability density function of the parameter (a,
b) can be expressed as
As a result, the reliability of the monitored samples of the determined node will obey the beta distribution with parametersa+ 1 andb+ 1.
Therefore, the mathematical expectation E(χ) of beta distribution can be given as
Eð Þ ¼χ aþ1
aþbþ2 ð20Þ
collected by the determined node can be attenuated by introducing time attenuation factor. Accordingly, the time attenuation factor should be defined as
θ¼Tdi=Tdave ð21Þ
whereTdidenotes the packet transmission delay of node
si, and Tdave denotes the average packet transmission
delay of all member nodes.
Thus, formula (8) can be modified to:
Eð Þ ¼χ aþ1
aþθbþ2 ð22Þ
The revised mathematical expectation can be defined as the weight value in process of data aggregation, and
wi=Ei(χ) will be allocated to member nodes.
Finally, the aggregation result in the cluster can be es-timated by
In this section, practical database-based simulations have been conducted to evaluate the performance of our method. Firstly, the datasets are derived from the real sensed data collected from 54 Mica2Dot sensors de-ployed in the Intel Berkeley Research Lab between
Feb-ruary 28 and April 5, 2004 [30]. The sensed data
included humidity, temperature, light, and voltage values collected. In the experiments, we first selected some measurements of temperature from the sensor nodes 36 until 43, for the time period from March 18, 2004, to March 20, 2004, corresponding to 2000 log rows. We do not take into account the other features (humidity, light, and voltage). The quantity of data is about 2.3 million readings; it was collected using the TinyDB in-network query processing system, built on the TinyOS platform. Based on the dataset, we add a given mass of outliers to simulate the occurrence of events, which can make the data fluctuate to a certain extent.
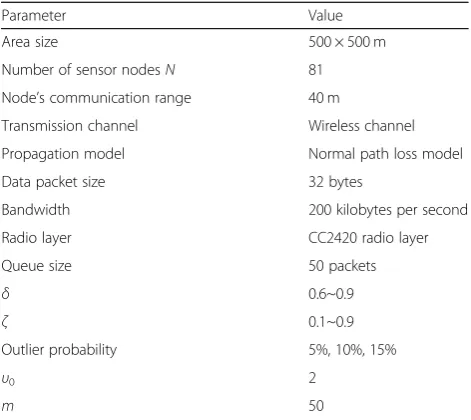
To evaluate the performance of our approach, we use the TOSSIM tool [31]. TOSSIM is a TinyOS simulation tool which simulates WSN physical and link layer fea-tures accurately. This allows validating the solution under realistic WSN deployment conditions. In each test, we repeat the simulation for 30 times and compute the mean of results. The key simulation parameters are summarized in Table1.
In the experiment scenarios, outliers are simulated randomly, and 100 values of temperature are generated and then added to the dataset. In terms of the evaluation metrics, detection accuracy rate is defined as the ratio of outliers being detected to all outliers, and false alarm
rate represents the ratio of normal data mistakenly de-tected as outliers.
First, our objective is to study the detection of abnor-mal data in accordance to our proposed method. Figure1 shows the detection accuracy rate when varyingδand ζ. Since the support degree can differentiate the normal data and outliers, it can effectively guarantee the data ac-curacy when handling the aggregation process. This truth is clearly shown in Fig.1when the sensor node ap-plies the aggregation phase and whenδ and ζincreases. In addition, it can be noticed that the detection accuracy rate can be significantly improved as ζ increases. The reason is that once the node’s support degree cannot be satisfied with the threshold’s requirement, its readings will not be preserved and submitted to CH for data fu-sion. It is beneficial to the accuracy of the final fusion results.
Figure 2 shows the false alarm rate when varying δ
and ζ. Indeed, we can find that the overall trend of false alarm rate is opposite to that of the detection ac-curacy rate, especially when δis larger, the fluctuation
is more obvious. The higher value of δ means that
more clusters will be distributed in the monitoring re-gion. For fixed number of total sensor nodes, it will cause the reduction of the number of members in a single cluster and make the determination of outliers more stringent. In addition, the increase of thresholdζ leads to higher level for support degree, and the sam-ples with large deviation can easily be judged to be in-valid. In the case of a monitoring indicator that suddenly changes dramatically and only a few nodes perceived it, their readings will be treated as anomal-ous data owing to low support degree. Thus, the de-tection accuracy rate will be increased.
Table 1Simulation parameters
Parameter Value
Area size 500 × 500 m
Number of sensor nodesN 81
Node’s communication range 40 m
Transmission channel Wireless channel
Propagation model Normal path loss model
Data packet size 32 bytes
Bandwidth 200 kilobytes per second
Radio layer CC2420 radio layer
Queue size 50 packets
δ 0.6~0.9
ζ 0.1~0.9
Outlier probability 5%, 10%, 15%
υ0 2
Figure3shows the deviation degree of aggregation re-sult as a function of threshold ζ. Based on the obtained results, we can notice that ζ moves from the extreme values of 0.1 and 0.9 towards the optimal value 0.6. When the threshold is either too low or too high, the final fusion result is not ideal. This is due to the high ac-curacy and low false alarm rate of differentiating normal data and outliers in terms of appropriate availability threshold. Low threshold setting may result in low de-tection rate and thus affecting the accuracy of the final
fusion result. Conversely, excessive value of specified threshold will make the criteria more rigorous, and the normal measurement will be identified as outlier. More-over, if such a situation occurs in a continuous time, it will inevitably lead to a sharp decline in the weight of these valid data in data fusion processing and thus af-fecting the data accuracy.
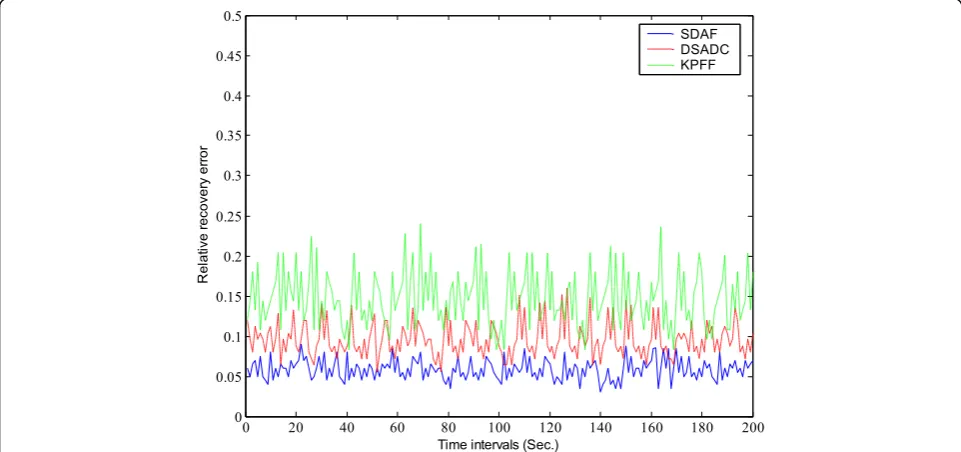
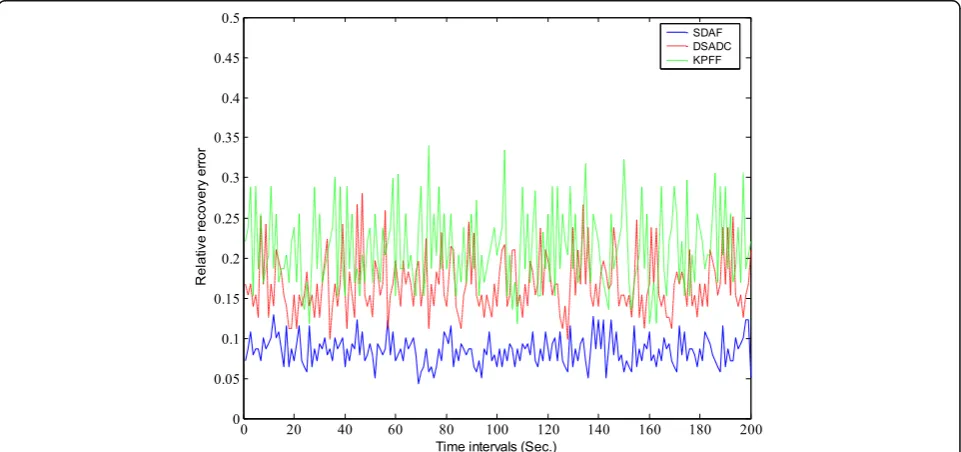
Next, we further study the impact of different outlier probability on relative recovery error and make a compari-son with KPFF [32] and DSADC [33]. Recovery accuracy
Fig. 1Detection accuracy rate. The detection accuracy rate reflects the ratio of outliers being detected to all outliers
is a normally used metric to evaluate the quality of data aggregation algorithms [34]. In this paper, recovery accur-acy is mathematically defined by relative recovery error (RRE), which is the relative difference between original and recovered data matrices. Figures 4, 5 and 6 demon-strate the instant RRE along the timeline.
The obtained results show clearly that applied support degree in such a way is very effective. It also maintains adaptability with different outlier probability. From the
experiment results, it can be seen that the RRE curves of both KPFF and DSADC algorithms fluctuate dramatic-ally. But we can still observe that nearly 90% RRE values of similarity-aware data aggregation using fuzzy c-means approach (SDAF) are below those of DSADC. The error of the fusion results obtained by SDAF is smaller than other methods especially as outlier probability increases. In the process of data aggregation, outlier samples can be identified effectively by diagnosis mechanism in
Fig. 3Deviation degree of aggregation result. Appropriate threshold can be beneficial to detect outliers locally based on the spatial temporal
correlations of the sensor’s samples
SDAF, and the outlier-free readings are further agggated and transmitted to the CH. Therefore, it can re-duce the effectiveness to the aggregation result by data outliers and avoid the possibility of misleading systems into unsafe conditions.
7 Conclusions
To minimize the energy consumption by redundant data and reduce the expense of transmissions to the sink, data aggregation technology is very essential for WSNs.
Data anomaly or deviation will exert a great influence on the quality of aggregated results. In this paper, we have proposed a similarity-aware data aggregation using a fuzzy c-means approach in clustered WSNs. By investi-gating the spatio-temporal correlations of sensor data and local detection of anomalous events, we presented a cluster formation algorithm based on fuzzy c-means ap-proach. Then, we define an effective support degree function for further outlier diagnosis. Finally, based on statistical analysis of the outlier or outlier-free sensor
Fig. 5RRE with outlier probability (10%). RRE can reflect the effectiveness to the aggregation result by data outliers
data, the readings aggregation is conducted. Overall, the simulation results show that the proposed method can achieve better performance than traditional methods in terms of data outlier detection accuracy and relative re-covery error.
In our future work, we plan to conduct the research on the analysis of outlier detection in terms of character-istics like the multi-dimension, detection mode, architec-tural structure, and correlation extraction.
Abbreviations
BS:Base station; CH: Cluster head; FCM: Fuzzy c-means; QoS: Quality of service; RRE: Relative recovery error; SDAF: Similarity-aware data aggregation using fuzzy c-means approach; WSNs: Wireless sensor networks
Acknowledgements
The authors acknowledged the anonymous reviewers and editors for their efforts in valuable comments and suggestions.
Funding
This research was supported in part by the Hubei Provincial Educational Science Program (Grant No. 2018GB073) and the Guangxi Nature Science Fund (Grant No. 2016GXNSFAA380226).
Availability of data and materials
Data sharing is not applicable to this article as no datasets were generated or analyzed during the current study.
Authors’contributions
WR proposes the innovation ideas and theoretical analysis, and XN carries out experiments and data analysis. HQ also wrote parts of the manuscript. SJ and WH participated in the coordination of the study and reviewed the manuscript. All authors read and approved the final manuscript.
Competing interests
The authors declare that they have no competing interests.
Publisher’s Note
Springer Nature remains neutral with regard to jurisdictional claims in published maps and institutional affiliations.
Author details
1Hubei Co-Innovation Center of Information Technology Service for
Elementary Education, Hubei University of Education, Wuhan, China.
2Department of Mathematics and Computer Science, Northeastern State
University, Tahlequah, OK, USA.3School of Computer Science & Engineering,
Guilin University of Aerospace Technology, Guilin, China.
Received: 13 September 2018 Accepted: 21 February 2019
References
1. P. Zhong, Y.T. Li, W.R. Liu, Joint mobile data collection and wireless energy transfer in wireless rechargeable sensor networks. Sensors.17(8), 1–23 (2017).
2. Y.Y. Zeng, C.J. Sreenan, L. Sitanayah, An emergency-adaptive routing scheme for wireless sensor networks for building fire hazard monitoring. Sensors.11(3), 2899–2919 (2011).
3. C. Lin, N. Xiong, J.H. Park, T. Kim, Dynamic power management in new architecture of wireless sensor networks. Int. J. Commun. Syst.22(6), 671– 693 (2009).
4. H.J. Cheng, Y.Z. Chen, N.X. Xiong, Layer-based data aggregation and performance analysis in wireless sensor networks. J. Applied Mathematics. 2013, 1–12 (2013).
5. C. Zhou, S. Huang, N. Xiong, S.H. Yang, Design and analysis of multimodel-based anomaly intrusion detection systems in industrial process automation. IEEE Transactions on Systems, Man, and Cybernetics: Systems. 45(10), 1345–1360 (2015).
6. L. Shu, Y. Zhang, Z. Yu, L.T. Yang, M. Hauswirth, Context-aware cross-layer optimized video streaming in wireless multimedia sensor networks. J. Supercomput.54(1), 94–121 (2010).
7. H.J. Cheng, D.Y. Feng, X.B. Shi, Data quality analysis and cleaning strategy for wireless sensor networks. EURASIP J. Wirel. Commun. Netw.61, 1–11 (2018).
8. K. Lin, J.P.C. Rodrigues, N. Xiong, H.W. Ge, Energy efficiency QoS assurance routing in wireless multimedia sensor networks. IEEE System Journal.5(4), 495–505 (2011).
9. I. Davood, J.H. Abawajy, S. Ghanavati, A data fusion method in wireless sensor networks. Sensors.15(2), 2964–2979 (2015).
10. J.S. Fu, Y. Liu, Double cluster heads model for secure and accurate data fusion in wireless sensor networks. Sensors.15(1), 2021–2040 (2015). 11. L. Xiang, J. Luo, C. Rosenberg, Compressed data aggregation:
energy-efficient and high fidelity data collection. IEEE/ACM Trans. Netw.21(6), 1722–1735 (2013).
12. L.Y. Sun, X.X. Huang, W. Cai, Data aggregation of wireless sensor networks using artificial neural networks. Chinese Journal of Sensors and Actuators. 24(1), 122–127 (2011).
13. J.N. Aikaraki, R. Uimustafa, A.E. Kamal, Data aggregation and routing in wireless sensor networks: optimal and heuristic algorithms. Comput. Netw. 53(7), 945–960 (2009).
14. J. Xu, J.X. Li, S. Xu, Data fusion for target tracking in wireless sensor networks using quantized innovations and Kalman filtering. Science China: Information science edition.55(3), 530–544 (2012).
15. H. Li, H.Y. Yu, Research on data aggregation supporting QoS in wireless sensor networks. Application Research of Computers.25(1), 64–67 (2008). 16. B. Krishnamachari, S. Iyengar, Distributed Bayesian algorithms for
fault-tolerant event region detection in wireless sensor networks. IEEE Trans. Comput.53(3), 241–250 (2004).
17. Y.H. Tan, Y.P. Lin, T. Dong, Real-time detection algorithm for anomaly data in sensor networks. Journal of System Simulation.19(18), 4335–4341 (2007). 18. G.J. Fernandes, J.P.C. Rodrigues, M.L. Proença, Autonomous profile-based
anomaly detection system using principal component analysis and flow analysis. Appl. Soft Comput.34(9), 513–525 (2015).
19. S. Zheng, J.S. Baras, in8th IEEE Communications Society Conference on Sensor, Mesh and ad hoc Communications and Networks(SECON). Trust-assisted anomaly detection and localization in wireless sensor networks (2011), pp. 386–394.
20. S. Hu, G.H. Li, W.W. Lu, Outlier detection methods based on neural network in wireless sensor networks. Computer Science.41(11), 208–211 (2014). 21. R. Kumar, N. Singh, A survey on data aggregation and clustering schemes in
underwater sensor networks. Int. J. Grid Distrib. Comput.7(6), 29–52 (2014). 22. W. Guo, N. Xiong, A.V. Vasilakos, G. Chen, H. Cheng, Multi-source temporal
data aggregation in wireless sensor networks. Wirel. Pers. Commun.56(3), 359–370 (2011).
23. V. Chatzigiannakis, S. Papavassiliou, Diagnosing anomalies and identifying faulty nodes in sensor networks. IEEE Sensors J.7(5), 637–645 (2007). 24. X. Wang, Q. Li, N. Xiong, Y. Pan, inInternational Conference on Wireless
Algorithms, Systems, and Applications (WASA 2018). Ant colony optimization-based location-aware routing for wireless sensor networks (2018), pp. 109–120. 25. F. Herrera, Genetic fuzzy systems: status, critical considerations and future
directions. Int. J. Comput. Intell. Res.5, 59–67 (2005).
26. N. Goyal, M. Dave, A.K. Verma, inInt. Conf. Electron. Commun. Syst. (ICECS). Fuzzy based clustering and aggregation technique for under water wireless sensor networks (2014), pp. 1–5.
27. W.B. Heinzelman, A.P. Chandrakasan, H. Balakrishnan, An application-specific protocol architecture for wireless micro-sensor networks. IEEE Trans. Wirel. Commun.1(4), 660–670 (2009).
28. J.S. Lee, W.L. Cheng, Fuzzy-logic-based clustering approach for wireless sensor networks using energy predication. IEEE Sensors J.12, 2891–2897 (2012).
29. S.M. Reda, M. Abdelhamid, S. Hadj, A. Amar, Performance evaluation of network lifetime spatial–temporal distribution for WSN routing protocols. J. Netw. Comput. Appl.35(4), 1317–1328 (2012).
30. Intel lab data home page.http://db.lcs.mit.edu/labdata/labdata.html. March 20, 2014.
32. H. Harb, A. Makhoul, D. Laiymani, inProc. of the 10th IEEE International Conference on Wireless and Mobile Computing, Networking and Communications (WiMob). K-means based clustering approach for data aggregation in periodic sensor networks (2014), pp. 434–441.
33. G. Fernando, J. Gentian, N. Michele, S. Aldri, Data similarity aware dynamic node clustering in wireless sensor networks. Ad Hoc Networks.24, 29–45 (2015).